This is the website of Abulsme Noibatno Itramne (also known as Sam Minter). Posts here are rare these days. For current stuff, follow me on Mastodon

Categories

Calendar

January 2025
S M T W T F S
 1234
567891011
12131415161718
19202122232425
262728293031  

Oops

plottsdata.php

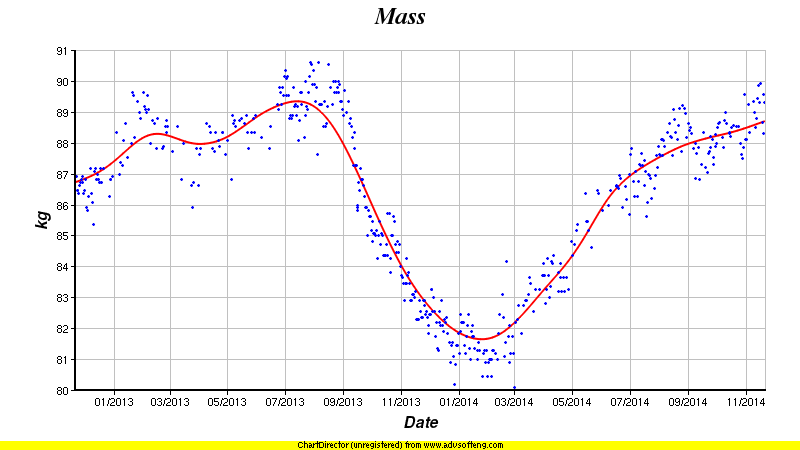
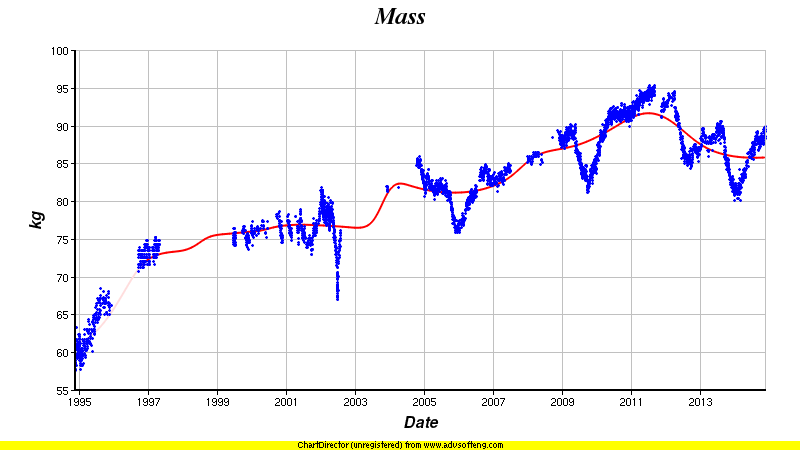
Where I should be based on the middle of the “normal” range for my height… about 68 kg. The top of the normal range for me is 80 kg. Guess I should start doing whatever I was doing August 2013 through January 2014 again, huh? All it was was walking a little bit more and paying attention to what I ingested and stopping before I was stuffed to capacity. Nothing special. But I stopped doing that. Oops.

For the record, the last time I was under 80 kg was in 2006, and the last time I was under 68 kg was in 2002. Before 1995, at the very beginning of the 20 year chart below, I was actually below 57 kg, the bottom of the normal range for my height. My life time high is when I briefly peaked over 95 kg in 2011.
plottsdata.php-2

Curmudgeon’s Corner: Cry Cry Cry

In the latest Curmudgeon’s Corner…

Sam and Ivan talk about:

  • Eurosizes / iPhone 4S / Mophie Cases
  • Republican Circus
  • MF Global / Bank Transfer Day
  • Occupy Update / Greece Update / Google Plusification / Jobs Bio

Just click to listen now:

[wpaudio url=”http://www.abulsme.com/CurmudgeonsCorner/CC20111106.mp3″ text=”Recorded 6 Nov 2011″]

or

1-Click Subscribe in iTunes

View Podcast in iTunes

View XML Feed

Revamped Self-Tracking Dashboard

Screen shot 2009-10-26 at 00.15.45

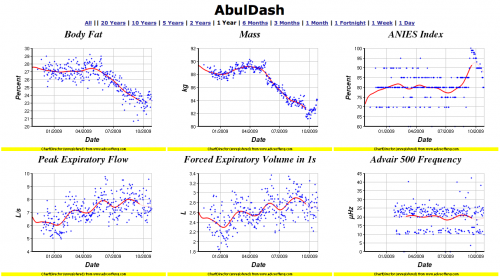
Over the weekend (mostly while holding Alex overnight while he was sleeping and later while sitting with Amy while she did homework) I spent some time reworking a lot of the stuff in my personal dashboard. It is much better now than it was 24 hours ago. The main changes are:

  • Switched from showing each chart in three separate time scales to showing each only once, with the default time scale being one year
  • Added the option to easily change the time scale on both the summary view and on the zoomed views of individual graphs
  • Added “spinners” to indicate when a chart is still loading
  • Converted all units to SI Units in cases where those units were not already in use
  • Gave in and made the assumption of standard Earth gravity to convert weight (force) to mass, thus now giving these sorts of measurements in kilograms rather than Newtons. This may lead to incorrect results if I ever take a weight reading in an area with a strong gravitational anomaly present or while not on Earth.
  • Removed the time scale from each individual chart title as it is now clear from the page headings (and of course the date range on the chart)
  • Reworded many of the chart titles to more clearly explain what they are showing, removing most of the obscure abbreviations and acronyms, although I have left a few in places where I desire to be cryptic
  • Slightly modified the vertical height of the zoomed in graphs to make room for the time scale controls
  • Behind the scenes changed the structure of the PHP to factor out the list of charts, making it easier for me to add, remove or reorder charts in the future
  • Removed several old charts that were no longer being updated or which caused performance problems on the page
  • Added several new charts

Anyway, that is it for now. Enjoy my Self Quantified Self-Tracking Dashboard Thingymajig.

[Edit 0:39 UTC for minor text corrections.]