This is the website of Abulsme Noibatno Itramne (also known as Sam Minter).
Posts here are rare these days. For current stuff, follow me on Mastodon
|
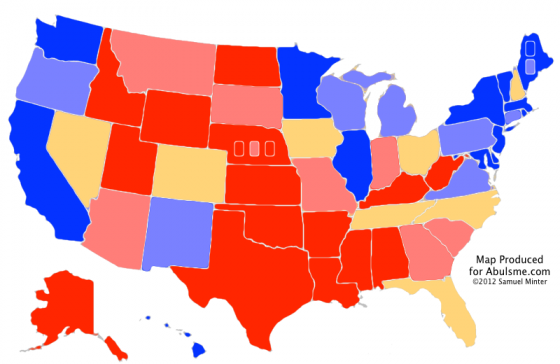
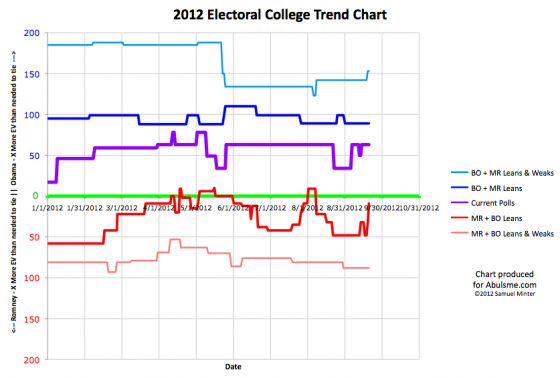
Lots of polls in lots of states, but two changing status today, and they are both important moves… so lets get right to them:
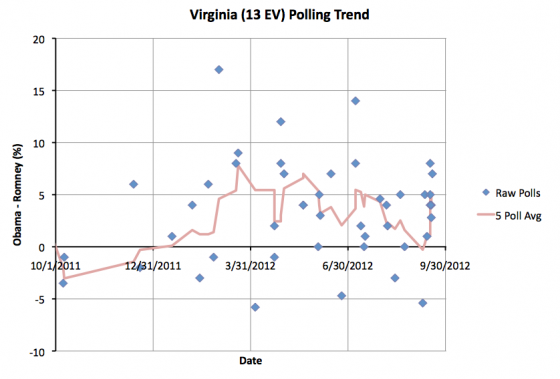
Polling in Virginia has gone into overdrive. In the last month there have been 11 polls added to my spreadsheet for Virginia. Eight of those have been just in the last week. The five poll average now only goes back four days. Things really are speeding up. On September 12th the five poll average in Virginia actually moved to an 0.3% Romney lead. On the 14th Obama took the lead again. Since then Obama’s lead has increased each day there have been new polls.
Today the five poll average goes above 5%. Obama is now ahead by 5.2%. This is just barely past my category boundary, so it would be easy for the next poll to reverse this move, but for the moment, Virginia gets colored blue as it moves from “Lean Obama” to “Weak Obama” in my models. This means that my “Best Case for Romney” model no longer includes the possibility of winning Virginia.
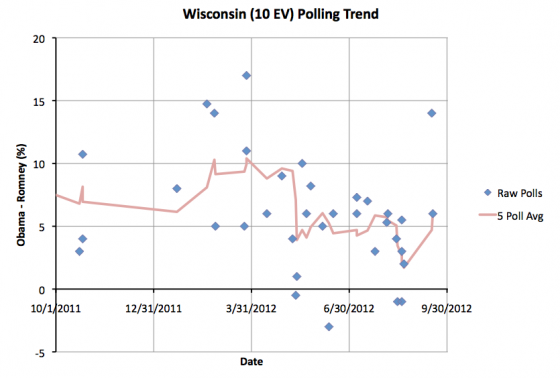
Polling has not been quite as prolific in Wisconsin. The five poll average goes back to August 23rd. At the end of August there were a bunch of polls trying to gauge reaction to the Paul Ryan pick for VP. And indeed, those polls showed Obama’s lead in the state dropping from 5.9% at the end of July, to a low of 1.7% at the end of August. There have only been two new polls since then, one showing a 6% Obama lead, and the other a 14% Obama lead.
The 14% poll seems like it would represent an extrodinary amount of movement, and it may well prove out in the end to be an outlier. We need more polls to validate the true post-Convention situation in Wisconsin. It seems clear there has been movement back toward Obama, but if the 14% poll proves to be an outlier, then the degree of that movement will be exaggerated.
For the moment though, the five poll average moves to an Obama lead of 6.1%. So like Virginia, Wisconsin moves out of Romney’s reach in my models. Even in the case where Romney sweeps all the “close” states, I don’t consider the winning in Wisconsin as part of the picture.
So, the new model summary:
|
Romney |
Obama |
| Romney Best Case |
278 |
260 |
| Current Status |
206 |
332 |
| Obama Best Case |
180 |
358 |
Now, the first thing I want to point out, as I often do, is that this represents “if the election was held today”… which of course it is not. The time left is vanishing quickly, but there is still plenty of time for big movement in the polls and the state of this summary. Things WILL change plenty before election day.
But as of right now… I had mentioned yesterday that we had a “hard map” for Romney. With Virginia and Wisconsin out of play, it becomes even harder. If Romney wins every single close state, he would win by a very slim margin. Only 9 more electoral votes than needed for a tie.
This means Florida (where Obama is ahead by 1.6%), Ohio (where Obama is ahead by 4.2%), North Carolina (where Romney is ahead by 3.6%), Tennessee (where Romney is ahead by 4.2%) and Colorado (where Obama is ahead by 1.4%) are now all must win states for Romney. If he loses any of those five states, he loses the election.
Tennessee looks pretty safe. Romney’s lead is less than 5%, but Obama has never been ahead in the five poll average.
North Carolina looks kinda safe too, but not quite as much. Obama has occasionally been ahead in the five poll average in North Carolina. It has usually been Romney though. A comeback for Obama might be possible there, but the recent trend has been toward Romney, not away from him.
In Colorado, Romney has never been ahead in the five poll average. He has been pretty close though, at one point only being behind by 0.2%. And at the moment that 1.4% is looking well within reach. The recent trend has been toward Romney.
Florida is looking iffier though. The lead in the five poll average has gone back and forth a bit, but for most of the last year, it has shown a very narrow Obama lead. It is a very close state. It could go either way. It is certainly not out of reach for Romney, he can win Florida. But he is behind there now, and has been most of the last year with just a few short spikes where he has been ahead.
Then there is Ohio. Although occasional individual polls have shown Romney ahead, at absolutely no time in the last year has Romney led in Ohio. Romney’s best performance in the five poll average was only being behind by 1.4%. His current 4.2% deficit in Ohio is not an impossible deficit. We call it a close state for a reason. A move that size CAN happen. But Romney has to really move things to get there.
Winning all five of these states will be quite a task. Not impossible by any means, but quite a task.
But remember, even if Romney sweeps these five “must win” states, it only gets him to 262 electoral votes. He would still need 7 more electoral votes to tie, or 8 more to win outright. That means he needs to win two out of three of the remaining close states… Iowa (where Romney is behind by 1%), Nevada (where Romney is behind by 3.8%), and New Hampshire (where Romney is behind by 2.4%).
Romney’s winning scenarios are possible. The paths are just very narrow at the moment.
Romney needs something big to shake up the race and start moving things in his direction. We’ll see what he comes up with. (Or what comes his way via luck or missteps by Obama.)
Note added 2012 Sep 25 12:09 UTC: Polls added to my data on September 25th moved the date Wisconsin moved from Lean Obama to Weak Obama from September 20th (the day of this post) to September 21st.
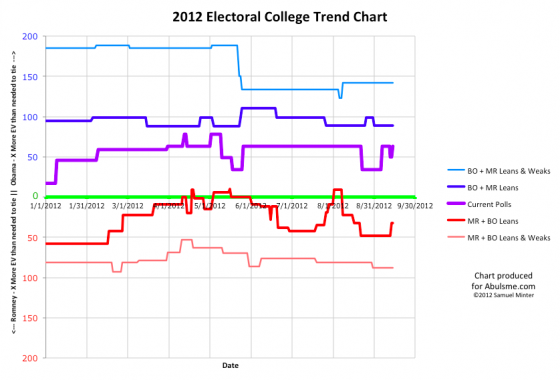
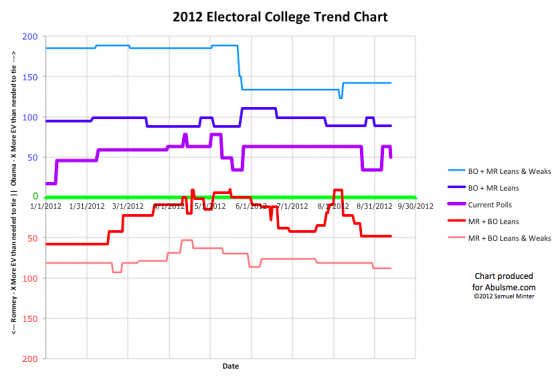
Note: Chart and map from the Abulsme.com 2012 Electoral College Prediction page. Both assume Obama vs Romney with no strong third party candidate and show polling as it currently exists. Things will change before election day. On the map red is Romney, blue is Obama, gold states are too close to call. Lines on the chart represent how many more electoral votes a candidate would have than is needed to tie under several different scenarios. Up is good for Obama, Down is good for Romney.
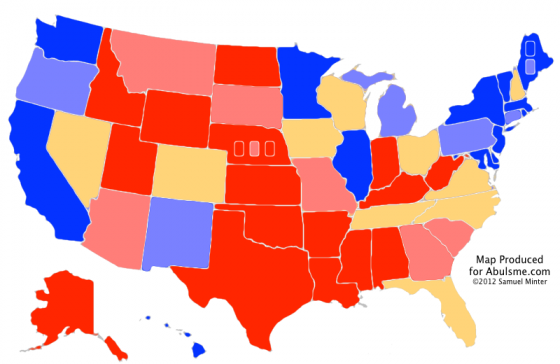
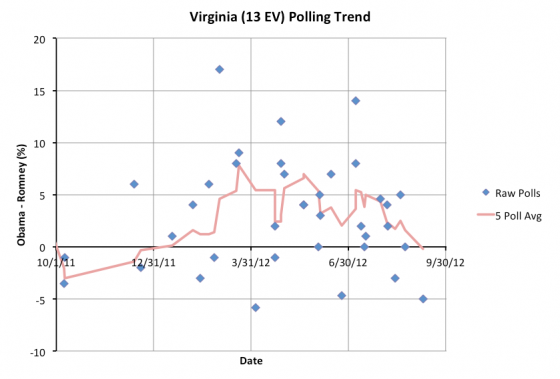
If this one stays as close as it is, it will be annoying to catalog the flips between now and election day between just barely one way and just barely the other way. In any case, Virginia, which moved from Leaning Obama to Leaning Romney in my five poll average on Wednesday, now moves right back where it was with the next new poll:
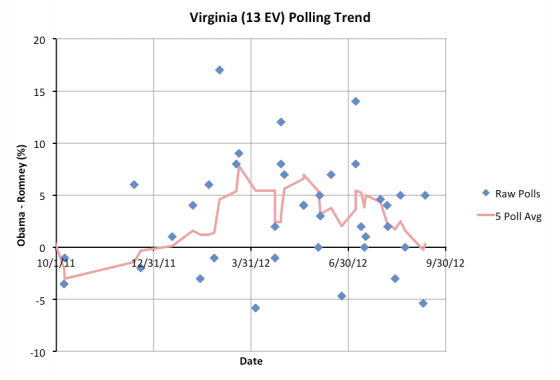
This represents a move in the five poll average from a Romney lead of 0.3% to an Obama lead of 0.3%. I can’t emphasize enough that both of these results just mean a super tight race in Virginia at the moment. It is too close to call. In general I say that any state where the lead is less than 5% should be considered a toss up, simply because that small a lead can disappear quickly. This is why I color all those states the same color on the map, regardless of who is slightly ahead. But 0.3%? For all intents and purposes, the state is tied at the moment.
Of course, you have to keep in mind what “the moment” is. My five poll average in Virginia currently goes back almost exactly a month. A lot has happened in that month. But we’ve only had five polls in Virginia. Two of the five polls have been since the conventions. If you average only those two… you get an 0.2% lead for Romney. Still too close to call. Virginia really does look like a toss up at this point.
Never the less, since the five poll average is slightly on Obama’s side at the moment, we move it to Obama’s side for the “Current” line of our summary, which assumes the candidates win every state where they lead even slightly in the five poll average.
|
Romney |
Obama |
| Romney Best Case |
301 |
237 |
| Current Status |
206 |
332 |
| Obama Best Case |
180 |
358 |
And where does this put us? It puts the current line right back at a 332 to 206 Obama win… Right where the model has been for all but a few scattered weeks since the beginning of April. More specifically 124 of the 167 days since April 1st have had the model at a 332 to 206 Obama win. That’s 74% of the time. The other 26% of the time things have looked a bit better for Romney, or a bit better for Obama… more often a little bit better for Romney… but then we’ve reverted right back to good ol’ 332 to 206.
Even when states have come and gone from the set of close states, changing either Romney or Obama’s “best case” where they win all the close states, the model line in the middle has stayed remarkably stable.
Compare this to my analysis exactly four years ago. If you look at the center line of that chart (a double pink/blue line rather than this year’s purple) you’ll see that between March and September it was moving all over the place. (In interpreting the old charts, keep in mind that last time around down was good for Obama, this time up is good for Obama.) This year things are just remarkably stable in comparison.
It is also interesting to note that by this time four years ago the “lead” in the race had changed hands five times. (And it would change hands two more times before the election.) In comparison this time the lead has changed hands… well, never. Obama has been ahead from the start.
But to show how things can change in the final stretch to November: On September 14th 2008, the current state of the polls was actually showing a 269-269 tie. Obama of course went on to win 365 to 173. In the last month and a half of the campaign, 96 electoral votes moved onto Obama’s side of the line. So big movements are possible in relatively short amounts of time.
Even having said that though, if I had to make a bet right now, I’d bet on a 332 to 206 Obama win. This time around even when the polls move from that spot, they seem like they keep wanting to go back there. :-)
Note: Chart and map from the Abulsme.com 2012 Electoral College Prediction page. Both assume Obama vs Romney with no strong third party candidate and show polling as it currently exists. Things will change before election day. On the map red is Romney, blue is Obama, gold states are too close to call. Lines on the chart represent how many more electoral votes a candidate would have than is needed to tie under several different scenarios. Up is good for Obama, Down is good for Romney.
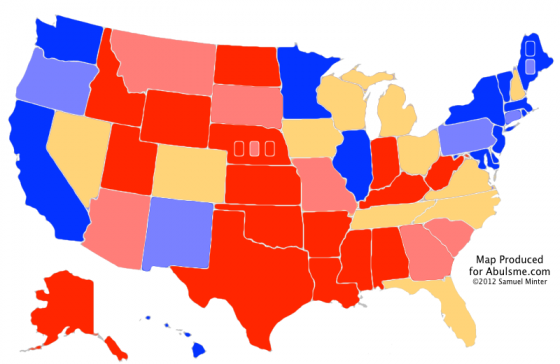
One state changes status today and it moves in a surprising direction given the overwhelming talk of the Obama bounce following the Democratic Convention. Virginia moves from just barely Obama, to just barely Romney:
Since the Conventions ended, I’ve added polls in AL, AZ, FL, IL, MA, MN, NC, NJ, NM, OH, VA and WA. Twelve states. Eleven of these states didn’t change categories. Now the first one does, and it is Virginia. Not moving toward Obama, but moving toward Romney. But what about the bounce?? Aren’t all the polls showing a massive movement toward Obama right now? What is going on?
Well, the national polls have been showing that kind of move. The expectation is that the state polls will naturally follow. If the “bounce” lasts awhile and does not immediately fade, then they probably still will. But so far that just isn’t showing up. Now, since I use a five poll average, even if there is a move on one new poll, it might not cause a category shift right away. In most of these cases though, the new polls at the state level have been right in the same general range as the polls from before the conventions. Perhaps there has been some movement, just none that has moved any state to a new category in my model.
Until Virginia. Moving toward Romney. The five poll average moves from an Obama lead of 1.6% to a Romney lead of 0.2%. As usual when states move from “leaning” one way to “leaning” I will point out that any lead under 5% can disappear overnight with the right set of things in the news. I color all the states where the lead is less than 5% the same color on my map. These states really are close. They could go either way. And the states where the margin is less than 2%? Even more so. You might as well flip a coin.
So one should be very careful ascribing too much significance when one state flips back and forth across the line. The “current” model does move in this case… where every state goes the way the five poll average stands today. But I list the two “best case” scenarios here for a reason. To see where we really are, you need to look at that full range of possibilities. (Although of course we’re more likely to get a result “toward the middle” than near the edges of this range where one or the other candidate sweep all the close states… itself an unlikely scenario.)
In any case, the new update to the models:
|
Romney |
Obama |
| Romney Best Case |
317 |
221 |
| Current Status |
219 |
319 |
| Obama Best Case |
180 |
358 |
Bottom line, Obama is still ahead. He has a much stronger position. But Romney does have multiple ways to win. If the conventions have produced a bounce that improves Obama’s position substantially, it isn’t showing up in the electoral college yet.
My prediction from my last update that the beginning of September was going to be Romney’s peak in my model looks like it hasn’t come to pass though. My model shows Romney in a bit better position now than he was at the time of that update. Oh well! (Edit 2012 Sep 13 16:25… actually, my prediction was that the beginning of September would mark Romney’s peak. Although Virginia flipping did improve Romney’s position over the last update, it still isn’t as good as it was at the beginning of September, so my prediction has actually held so far…)
Conventional wisdom is that you have to wait for a couple weeks after the convention for public opinion to “settle down”. Add to that the fact that if you are looking state by state you have to wait for the critical states to get polled and you realize we’ve still got very incomplete information at the state level.
Since the conventions ended, of the close states Florida (29), Ohio (18), North Carolina (15) and Virginia (13) have been polled. Of these, only Ohio has been polled more than once. No new polls at all yet for Michigan (16), Tennessee (11), Wisconsin (10), Colorado(9), Iowa (6), Nevada (6), or New Hampshire (4).
So… we still need to wait for a bit more polling to see where things really stand in this post convention stage. Polling should be continuing to accelerate as we approach November, so with luck we won’t have to wait too long.
Note: Chart and map from the Abulsme.com 2012 Electoral College Prediction page. Both assume Obama vs Romney with no strong third party candidate and show polling as it currently exists. Things will change before election day. On the map red is Romney, blue is Obama, gold states are too close to call. Lines on the chart represent how many more electoral votes a candidate would have than is needed to tie under several different scenarios. Up is good for Obama, Down is good for Romney.
Edit 2012 Sep 12 11:13 UTC to correct the list of states with polls added since the convention to include AL and NJ, which I’d forgotten.
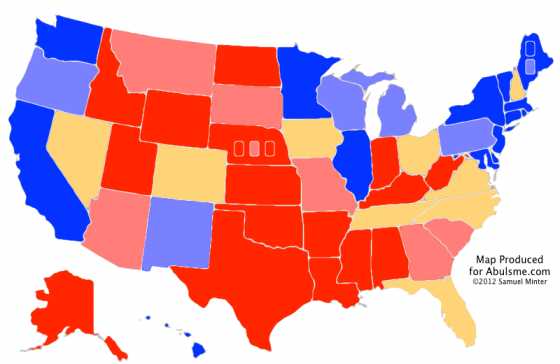
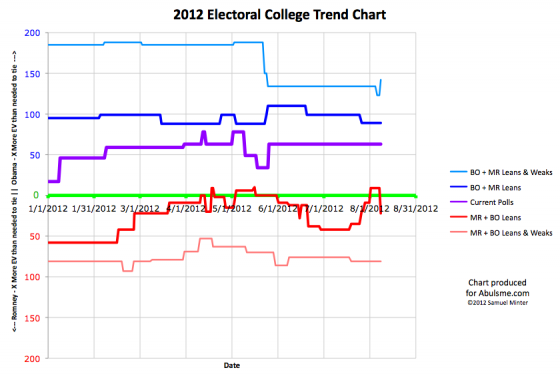
Chart and map from the Abulsme.com 2012 Electoral College Prediction page. Both assume Obama vs Romney with no strong third party candidate and show polling as it currently exists. Things will change before election day. On the map red is Romney, blue is Obama, gold states are too close to call. Lines on the chart represent how many more electoral votes a candidate would have than is needed to tie under several different scenarios. Up is good for Obama, Down is good for Romney.
Four states change categories today. In all four cases, the races look a little closer than they did. The impact is different in these cases, so lets look at each one. In order from the smallest number of electoral votes to the greatest…
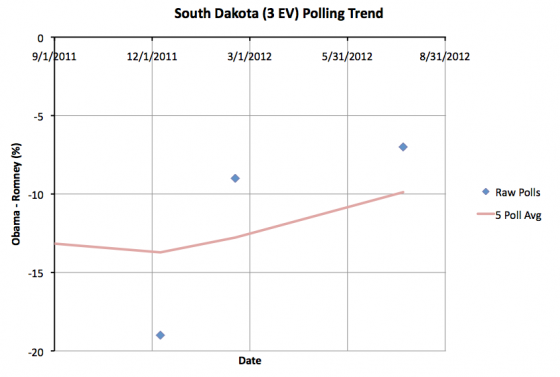
South Dakota (3 ev): South Dakota has been very sparsely polled. The poll added today is only the 3rd one in the last year and only the 4th since the 2008 election. With this update the 5 poll average (which includes the 2008 election to fill out the average) drops to a Romney lead of 9.9%. This is less than the 10% threshold I use, so I move the state from “Strong Romney” to “Weak Romney”. But obviously South Dakota is nowhere close to being a competitive state. It would take a move of epic proportions to actually make South Dakota a competitive state. But the three polls this year do seem to show that Romney’s lead is a bit less than it once was.
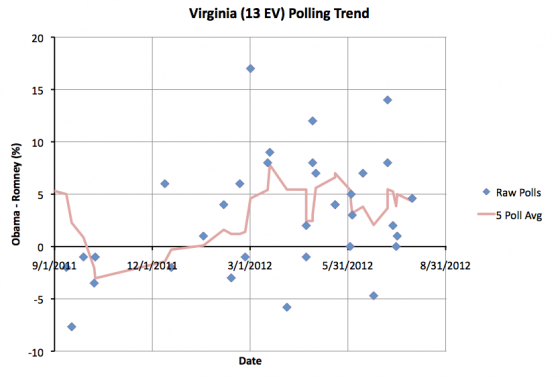
Virginia (13 ev): Obama’s lead in the five poll average had touched 5%, moving it out of the close state category, but it didn’t last. The latest poll added to the average brings Obama’s lead back down to 4.3%. This means Virginia is once again one of the states I consider close enough that it could easily go either way depending on the events of the campaign. This will improve Romney’s “Best Case” in my models. Virginia has been close for most of the last year so it is not surprising to see it here again.
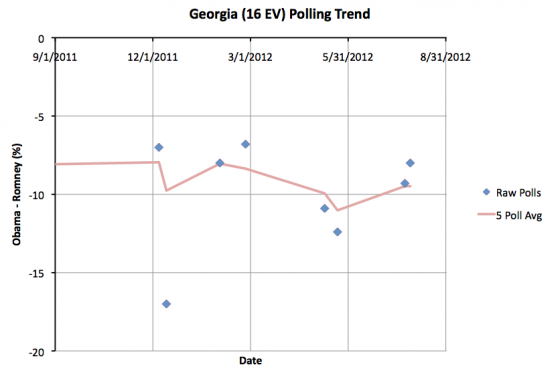
Georgia (16 ev): With two new polls added today, Romney’s lead in Georgia drops to 9.5%. Since this is below 10%, we move the state to “Weak Romney”. As with South Dakota, this is still a pretty substantial lead, and absent a major Romney collapse, it is unlikely to see Georgia actually become a competitive close state. But it is once again in the category where perhaps Romney shouldn’t take it completely for granted. Well, OK, he mostly can. But his margins do look a little bit less than they did before.
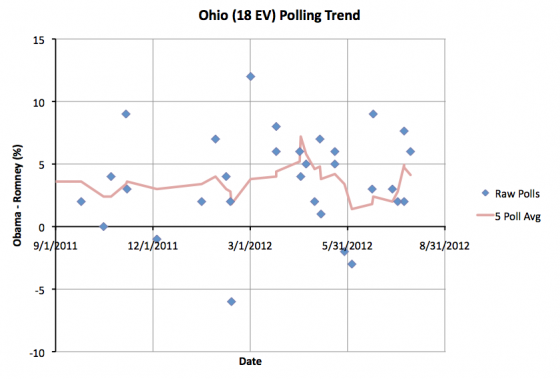
Ohio (18 ev): Along with Virginia, this is the other one that “matters” to the model. In my August 1st update the 5 poll average in Ohio jumped to 5.5%, moving it out of my swing state category. In today’s update we add a new poll… actually one that ended back on July 24th, prior to the last poll included in my last update, but which I just found (via Darryl at HorsesAss) so it counts for today*… and that new poll pulls Obama’s lead back down to 4.1%. So after the brief interlude as a blue state, Ohio is once again where it has been most of the year… with an Obama advantage, but not a huge one. So it is easy to imagine scenarios where Romney pulls it back over onto his side of the fence.
When you add up the changes in these four states, what do you get?
Well, South Dakota and Georgia really don’t change anything. For those two states, it isn’t about who will win, it is just about how much Romney will win by… which really doesn’t matter.
Virginia and Ohio on the other hand… they matter, and they are pretty big states. With both of these states on the table again, Romney’s best case improves considerably:
|
Romney |
Obama |
| Romney Best Case |
291 |
247 |
| Current Status |
206 |
332 |
| Obama Best Case |
180 |
358 |
With this new configuration, Florida (29 ev) is a must win state. Romney can’t win without it. He could lose any one of Ohio (18 ev), North Carolina (15 ev), Virginia (13 ev) or Tennessee (11 ev), but only one of them. Colorado (9 ev), Iowa (6 ev), Nevada (6 ev) and New Hampshire are more flexible. There are a number of different “paths to victory” here now.
Now, most of these states (all but North Carolina and Tennessee) are ones where Obama has the lead at the moment, even if it is a small lead. To actually win, Romney has to actually start pulling ahead in some of these states rather than just reducing Obama’s lead.
That may be next. With a VP announcement “any time now” and the Republican Convention just around the corner, movement toward Romney should probably be expected. The questions will be: “How much movement?” and “Does it last?”.
(Spoilers: Convention bounces usually last about a week before things revert to where they were before, and VP choices only rarely end up making a difference.)
* If there is anybody who cares about the details and wonders why I didn’t do a retroactive adjustment of the historical graphs because I included an older poll that changed things, here is a long geeky explanation of my process: Basically, if you judge by the “end date” of the polls, polls come in out of order all the time. It takes pollsters a few days to compile and release their data, then sometimes it take a bit before it shows up on one of the three sources I use to collect poll data. If a new poll is within the “Last 5”, then I just treat it as current new data, regardless of the end date on the poll and if it is really the most recent to end. In this case, the poll wasn’t the newest, but it was the second newest. The last two polls had just gotten to me in reverse order, which happens pretty frequently. It is a little unusual that by the time I included it, the poll end date was about two weeks old, but it was still the second most recent poll. So it just got folded into the average normally. If I become aware of polls that are older than the Last 5, and those polls would have changed the category of any states, then I’ll fold a correction into my next update. Also while I’m giving esoteric details… The historical electoral college trend lines are based on the date new polls are included in my model (except when polls older than the most recent 5 are added), while the state polling trend chart uses the end date of the polls, which means they don’t always match exactly. So, for instance, the peak over 5% in Ohio has indeed disappeared with this new poll, instead now only peaking at 4.9%. The end dates of the polls are also used to determine just which polls are in the “Last 5” to begin with. In the case of multiple polls with the same end date, the tie breaker is the time they were added to my model.
Edit: 2012 Aug 8 08:15 to add that last parenthetical.
Edit: 2012 Aug 8 16:31 to add * note.
Edit: 2012 Aug 8 17:50 to correct one detail on the * note.
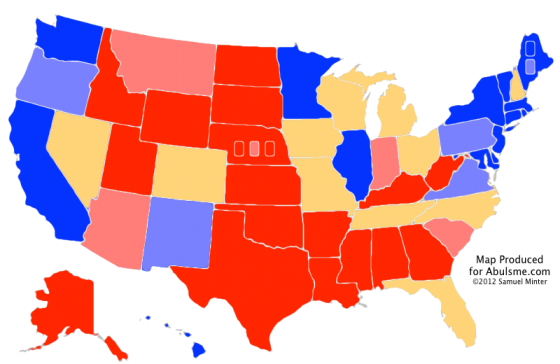
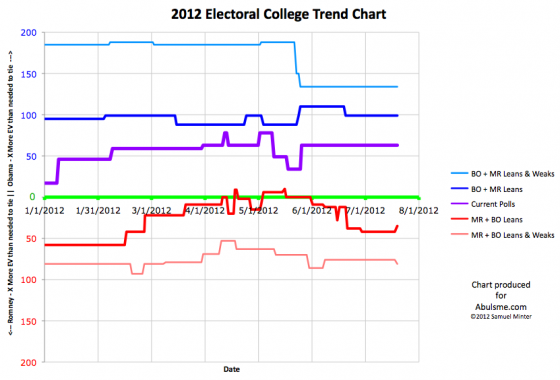
Chart and map from the Abulsme.com 2012 Electoral College Prediction page. Both assume Obama vs Romney with no strong third party candidate. Both show polling as it currently exists. Things will change before election day. On the map red is Romney, blue is Obama, gold states are too close to call. Lines on the chart represent how many more electoral votes a candidate would have than is needed to tie under several different scenarios. Up is good for Obama, Down is good for Romney.
We haven’t had an update to the status of any state in my model since June 29th. This is the longest stretch without an update since I started tracking this year’s electoral college race at the end of January. Now, the July 4th holiday was in the middle of that, and so polling was sparse for awhile, but still, there were plenty of polls, they just didn’t actually move states into new categories. Until today. We finally get three states moving today. Two move in Romney’s direction, one moves toward Obama.
So, in order by electoral weight:
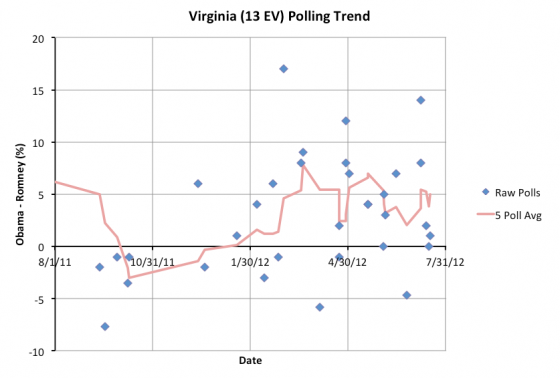
I added three new polls to the database for Virginia (13 ev) today and between them the five poll average pops up to exactly 5.0%, which puts Virginia back in the “Weak Obama” category, but just barely. The next poll could easily knock Virginia back into a less than 5% lead for Obama and make the state a swing state again. But for the moment, we take Virginia off the list of states where Romney has a shot.
One thing to note about the Virginia results. One of the new polls I added today was a PPP poll that ended July 8th that included the Constitution Party Candidate, Virgil Goode, who took 9% of the vote, mostly from Romney, which of course improves Obama’s position. Generally I find out about polls quicker than that, but today is the first day this one popped up in one of the sources I use regularly.
My policy generally is to use polls that include third parties as long as the people they include are definite candidates and not speculative. Goode was named the candidate for the Constitution Party back in April, so he counts. Because of this I also retroactively added another Virginia poll from April that included Goode. This changes the historical chart slightly, as that old poll expands Virginia’s previous experiment with being “Weak Obama” from having covered just May 26 to June 4th, to covering the longer period May 4th to June 8th. One should note of course that support for third party candidates typically collapses as election day approaches.
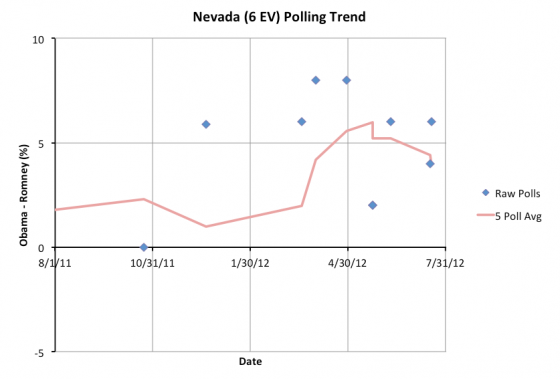
Next up is Nevada (6 ev). Recent polls show Obama’s lead slipping below 5%. So Nevada once again drops into swing state status. Obama’s lead in the five poll average is now 4.0%, which is not insubstantial, but is potentially within reach for Romney if events and the campaign narrative go his way. A 4% lead can disappear overnight with the right events in the news. So winning Nevada is once again considered part of Romney’s best case.
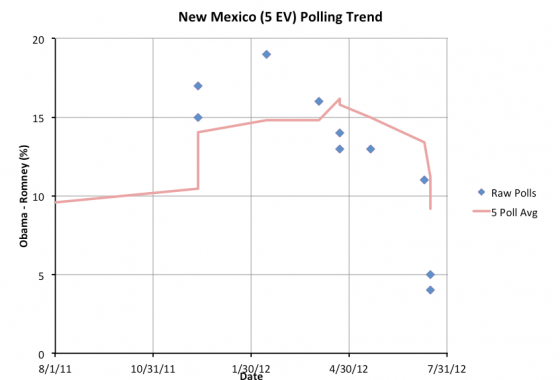
And finally New Mexico (5 ev). Obama’s lead in the five poll average drops under 10%, so I move it from “Strong Obama” to “Weak Obama”, but it is still not particularly close. Obama’s lead has to drop a lot more before it gets into swing state territory. Having said this, the last two polls in New Mexico are a very significant drop from earlier polls, and show things getting a lot closer. Both of these polls are from PPP though, one including Libertarian Gary Johnson, and one not including him. Since both polls are from one source, taken from the same underlying sample I believe, there is a chance they are outliers. We’ll have to wait for more polls to confirm. If this turns out to be real movement rather than sampling error, then this could be a pretty significant movement away from Obama in New Mexico.
So what does all this do to the overall situation? Well, New Mexico’s change does not effect the inventory of swing states, so it doesn’t affect the three main lines in our model at all. Nevada moves into swing status, but Virginia leaves it. Virginia is bigger, so today’s net effect is to make Romney’s best case worse by 7 electoral votes:
|
Romney |
Obama |
| Romney Best Case |
304 |
234 |
| Current Status |
206 |
332 |
| Obama Best Case |
170 |
368 |
So, as a whole, Obama wins today’s updates. But Romney still has a variety of paths to victory. Over the course of June, he took a lot of states Obama was ahead in by more than 5% and made them close. Virginia has hit 5% again, but just barely. That may be ephemeral. We have a ton of states that are close right now. True, most of them are still on Obama’s side of the line, and Obama still wins handily if he takes every state he is ahead in. But you have to make states close before you make them yours, and Romney has slowly but surely been doing that.
Romney did have a bad week last week, but state polls are sparse enough, it takes more than a few days of bad news for a trend to start showing up in the electoral college models. If the current status in Virginia gets confirmed by more polls, and other states start going that way too, then perhaps this is a start of a movement back away from Romney and toward Obama. But for the moment it is too early to tell.
Edit 2012 Jul 20 14:04 UTC: Actually updated the historical chart with the Virginia correction, which I’d neglected to do when this was first posted. Sorry!
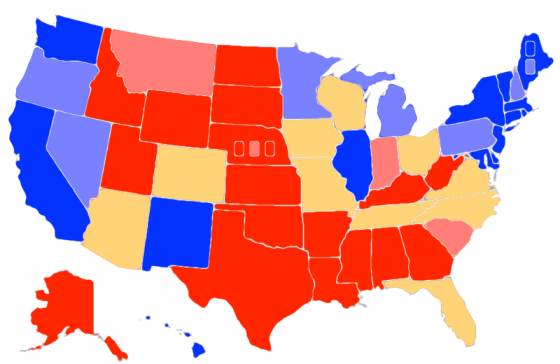
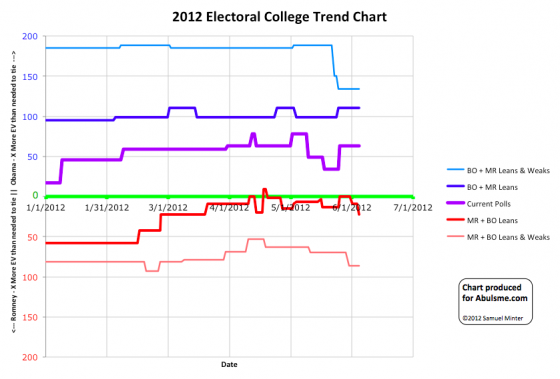
Chart and map from the Abulsme.com 2012 Electoral College Prediction page. Both assume Obama vs Romney with no strong third party candidate. Both show polling as it currently exists. Things will change before election day. On the map red is Romney, blue is Obama, gold states are too close to call. Lines on the chart represent how many more electoral votes a candidate would have than is needed to tie under several different scenarios. Up is good for Obama, Down is good for Romney.
One state changes status today, and for the third time in a row, it is a change in Romney’s direction…
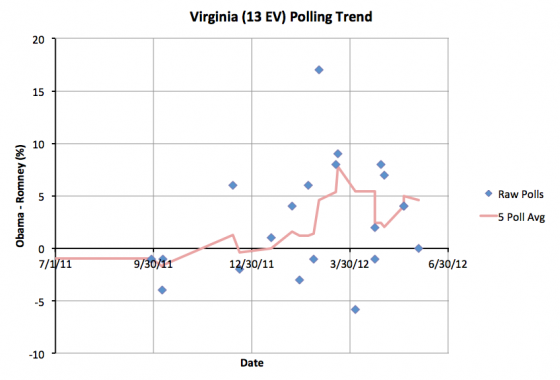
For a brief period starting May 26th, Obama’s lead was 5% in the five poll average in Virginia which put it in my “Weak Obama” category. No more. With today’s update it falls to 4.6%. So we once again move Virginia to “Lean Obama” which means it is a swing state in my model. This means Romney’s “best case” improves…
|
Romney |
Obama |
| Romney Best Case |
291 |
247 |
| Current Status |
206 |
332 |
| Obama Best Case |
159 |
379 |
Romney’s best case now has him with 22 more electoral votes than he needs to tie. He is still significantly behind in terms of disposition of the swing states… there are many more ways for him to lose than there are to win… but he has many more different paths to win now. Florida (29) is now the only “must win” state that he just can’t win without. He can now afford to lose some of the others.
Romney is doing what he needs to do, pulling “Weak Obama” states back down to where they are close and in contention. This is opening up the race a bit. If this trend continues, and if Romney is also able to start pulling some “Lean Obama” states to “Lean Romney”, and some “Lean Romney” to “Weak Romney” (taking them out of play for Obama) then this might start to become the close race that some commentators talk as if it already is.
Edit 2012 Jun 5 17:18 UTC – Corrected wording which stated Obama’s five poll average was over 5%, when actually it was exactly 5%.
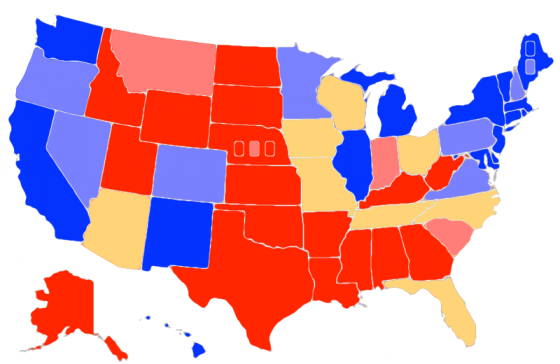
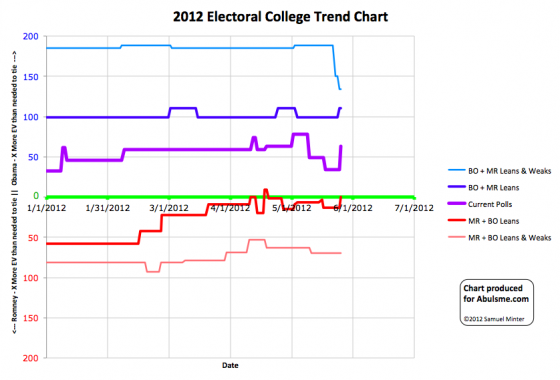
Chart and map from the Abulsme.com 2012 Electoral College Prediction page. Both assume Obama vs Romney with no strong third party candidate. Both show polling as it currently exists. Things will change before election day. On the map red is Romney, blue is Obama, gold states are too close to call. Lines on the chart represent how many more electoral votes a candidate would have than is needed to tie under several different scenarios. Up is good for Obama, Down is good for Romney.
Two states changing status today, both moving toward Obama:
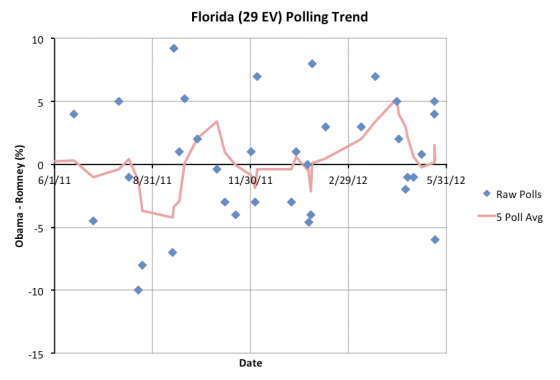
First up Florida (29). Bottom line is Florida is too close to call. It has been too close to call for almost all of the last year. (The exception was two whole days in April where Obama’s lead in the five poll average went over 5%.) The rest of the time, one of the swingiest of swing states. Most recently, from May 10th until today, Romney was every so slightly ahead in the five poll average. Now Obama is ever so slightly ahead (0.3% actually). The next poll could move it back over the line to Romney. Bottom line, don’t put too much weight on what side of the line the too close to call states are on at any given moment. There is a reason I color them all the same on the map.
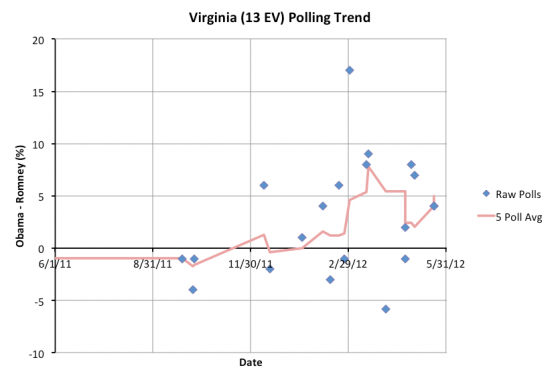
Next we have Virginia (13). Obama’s lead in the five poll average gets up to 5.0% which means by my classification it is no longer a swing state, but now gets listed as a “Weak Obama” state. Generally speaking that means he has a healthy lead at the moment, but not so big a lead as would allow him to take the state for granted and ignore it.
Virginia no longer being a swing state takes the possibility of winning it out of Romney’s best case in the summary, which leaves us in a fun place…
|
Romney |
Obama |
| Romney Best Case |
269 |
269 |
| Current Status |
206 |
332 |
| Obama Best Case |
159 |
379 |
Yes, we are once again in a situation where even if Romney won all the states he is ahead in, plus all the states Obama is ahead in by less than 5%, the result would be a TIE in the electoral college, which would throw the election to the House. In such a scenario, given the makeup of the House, Romney would almost certainly win.
It is a fun scenario to think about. It is however an unlikely scenario. My model doesn’t produce odds, but Darryl’s at HorsesAss does, and in his latest analysis he has the odds of a 269/269 tie at just about 0.05%. So about 1 in 2000. So pretty long odds.
Which is a shame, because that would be really fun to watch. It hasn’t happened since 1824, isn’t it about time?
More to the point though, Romney is back to the very weak position he had in mid-April, and it seems that a lot of the gains he had been making in May have evaporated.
For now anyway.
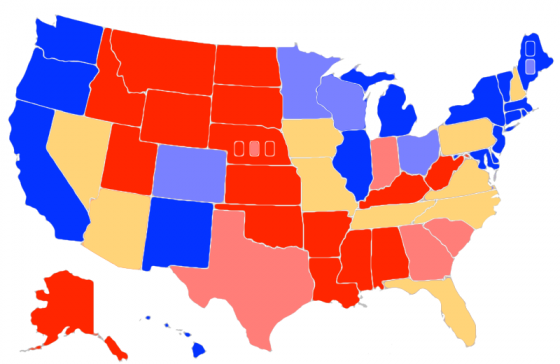
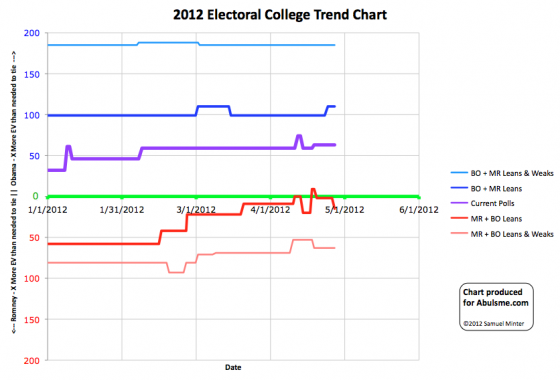
Chart and map from the Abulsme.com 2012 Electoral College Prediction page. Both assume Obama vs Romney with no strong third party candidate. Both show polling as it currently exists. Things will change before election day. On the map red is Romney, blue is Obama, gold states are too close to call. Lines on the chart represent how many more electoral votes a candidate would have than is needed to tie under several different scenarios. Up is good for Obama, Down is good for Romney.
One state changing categories today. Virginia.
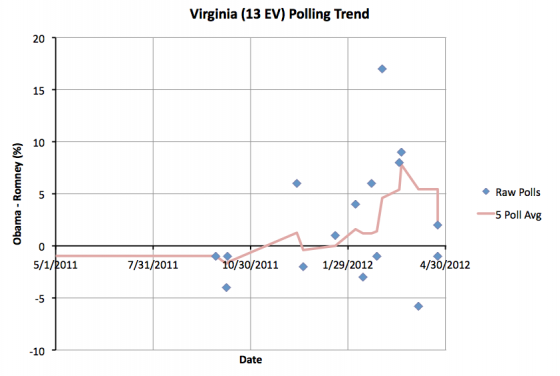
As you can see, The 5 poll average once again drops below 5%, moving the state from “Weak Obama” to “Lean Obama” and making Virginia once again one of the states we consider to be a swing state. The big effect here is the March 2nd Marist poll which showed Obama up by 17 in Virginia rolling off the 5 poll average. That poll was clearly an outlier. Even without it, we see a trend toward Obama around that time, but it wouldn’t have been large enough to move the average over a 5% lead without that one poll. In addition, the more recent polls have been moving in Romney’s direction. In any case, as of now the new 5 poll average has Obama up in Virginia by 2.4%. Clearly in the swing state category.
This change improves Romney’s best case scenario (where we give him all the swing states):
|
Romney |
Obama |
| Romney Best Case |
284 |
254 |
| Current Status |
206 |
332 |
| Obama Best Case |
159 |
379 |
Since Santorum dropped out on April 10th, there have been 11 changes to state categories. In the case of Florida (29 ev) and North Carolina (15 ev), they changed categories, but already changed back to where they were… so no net change. Ohio (18 ev), Arizona (11 ev), Colorado (9 ev) and New Hampshire (4 ev) moved toward Obama. Pennsylvania (20 ev), Virginia (13 ev) and Wisconsin (10 ev) moved toward Romney. The main net effect is slightly more electoral votes in the swing state category, so a bit larger range between Obama’s best case and Romney’s best case.
Comparing to my last update before Santorum dropped out…
- Romney has improved his best case from 278 electoral votes to 284 electoral votes
- Obama has improved his best case from 368 electoral votes to 379 electoral votes.
- The “everybody gets every state they are ahead in even slightly” result changes from Obama winning 328 to 210 to Obama winning 332 to 206.
All in all, the main result here is the race opening up since the last small doubts of Romney being the nominee were put to rest. The polls are tightening and more states are up for grabs. Obama still has a big advantage in the electoral college… for the moment. It has only been 17 days since Santorum dropped out. My expectation is that this race becomes closer as events play out over the next few months.
Edit 2012 May 2 13:10 UTC – Adjusted horizontal scale on Virginia Graph
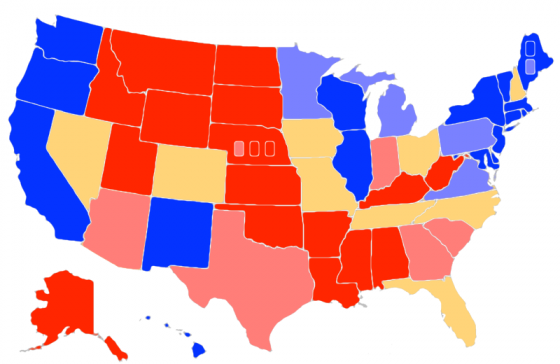
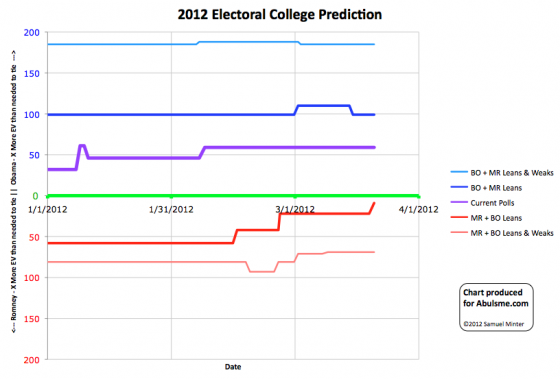
Map and chart from the Abulsme.com 2012 Electoral College Prediction page. Both assume Obama vs Romney with no third party strong enough to win states. Lines on the chart represent how many more electoral votes a candidate has than is needed to tie under several different scenarios. Up is good for Obama, Down is good for Romney.
Surely we must be close to Romney’s nadir, right? We expect him to suffer in the polls while going through his primary battle, but once it becomes clear he is the nominee and he can start pivoting to the general election, he should start fighting back. Right? That’s what we expect? Romney should hope that this is his low point, because his best case is now just barely squeaking out a win…
The new update today to my “last five poll average” for Virginia pushes Obama’s lead to over 5%. So I move the state out of the swing state category and into “Weak Obama” which I color light blue above.
This change makes our summary look like this:
|
Romney |
Obama |
| Romney Best Case |
278 |
260 |
| Current Status |
210 |
328 |
| Obama Best Case |
170 |
368 |
This means that in Romney’s best case (that is, he wins every single swing state), he wins with only 9 more electoral votes than the 269 needed to tie. That is getting awfully close.
That would mean that out of the nine swing states (defined as states where the leading candidate is ahead by less than 5% in the polls)…
- Romney MUST win Florida (29), Ohio (18), North Carolina (15), Tennessee (11) and Missouri (10) to win.
- He could afford to lose ONE of Iowa (6), Nevada (6) or New Hampshire (4) and still win.
- If he won all the rest, but lost Colorado (9) then we’d end up with a 269 to 269 tie, which would throw the election to the House of Representatives (voting by state delegation) which would likely result in a Romney win as well.
(Meanwhile, in Obama’s best case, he wins with 99 more electoral votes than needed to tie.)
That is of course if the election was today, which it is not. We have a long way to go. These lines will move up and down quite a bit before we get to November.
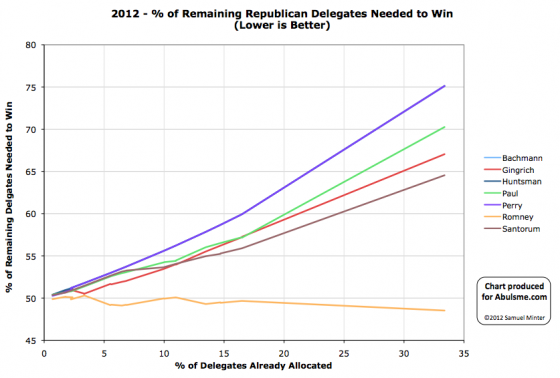
Chart from the Abulsme.com 2012 Republican Delegate Count Graphs page. When a candidate gets down to 0%, they have cinched the nomination. If they get up past 100%, they have been mathematically eliminated. Rather than the date on the x-axis, we show the “% of Delegates Already Allocated” as this better represents the progress through the race. Note that these numbers include estimates of the eventual results of multi-stage caucus processes which will be refined as the later stages occur.
So, Super Tuesday happened. As of this update, Green Papers has “called” 385 of the 419 delegates available from the Super Tuesday contests. There are 34 delegates that haven’t been determined yet that will result in updates later, but of the ones we do know, the estimates for Super Tuesday contests are: Romney 208, Santorum 84, Gingrich 72, Paul 21. Romney also picked up a Superdelegate, bringing the total for the day to Romney 209, Santorum 84, Gingrich 72, Paul 21.
Compared to the Sabato Crystal Ball projections which we used to game out Super Tuesday over the weekend, Romney performed better than expectations, as did Gingrich. Santorum and Paul underperformed compared to those predictions. In any case, where does this put us…
Bottom line, Romney is the big winner today, and this may be the start of him actually pulling away and heading toward the nomination, but he is still not out of the woods in terms of the danger of being blocked from 1144. Lets look at the details.
The situation for Santorum, Gingrich and Paul is essentially what I mapped out in the gaming Super Tuesday post. To paraphrase what I said there, it is now absolutely undeniably clear (although the trend was obvious even before today) that none of these three guys are on a path to the nomination. Of the three, Santorum is doing the best, but with today’s numbers, to be on a path to win, he would need to now get 64.5% of the remaining delegates, compared to the 21.1% he has gotten so far. For this to even come into the realm of possibility, Gingrich and Paul would both have to stop getting delegates, Santorum would have to pick up all of their support, AND something would need to happen to cause support for Romney to plummet. This is a very unlikely sequence of events. It isn’t going to happen.
Oh, I guess I should also note that Gingrich pulled back ahead of Paul for 3rd place.
The remaining question is: “Are the non-Romney’s collectively still in a position to potentially block Romney from getting to 1144?” If after today, Romney was under 50% of the total delegates, and his “% of remaining needed to win” was heading upward or flat, this is a possibility that would be looking like it was still very much in play. But Romney exceeded the 49.7% of delegates he needed in order to be on track toward 1144, and did it by a decent margin. Of the delegates in today’s total, he picked up 209 of 386, or 54.1%. This reduced his “% of remaining needed to win” from 49.7% to 48.5%. That means to block, the non-Romney’s collectively need to be getting 51.5% of the delegates, compared to the 46.9% they have managed so far. So they have to do better than they have been so far, and by a non-trivial margin. And they have do do this even though it is obvious none of them can win outright. It has to be about stopping Romney.
Now, the rest of March has a bunch of states that are supposed to be relatively good for the non-Romneys. So the non-Romney’s managing to get 51.5% in the next few state is very much within the realm of possibility. After that we hit more Romney friendly states in April. The thing to watch for in the upcoming states is not who wins the popular vote, or even the delegate count. The question will be: “Is Romney continuing to get enough delegates to avoid being blocked?” Right now, that magic number is 48.2%. As long as he is getting 48.2% of the delegates (or more) then he is marching his way toward the nomination. If he gets less than that, then blocking will remain possible a little bit longer. If the rest of March really is friendly to the non-Romneys, we may see that Romney’s “% needed to win” starts heading back up a bit before Romney hits friendly states again and starts fully pulling away. As long as we see that happening, blocking Romney is still a possibility. And indeed, if Romney is damaged by the contests in March and his April states start looking not so good after all, then blocking starts looking more real again.
But Romney’s “% of remaining needed to win” is the smallest it has been so far, and none of the other candidates have realistic shots at winning, only a shot at blocking that relies on them continuing to win delegates even though it is obvious they can’t win, so Romney is in a pretty good position right now. Watch that line though. Until it starts heading downward decisively, Romney hasn’t got it wrapped up just yet.
So what is next? Well, first, the last 34 delegates from Super Tuesday (they are from Georgia, Ohio and Tennessee). Then on Sunday we have Kansas (40), Guam (9), Northern Marianas (9), Virgin Islands (9). Then Tuesday we have Alabama (50), Mississippi (40), Hawaii (20), American Samoa (9). And then it goes on and on…
|
|


