This is the website of Abulsme Noibatno Itramne (also known as Sam Minter).
Posts here are rare these days. For current stuff, follow me on Mastodon
|
There has been a lot of recent press about new national polls of the Clinton vs Trump race. Nobody should look at individual polls of course, but there have been enough polls now to move the averages. RCP has Trump +0.2%. Pollster has Clinton +1.6%. Pollster includes more polls and has a more sophisticated methodology, but the core result is the same… a close Clinton vs Trump race, and much closer than what looked to be the case a few weeks ago.
So what do we see looking at the electoral college view? Well, first of all, keep in mind that individual states tend to be polled less often than we get national polls, and some states are polled more often than others. So a state by state view like the one here, at least at this stage in the cycle, will react more slowly to rapid changes than the national numbers. If there is a big national change, you simply have to wait long enough to there to be enough new polls in enough states to move the state averages and then the national summary.
Since the last time I posted about a national model change on May 11th, there have been new general election polls in Oregon, Louisiana, Georgia (x2), Utah, New Hampshire, Arizona, New Jersey, Tennessee, Indiana, Florida (x3), Virginia, California, and Ohio. Of all of these, only the Florida polls have made a difference in my national summary.
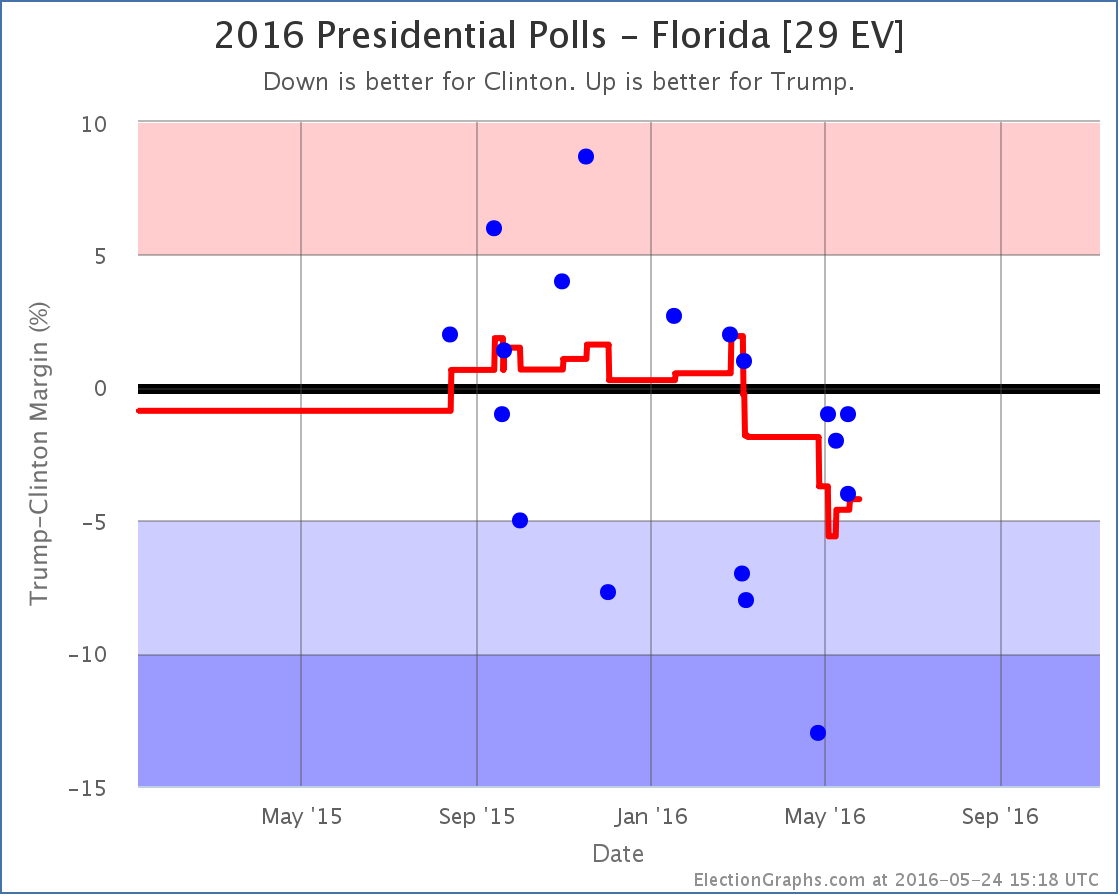
The three new polls, one of which was from early May but was only released a few days ago, all show Clinton ahead, but by less than 5%. This pulls Clinton’s lead back under 5%, specifically to a 4.2% lead.* The oldest poll in the average at the moment, showing a 13% Clinton lead, is now looking very much like an outlier, so it would not be surprising to see this look even closer when the next new poll is released.
This essentially reverses the changes from the May 11th update, and puts Florida back in play as a possible pick up for Trump.
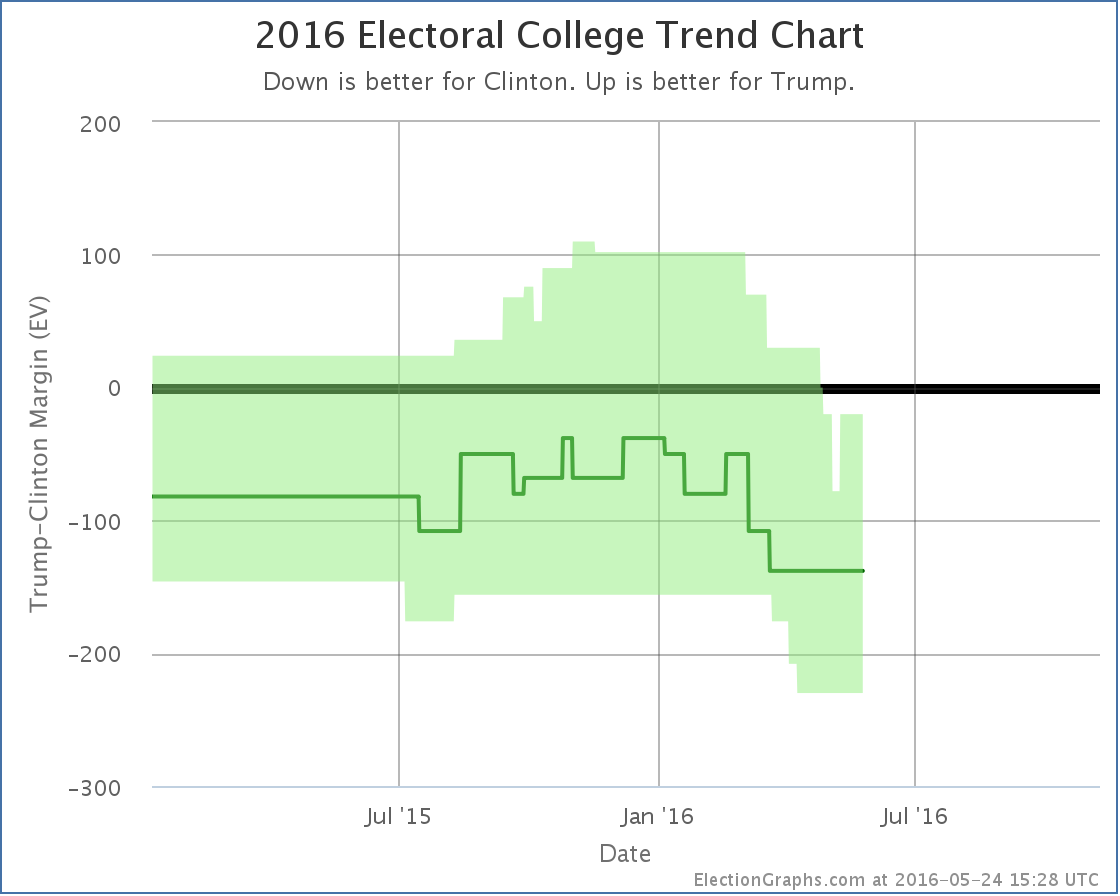
With Florida a possibility again, if Trump wins all the states he leads, plus all the states where Clinton is ahead by less than 5%, we end up at Clinton 279, Trump 259 – A 20 electoral vote win for Clinton.
Since Florida was the tipping point state, this also moves the tipping point:
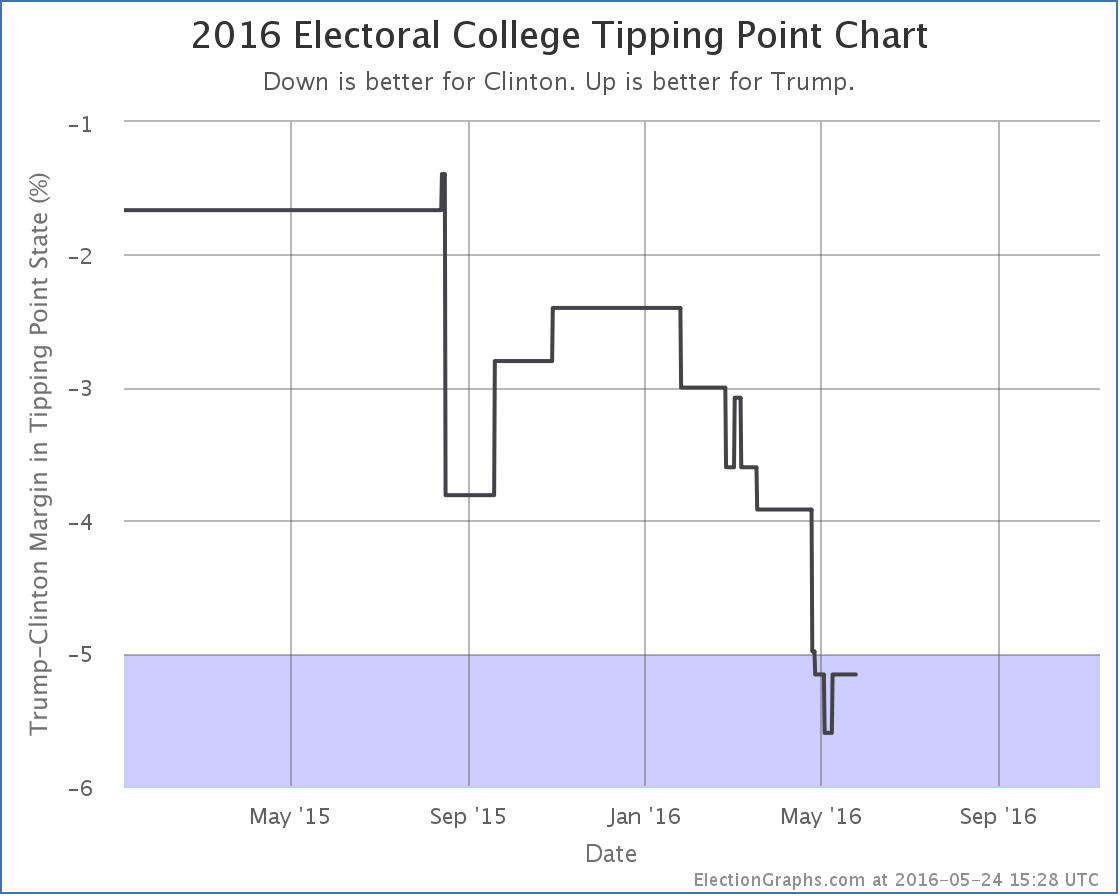
The new tipping point is North Carolina, where Clinton leads by 5.2%.
Trump’s “best case” is still to lose at the moment. But it is closer than it looked before.
So, the natural question here, especially given the national polls, is if this represents the end of the decline Trump has been suffering since January, and the start of a process where the state by state race starts looking as close as the national race polling averages would indicate.
The only real answer to that is that it is too soon to tell and we need to wait for more state polls to see if we see other states moving. But it would not be surprising if we see exactly that in the next few weeks.
With the results of both primary races essentially settled, but with Trump rapidly consolidating his party while Clinton is still dealing with Sanders, a tightening makes a lot of sense.
As Trump turns his attention to the general election, he will also presumably presumably do the traditional “pivot” to start courting voters that may have been turned off by his performance in the primaries. There have already been a number of moves in this direction.
We may have just seen Trump’s low point and the beginning of his rebound. Or this may be a blip. We shall see soon enough. The pace of new state level general election polls is quickening.
168.2 days until polls start to close on election night. A lot will happen in that time. Stay tuned.
* For anybody watching really carefully, because of the order in which I found these polls, two were added on Sunday and with those the chart showed a move from Strong Clinton to Weak Clinton on the 8th based on the poll that was taken in early May but released just last week, with a return to Strong Clinton on the 18th with a more recent poll. Since there was no net change from the addition of these two polls, even though they created a move back and forward on the charts, I did not do a post on Sunday. With a new poll added today that has the same middate in the field as the later of the two polls I added Sunday, the return movement that had been on the 18th was erased and there was now an overall change prompting this post. It looks odd that the movement on the chart is from the 8th, but I am not posting about it until the 24th, but the above is why.
Note: This post is an update based on the data on ElectionGraphs.com. Election Graphs tracks both a poll based estimate of the Electoral College and a numbers based look at the Delegate Races. All of the charts and graphs seen in this post are from that site. Additional graphs, charts and raw data can be found there. All charts above are clickable to go to the current version of the detail page the chart is from, which may contain more up to date information than the snapshots on this page, which were current as of the time of this post. Follow @ElectionGraphs on Twitter or like Election Graphs on Facebook to see announcements of updates or to join the conversation. For those interested in individual general election poll updates, follow @ElecCollPolls on Twitter for all the polls as they are added.
With the final results all but inevitable, these updates will be somewhat mechanical absent something unexpected happening.
After Nebraska and West Virginia, Trump needed 22.57% of the remaining delegates to win.
In Oregon, Trump got 19 delegates, while Kasich picked up 5 and Cruz picked up 4, even though neither of them are actively running any more.
In other changes since Nebraska and West Virginia due to uncommitted delegate preference changes in Guam, finalization of the West Virginia results taking into account geographic restrictions, and an update from New York, there was a net change of Trump +6, Kasich +2, Cruz -1
So total change since Nebraska and West Virginia: Trump +25, Kasich +7, Cruz +3
So Trump actually got 71.43% of the delegates since Nebraska and West Virginia.
So while he didn’t completely sweep the delegates this week, he is still far ahead of the target pace he needs to get to 1237.
Updated graphs:
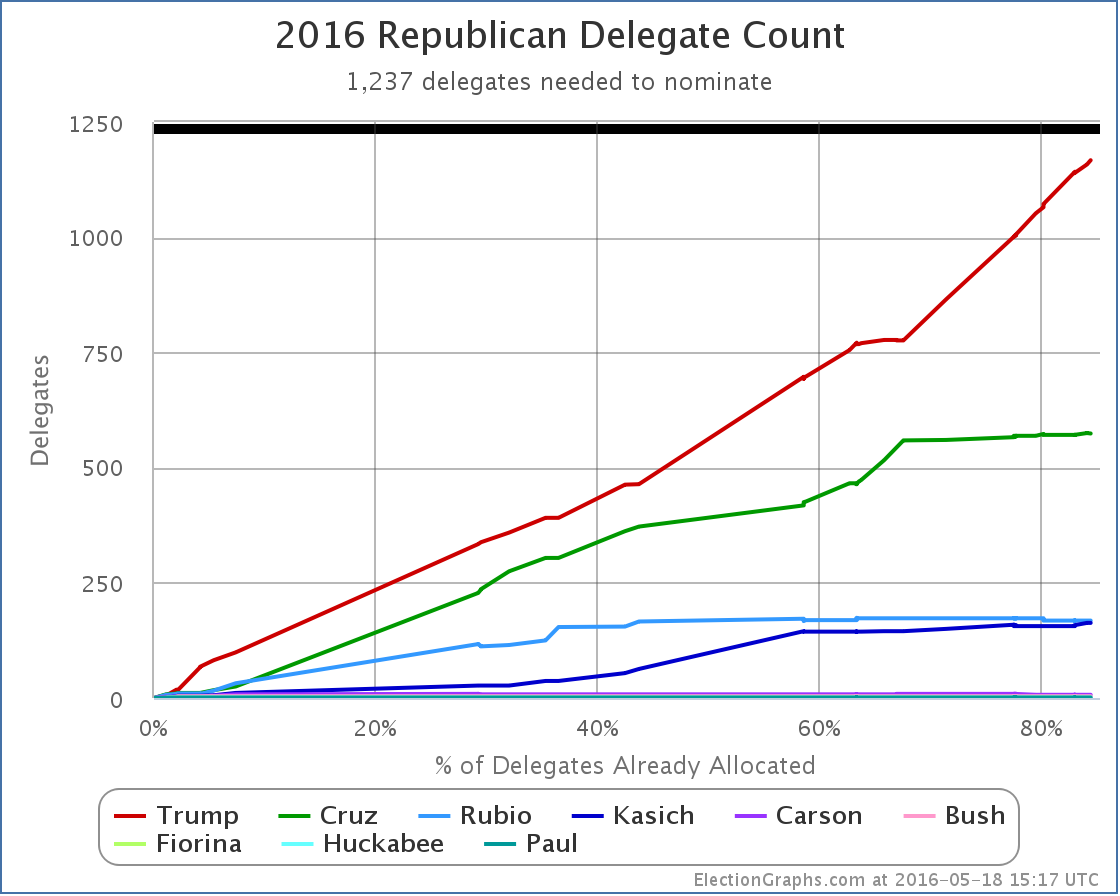
New delegate totals: Trump 1167, Cruz 574, Rubio 168, Kasich 163, Carson 7, Bush 4, Fiorina 1, Huckabee 1, Paul 1.
There are 386 delegates left. Trump needs 70 of them.
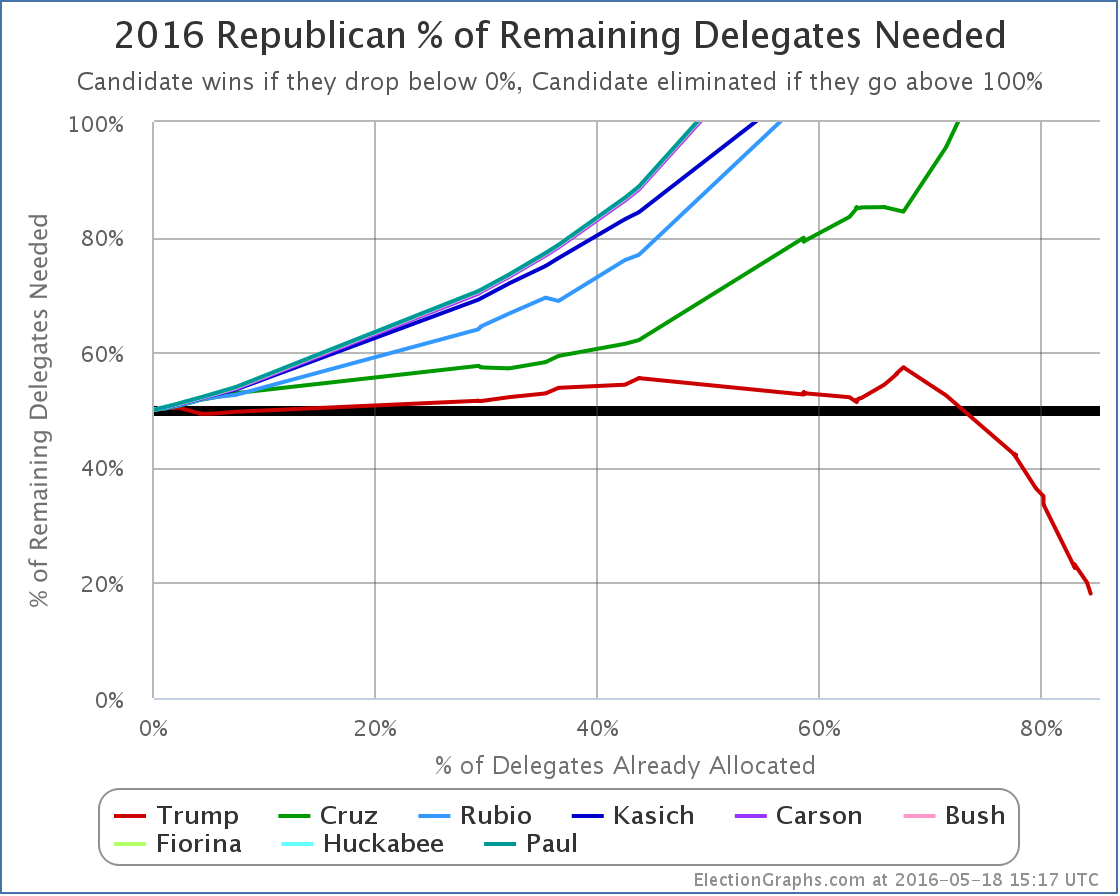
Trump now needs 18.13% of the remaining delegates to win.
Update 2016-05-22 16:12 UTC – Oregon update: Cruz +1, Kasich -1.
Update 2016-05-25 14:30 UTC – Virgin Islands update: Trump +7, Cruz -1, Rubio -2.
Note: This post is an update based on the data on ElectionGraphs.com. Election Graphs tracks both a poll based estimate of the Electoral College and a numbers based look at the Delegate Races. All of the charts and graphs seen in this post are from that site. Additional graphs, charts and raw data can be found there. All charts above are clickable to go to the current version of the detail page the chart is from, which may contain more up to date information than the snapshots on this page, which were current as of the time of this post. Follow @ElectionGraphs on Twitter or like Election Graphs on Facebook to see announcements of updates or to join the conversation. For those interested in individual general election poll updates, follow @ElecCollPolls on Twitter for all the polls as they are added.
This week on the Curmudgeon’s Corner podcast Sam and Ivan talk about television, thermostats, manipulating public opinion and a few other things besides Election 2016, but of course most of the show ends up being about the election. They cover the last gasp Sanders path to the nomination, Trump zig-zagging on the issues, the Republican civil war, and possible Trump VPs. Oh, and Sam’s son Alex keeps interrupting to promote his YouTube channel.
Click below to listen or subscribe… then let us know your own thoughts!

Recorded 2016-05-12
Length this week – 1:35:45
 1-Click Subscribe in iTunes 1-Click Subscribe in iTunes
 View Podcast in iTunes View Podcast in iTunes
 View Raw Podcast Feed View Raw Podcast Feed
 Download MP3 File Download MP3 File
 Follow the podcast on Facebook Follow the podcast on Facebook
Show Details:
- (0:01:24-0:21:00) But First
- Failed Alex Plan
- Agenda
- Feedback
- TV Habits
- More Election Graphs Comments
- (0:22:21-0:52:01) Hodgepodge
- Thermostats
- Bernie’s Path
- Facebook Trending Topics
- Manipulating the Press
- (0:52:41-1:04:08) Trump Zigzags
- Trump on the National Debt
- Trump on Taxes
- Trump on Self-funding
- Trump on Muslim ban
- Trump on Hispanics
- Trump on Tax Returns
- Trump on Minimum Wage
- So… Trump Pivot?
- (1:05:12-1:35:25) Republican Civil War
- Support the Nominee
- Trump vs Ryan
- Trump and turnout
- Third Party Options
- Ultimate Mole?
- Clinton landslide?
- Most Unfavorable Ever
- Trump/Gingrich?
- Alex Interruption
- More on Newt
- Other VP candidates
- Alex’s Youtube channel
With the final results all but inevitable, these updates will be somewhat mechanical absent something unexpected happening.
After Indiana, Trump needed 36.02% of the remaining delegates to win.
In Nebraska and West Virginia, Trump seems to have gotten all 70 of the available delegates. (There may end up being some oddness due to West Virginia geographic restrictions on delegate allocation that shifts this slightly.)
In other changes since Indiana due to uncommitted delegate preference changes in American Samoa and Louisiana as well as Louisiana’s Rubio delegates moving to Trump, there were net changes of: Trump +14, Cruz -3, Rubio -5.
So total change since Indiana: Trump +84, Cruz -3, Rubio -5
So Trump actually got 111% of the delegates since Indiana. (Over 100% is possible since he actually took delegates from his opponents as well as collecting “new” delegates.)
So Trump obviously well exceeded the required numbers to be on pace for a win.
Updated graphs:
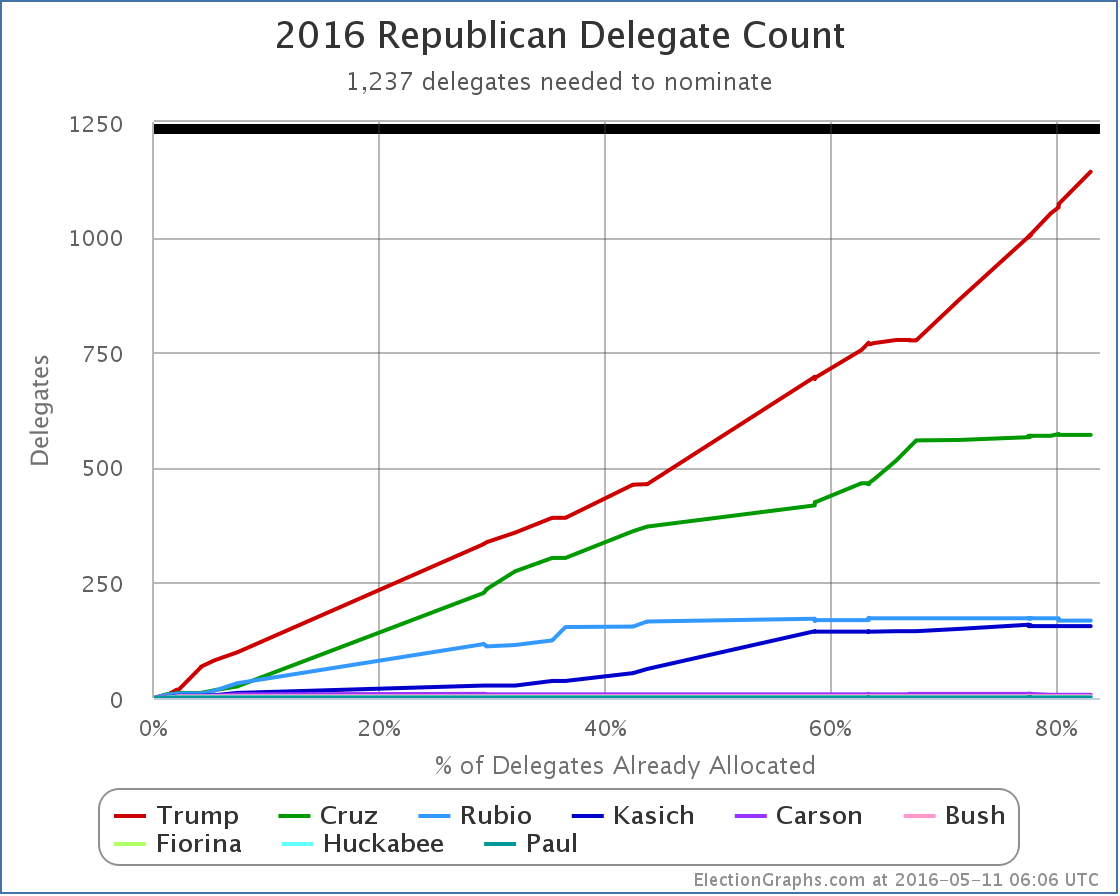
New delegate totals: Trump 1142, Cruz 571, Rubio 168, Kasich 156, Carson 7, Bush 4, Fiorina 1, Huckabee 1, Paul 1.
There are 421 delegates left. Trump needs 95 of them.
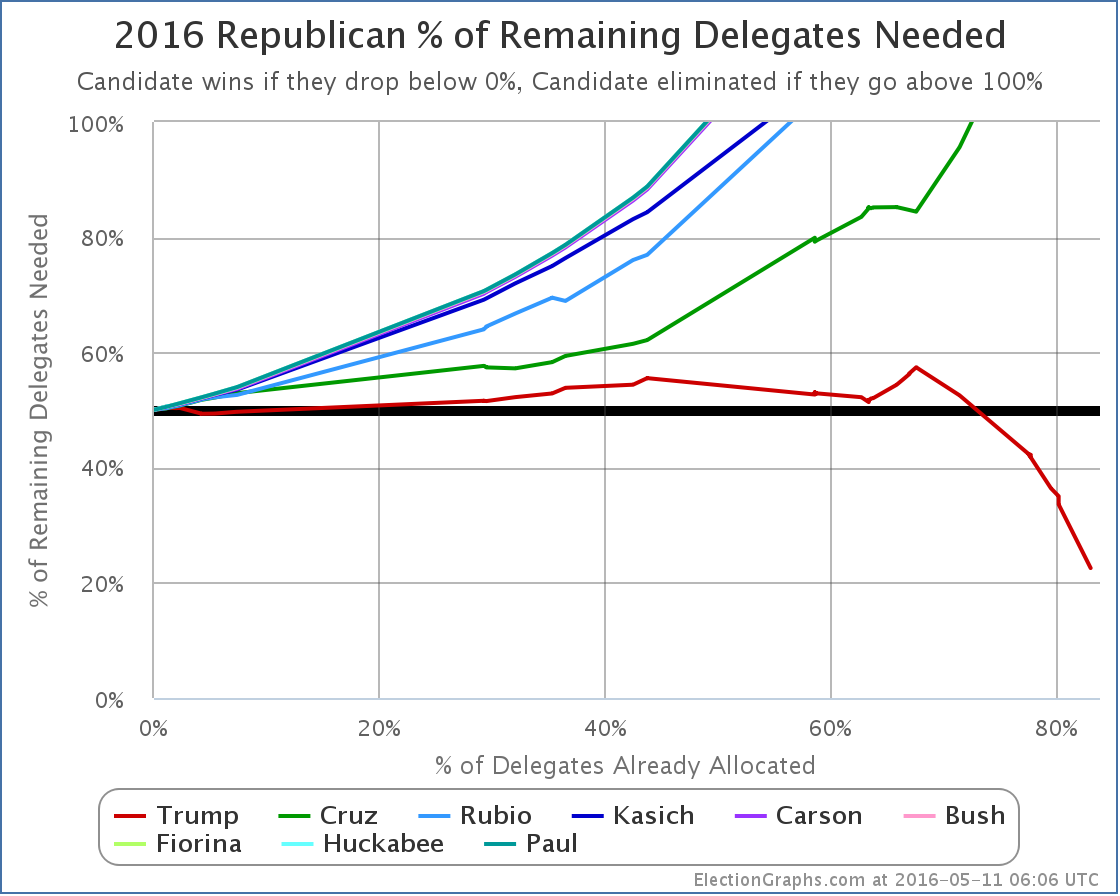
Trump now needs 22.57% of the remaining delegates to win.
Update 2016-05-14 14:31 UTC: Once the geographic restrictions on delegates was finalized and factored in, the final results in West Virginia were officially Trump 30, Kasich 1, Uncommitted 3. Two of the three uncommitted delegates have stated they are for Trump though, so we count this as Trump 32, Kasich 1, TBD 1. Net change from before: Trump -2, Kasich +1.
Update 2016-05-17 17:03 UTC: Update from New York. Net change: Trump -1, Kasich +1.
Update 2016-05-18 17:26 UTC: Update from Guam uncommitted delegates. Net Change Trump +9, Cruz -1.
Note: This post is an update based on the data on ElectionGraphs.com. Election Graphs tracks both a poll based estimate of the Electoral College and a numbers based look at the Delegate Races. All of the charts and graphs seen in this post are from that site. Additional graphs, charts and raw data can be found there. All charts above are clickable to go to the current version of the detail page the chart is from, which may contain more up to date information than the snapshots on this page, which were current as of the time of this post. Follow @ElectionGraphs on Twitter or like Election Graphs on Facebook to see announcements of updates or to join the conversation. For those interested in individual general election poll updates, follow @ElecCollPolls on Twitter for all the polls as they are added.
Since the last electoral college update there have been polls in West Virginia, New York, Georgia, Massachusetts, Florida, Ohio, Pennsylvania, and New Hampshire. Of all of these, only the one in Florida made a notable change to the overall picture of the election.
This was one of three Quinnipiac Swing State polls that were released on May 10th covering Florida, Ohio and Pennsylvania.
These polls got lots of press for showing a close Clinton vs Trump race in the three key states. But in both Ohio and Pennsylvania when you include the new polls in the average of the other recent polls, there was no change to the status of the states in the Election Graphs model. Ohio was and remains a “Weak Clinton” state… Clinton now leads by 3.4%. Pennsylvania was and remains a “Strong Clinton” state… Clinton now leads by 6.4%.
In Florida there was a category change, but despite the hype, the change doesn’t make the state look closer, instead it shows Clinton increasing her lead. Let’s look at this more closely.
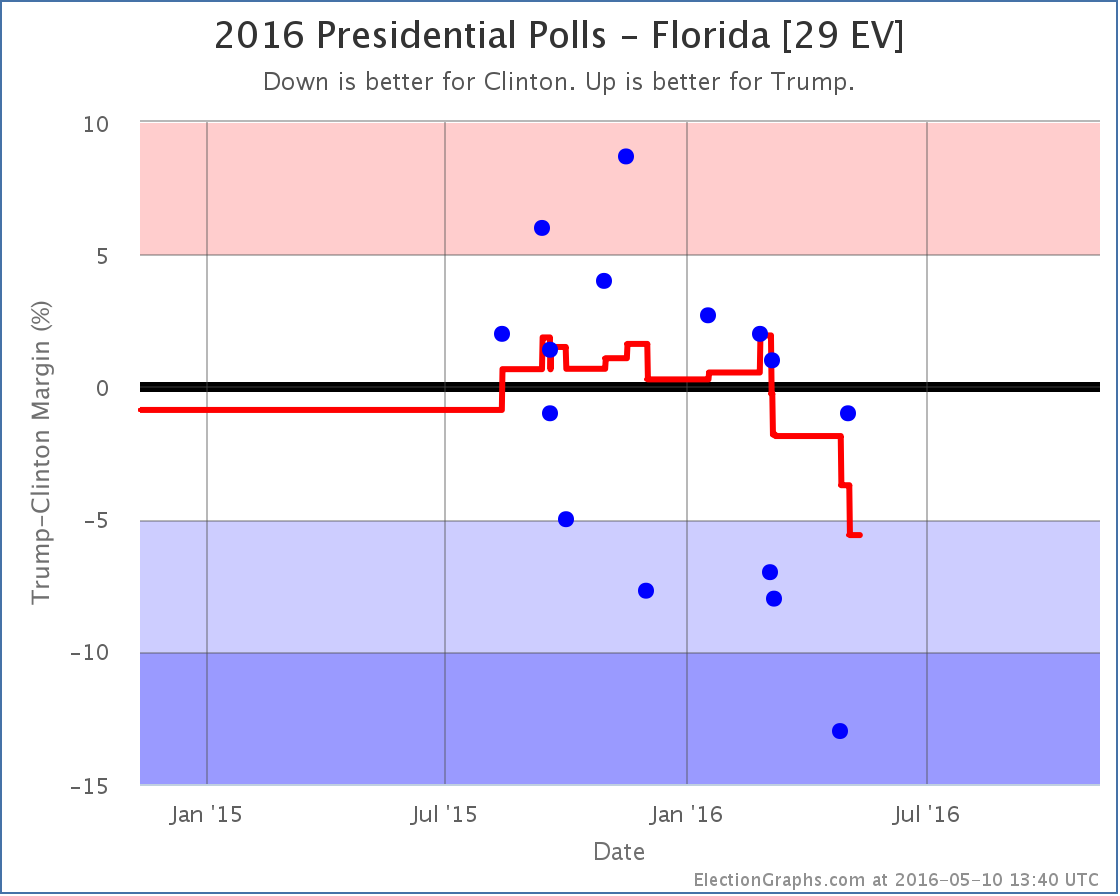
The new poll shows Clinton leading by only 1%, which is better for Trump than the previous average, which showed Clinton leading by 3.7%. So why did the average move toward Clinton instead of toward Trump? Well, to understand this, you need to look not at where the average was before, but instead at the polls being replaced in the average.
In this case the new Clinton by 1% poll replaced two polls*, one where Trump led by 2.7% in January, and the other where Trump led by 2.0% in February. So the average moves toward Clinton because even though the new poll was better than the recent average and the next most recent poll (which had Clinton +13%), it was worse than the older polls falling out of the average.
Looking at the dots for the individual polls, as well as the trend line, you can see that while the new poll does indeed show a close race, it now means that only one out of the last five polls in Florida show a Trump lead, while up until March you saw Trump leading many of the polls in Florida. He led in the average. The fact that people are now pushing “Trump is only 1% behind Clinton in Florida” as a good poll for Trump is actually an indication of the fact that he has fallen so much that this result is now unusually good for Trump. Back in early March it would have been completely unremarkable.
Looking at the average again, the line has been moving toward Clinton since March. With the Quinnipiac poll replacing the older polls where Trump was leading, Clinton’s lead in the state is up to 5.6%, which moves the state to “Strong Clinton” and takes Florida out of the list of states we give him in the “best case”.
So nationwide, the new situation looks like this:
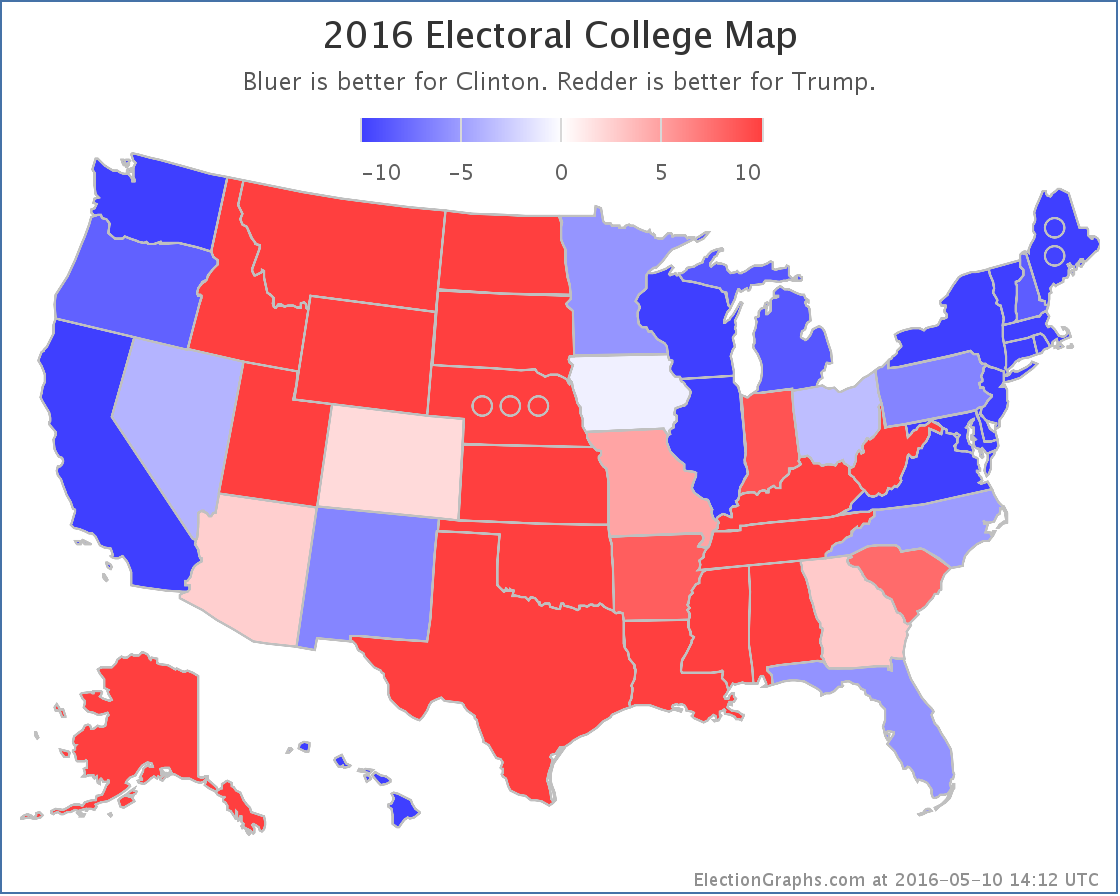
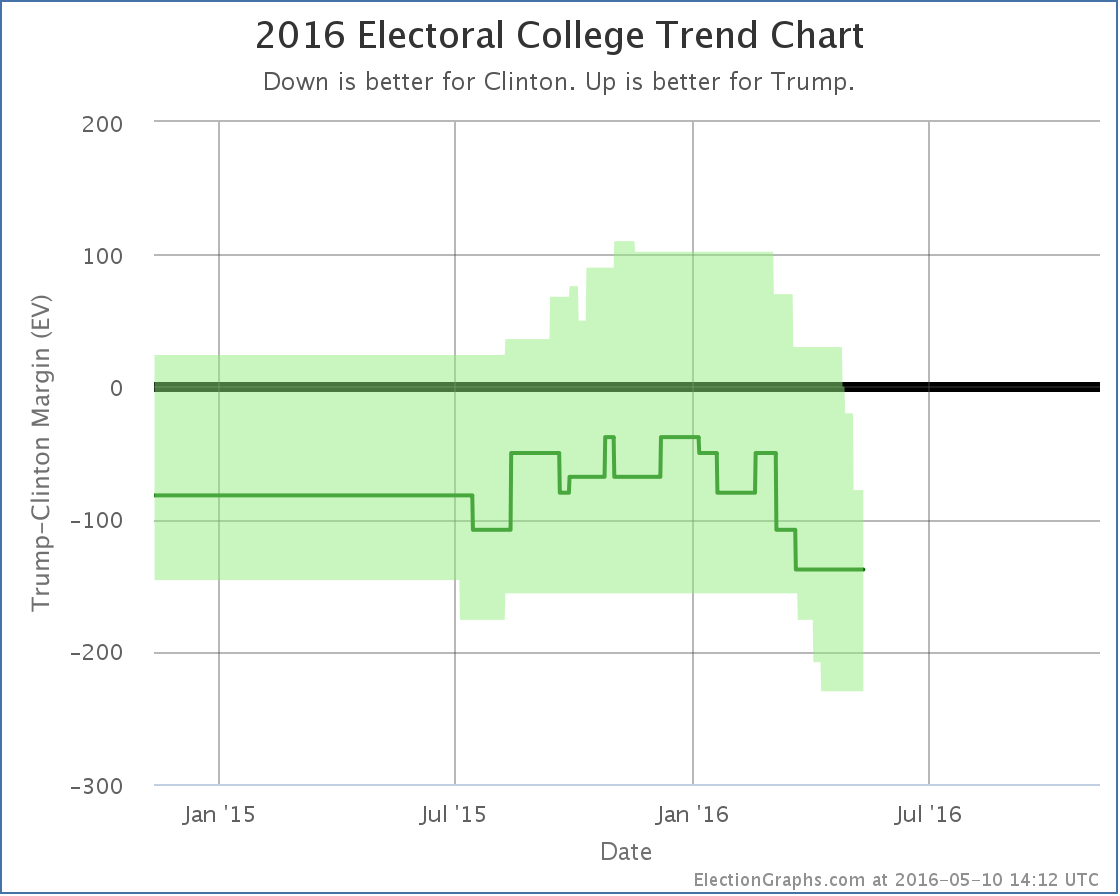
Without Florida, if Trump wins all the states he is ahead in, plus all the states Clinton is ahead by less than 5%, Trump loses by 78 electoral votes. This is a new low for Trump’s best case. The Trump deterioration that started in January continues.
Having said that, while this looks like an easy Clinton win, when people start talking about a Democratic win of historic proportions, the evidence doesn’t yet support that. Looking now at the expected case rather than Trump’s best case… so each candidate just wins all the states where they lead in the poll average… you get Clinton 338, Trump 200… a 138 electoral vote win.
By comparison, Romney lost by 126 electoral votes and McCain lost by 192 electoral votes. So right now Trump is doing worse than Romney, but still better than McCain. This is a solid loss of course, but we are nowhere near the comparisons some people are making to a possible Mondale style loss. (Mondale lost by 512 electoral votes to Reagan).
Even Trump’s worst case right now (losing by 230 electoral votes) is only in the neighborhood of Dole’s loss to Bill Clinton (217 electoral votes) and not even in Dukakis territory (losing by 315 electoral votes to GHW Bush). And of course Trump’s best case, while still a loss, would be better than either Romney or McCain did. We are a long way from Mondale.
With the Florida change, the tipping point also moved, which gives a different view:
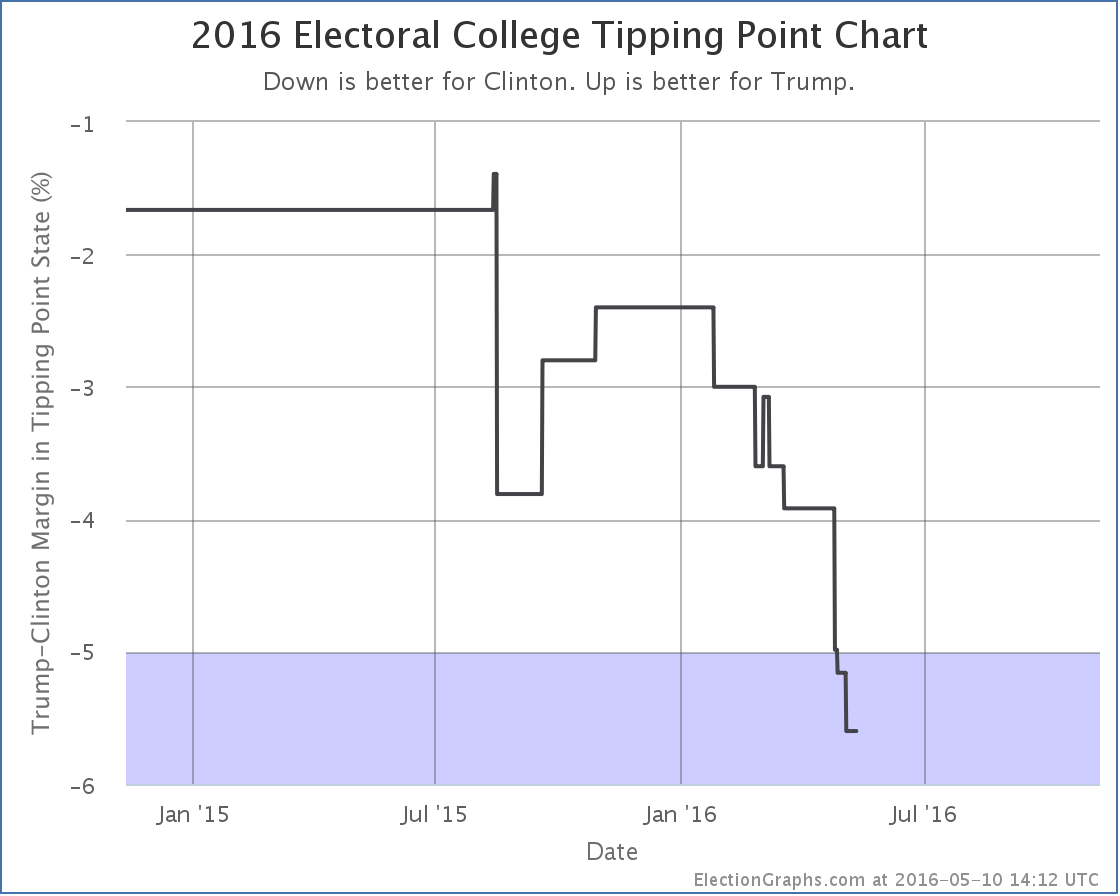
The tipping point is the margin in the state that would put the winner over the top. Right now it is Clinton’s 5.6% lead in Florida. What this means though is that you only need 2.8% of people to change their minds nationwide, and enough states flip that Trump would be winning. Given how divided the electorate is, that might actually be pretty difficult, but it doesn’t sound anywhere near as dire as the electoral college view. Changing the minds of 3% of Americans seems quite possible.
We have 181.8 days left until polls start to close on election day. Trump may be down right now, but there is still lots of time left. That may change. Do not be surprised if things tighten before election day… or if Clinton widens her lead further. There is still plenty of room for movement.
* The previous Clinton by 3.7% average was one of the cases where the Election Graphs poll average is based on six polls instead of the normal five. This happened because the five poll average resulted in a Clinton lead of exactly 5%. The primary purpose of the poll average on Election Graphs is not the average itself, but rather to categorize each state into one of the six categories… weak, strong, or solid for each candidate. 5% is the boundary between weak and strong, so additional older polls are pulled in as needed to get the average off the fence and put the average solidly in one category. In this case the one additional poll pulled the average back toward Trump and resulted in the 3.7% Clinton lead.
Note: This post is an update based on the data on ElectionGraphs.com. Election Graphs tracks both a poll based estimate of the Electoral College and a numbers based look at the Delegate Races. All of the charts and graphs seen in this post are from that site. Additional graphs, charts and raw data can be found there. All charts above are clickable to go to the current version of the detail page the chart is from, which may contain more up to date information than the snapshots on this page, which were current as of the time of this post. Follow @ElectionGraphs on Twitter or like Election Graphs on Facebook to see announcements of updates or to join the conversation. For those interested in individual general election poll updates, follow @ElecCollPolls on Twitter for all the polls as they are added.
On this week’s Curmudgeon’s Corner Ivan and Sam spend most of the show on Election 2016 again. On the Democratic side they talk about how after a short moment when it looked like he was embracing the inevitable, Sanders is once again fighting on against the odds. On the Republican side they discuss Trump’s victory, how we got to this point, how the Republican establishment will react, and what it all means for the general election. In addition to all that, there is also talk of the White House Correspondent’s Dinner, a county Democratic convention, Ivan’s travel… oh, and Sam’s 6 year old son Alex has some questions for the listeners.
Click below to listen or subscribe… then let us know your own thoughts!

Recorded 2016-05-04
Length this week – 1:42:04
 1-Click Subscribe in iTunes 1-Click Subscribe in iTunes
 View Podcast in iTunes View Podcast in iTunes
 View Raw Podcast Feed View Raw Podcast Feed
 Download MP3 File Download MP3 File
 Follow the podcast on Facebook Follow the podcast on Facebook
Show Details:
- (0:00:10-0:12:20) But First
- Ivan’s Flights
- Alex’s Questions
- Agenda
- Delegate Confusion
- (0:13:00-0:27:15) Election 2016: Democrats
- Indiana Results
- Sanders still fighting!
- Annoying the superdelegates
- Ways Clinton is Winning
- Contested Convention?
- Over Over Over
- (0:28:35-1:03:29) Election 2016: Republicans
- Indiana Results
- Trump Ascendant
- Cruz Drops Out
- No Rules Changes
- Last Trump/Cruz attacks
- Trump is the Nominee
- How did it happen?
- How will elected Republicans respond?
- Predicting November
- Trump Win Scenarios
- How big a Clinton win?
- (1:04:32-1:18:55) White House Correspondents Dinner
- Obama’s Routine
- Boehner and House Divisions
- Differences in Trump/Clinton surrogates
- Potential Trump VPs
- Wilmore’s Routine
- (1:20:10-1:41:44) Snohomish County Democratic Convention
- Reaction to Senator Murray and Rep Larson
- Platform Nonsense
- Reaction to Rep DelBene
- Resolutions
- Motion to Reject
- How not to convince a superdelegate
- iTunes Reviews
Trump won all 57 delegates in Indiana.
This was the last stand of the anti-Trumps. Cruz announced he was dropping out shortly after the state was called for Trump. Kasich is still in it, but hasn’t shown any delegate gathering ability that would indicate he could make a difference.
Even with a loss in Indiana, Trump would almost certainly have won in the end. That has been clear for a couple weeks now. But he didn’t lose Indiana, he shut everyone else out completely.
Trump hasn’t wrapped things up quite yet, he still has to collect a few more delegates. But something unexpected and dramatic would have to happen to stop him from getting there.
The Republican race is now in the same state as the Democratic race has been for awhile. The outcome is known, and we’re just watching the winner mop up the last few delegates they need.
So time to look at the graphs:
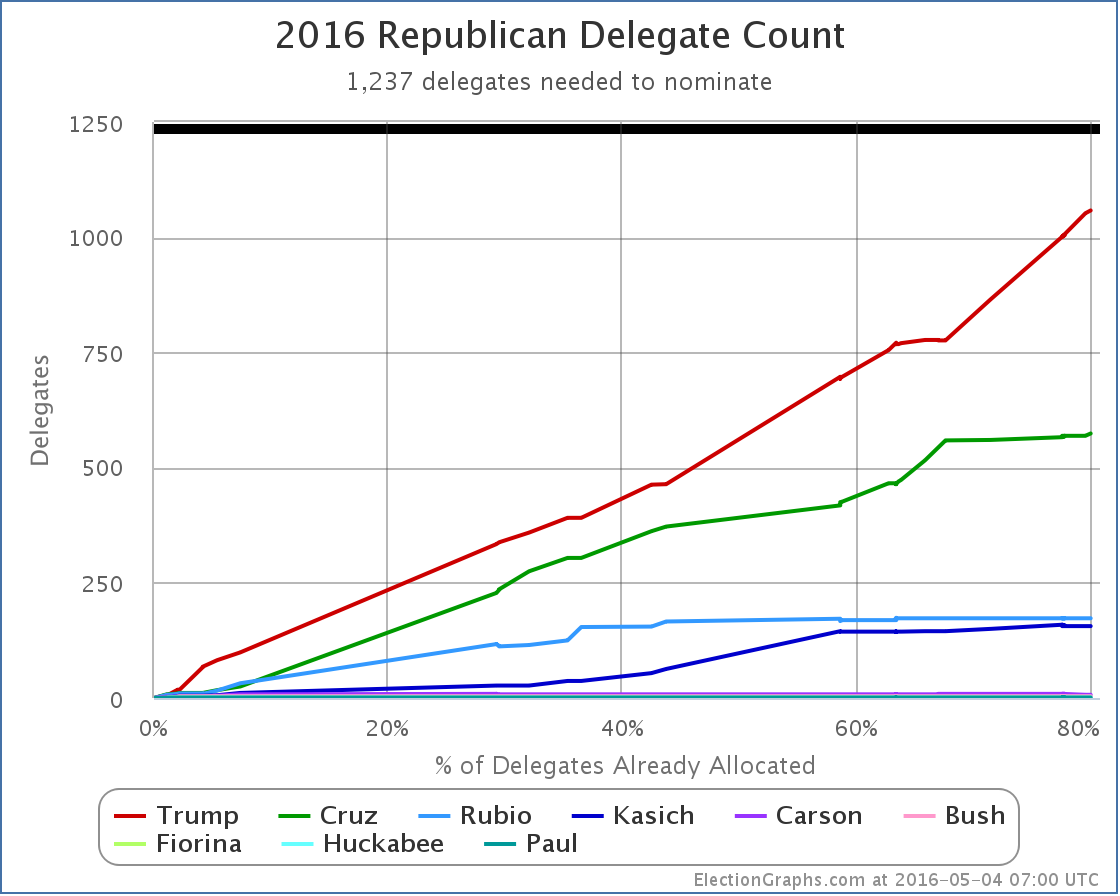
My best estimates of the delegate totals (including preferences of officially uncommitted delegates) is now:
Trump 1058, Cruz 574, Rubio 173, Kasich 156, Carson 7, Bush 4, Fiorina 1, Huckabee 1, Paul 1.
(In addition to the 57 delegates from Indiana for Trump, this includes adjustments since last week that total: Cruz +6, Kasich -2, Carson -2, Trump -3.)
This means Trump now needs 179 of the remaining 497 delegates to wrap this up.
Which brings us to the % needed chart:
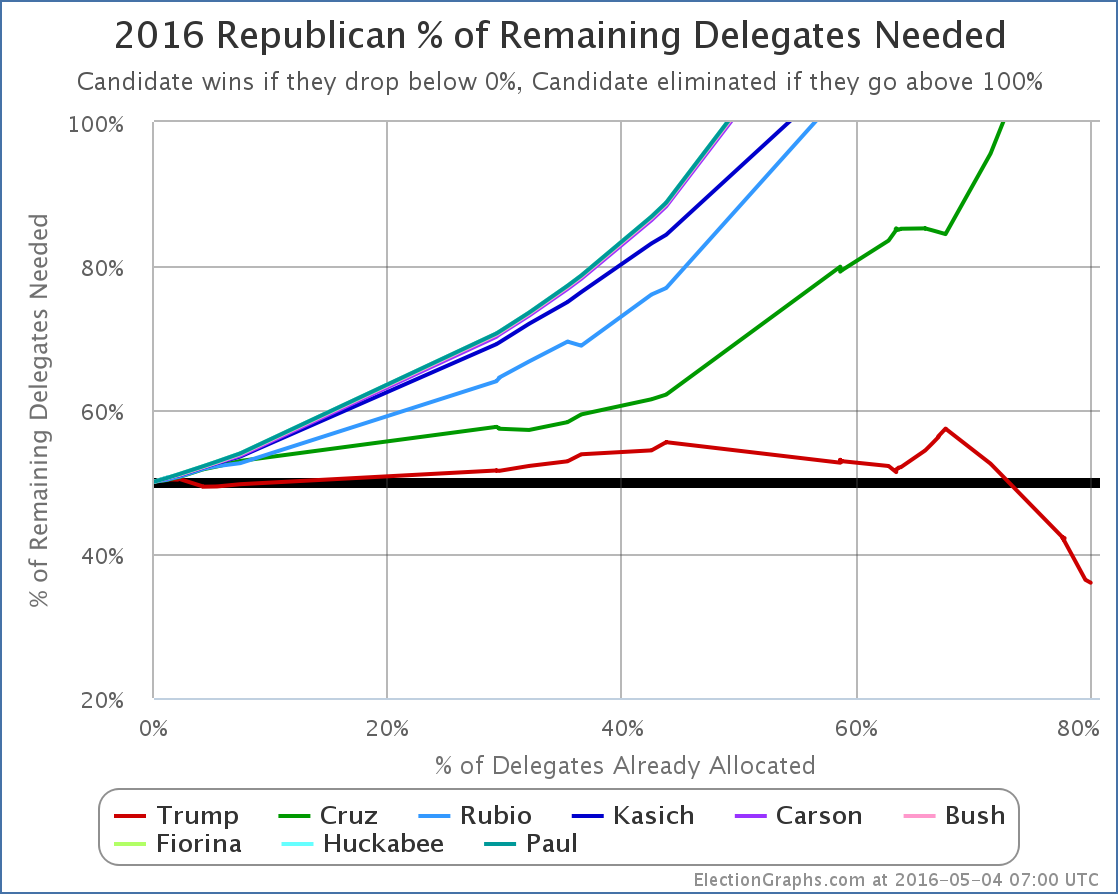
Trump now needs 36.02% of the remaining delegates to get to the magic number of 1237.
The remaining contests are essentially now just Trump vs Kasich. Unless you believe Kasich is suddenly going to start winning delegates in every remaining state by 64% to 36% margins despite getting less than 8% of the delegates so far, Trump will do what he needs to do. He will probably do much better than he needs to do.
So he will win, and he will win outright. No contested convention, just an outright win.
If there had been enough “Shadow anti-Trump” delegates… those that were pledged to Trump, but really supported someone else, then there may have been the ability to change the rules to unbind the delegates, opening up a back door for someone else to win even if Trump had the nominal majority. The fact that Cruz dropped out after Indiana indicates that those numbers just were not there…
And so we’re essentially done.
ElectionGraphs.com will continue to document this process, but now it is just a matter of watching Trump gather up the remaining delegates needed. There is no question any more how this will play out.
Unless a metaphorical meteor (or a literal one I guess) hits Clinton or Trump, we have our nominees. The general election is lined up. We are going to be watching Clinton vs Trump.
Update 2016-05-11 06:32 UTC – Adjustments from American Samoa’s uncommitted delegates, and Louisiana’s uncommitted delegates as well as Louisiana’s now free Rubio delegates. Net result: Trump +14, Cruz -3, Rubio -5.
Note: This post is an update based on the data on ElectionGraphs.com. Election Graphs tracks both a poll based estimate of the Electoral College and a numbers based look at the Delegate Races. All of the charts and graphs seen in this post are from that site. Additional graphs, charts and raw data can be found there. All charts above are clickable to go to the current version of the detail page the chart is from, which may contain more up to date information than the snapshots on this page, which were current as of the time of this post. Follow @ElectionGraphs on Twitter or like Election Graphs on Facebook to see announcements of updates or to join the conversation. For those interested in individual general election poll updates, follow @ElecCollPolls on Twitter for all the polls as they are added.
It has only been a few days since the last Electoral College update but there have already been polls added for Ohio, Indiana, California, Florida and Minnesota. A couple of these made differences to the ElectionGraphs.com models, so lets take a look…
Clinton vs Trump
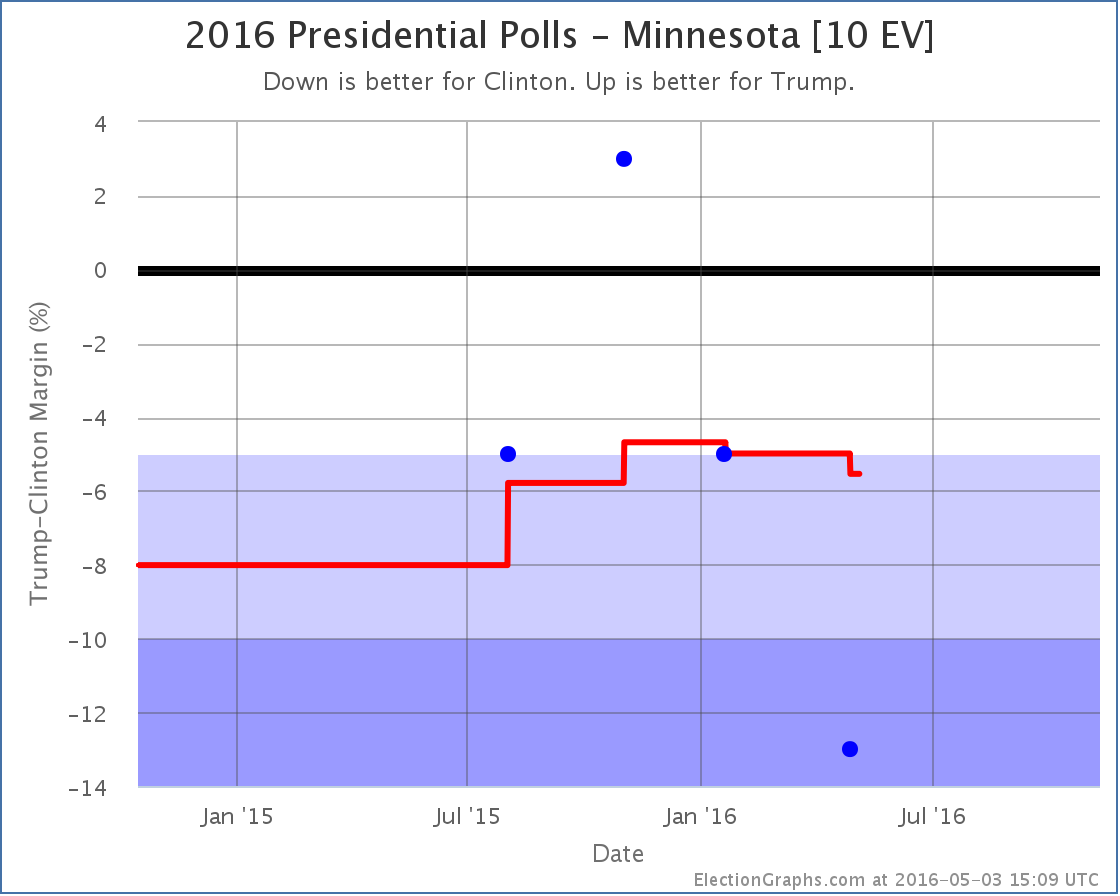
Minnesota has been lightly polled. The average still is padded with the 2012 election results. But with this addition, Clinton’s lead is now 5.5%, which puts the state out of the “Weak Clinton” category and into “Strong Clinton”. For the ElectionGraphs.com model that means for now we now assume that even in a very favorable case, Trump will not win Minnesota.
In the last update Trump’s best case was already an electoral college tie. So, with Minnesota out of the picture…
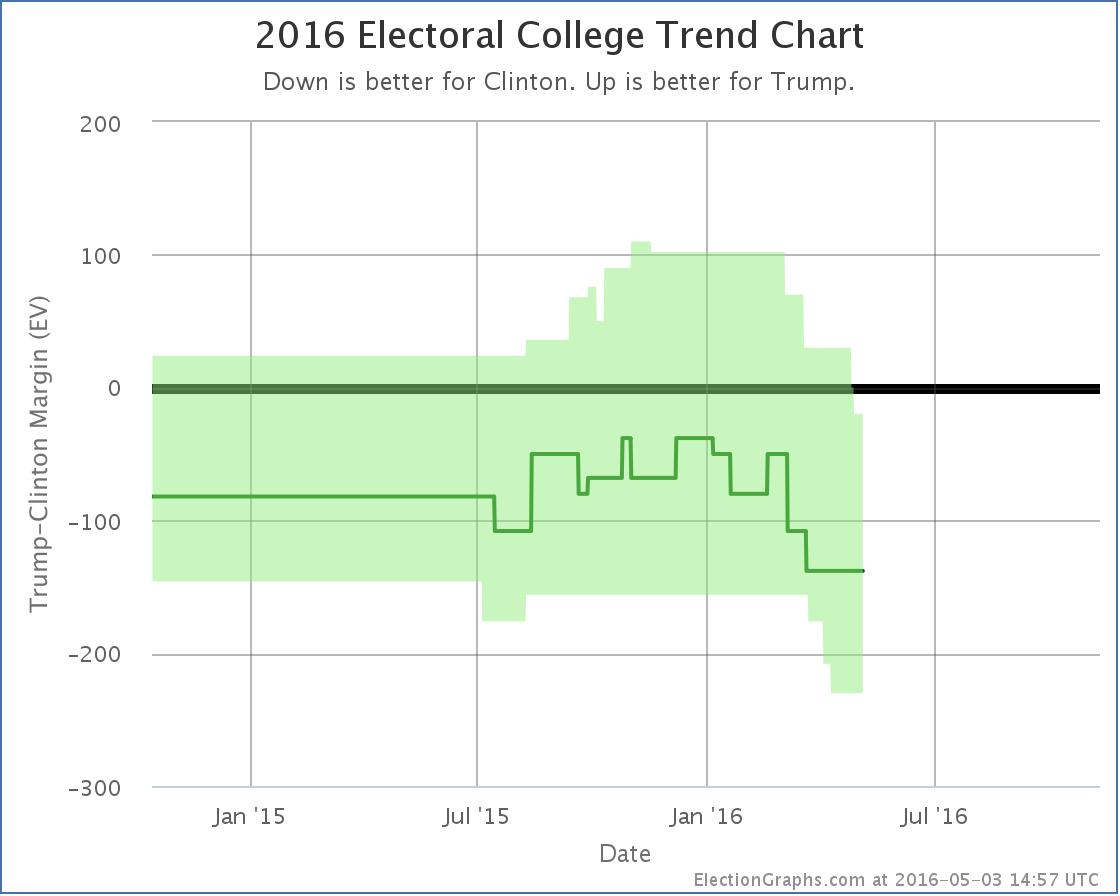

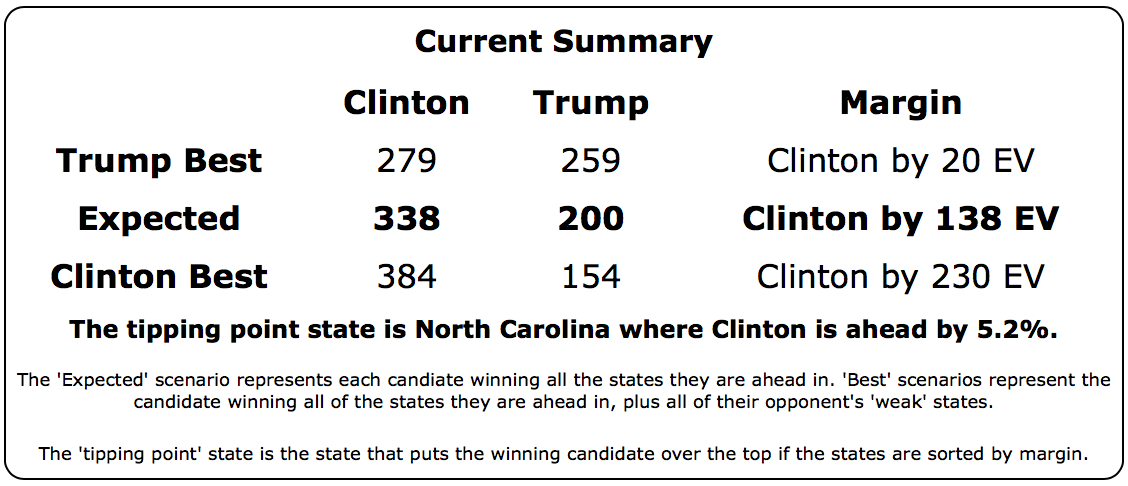
So yes. Trump’s best case… winning all the states where he leads in the polls, plus all the states where Clinton leads by less than 5%, is now to lose to Clinton by 20 electoral votes.
Now, it is important to mention that even though I call this Trump’s “best case”, it is the best case as of right now, with the polls we have today. It is May. We have months to go before the general election. A lot can change. So this doesn’t mean Trump can’t win. It just means that if today’s polling averages held, he couldn’t win.
The tipping point (the percentage you would have to move all the state polls to flip the winner) also moved toward Clinton:
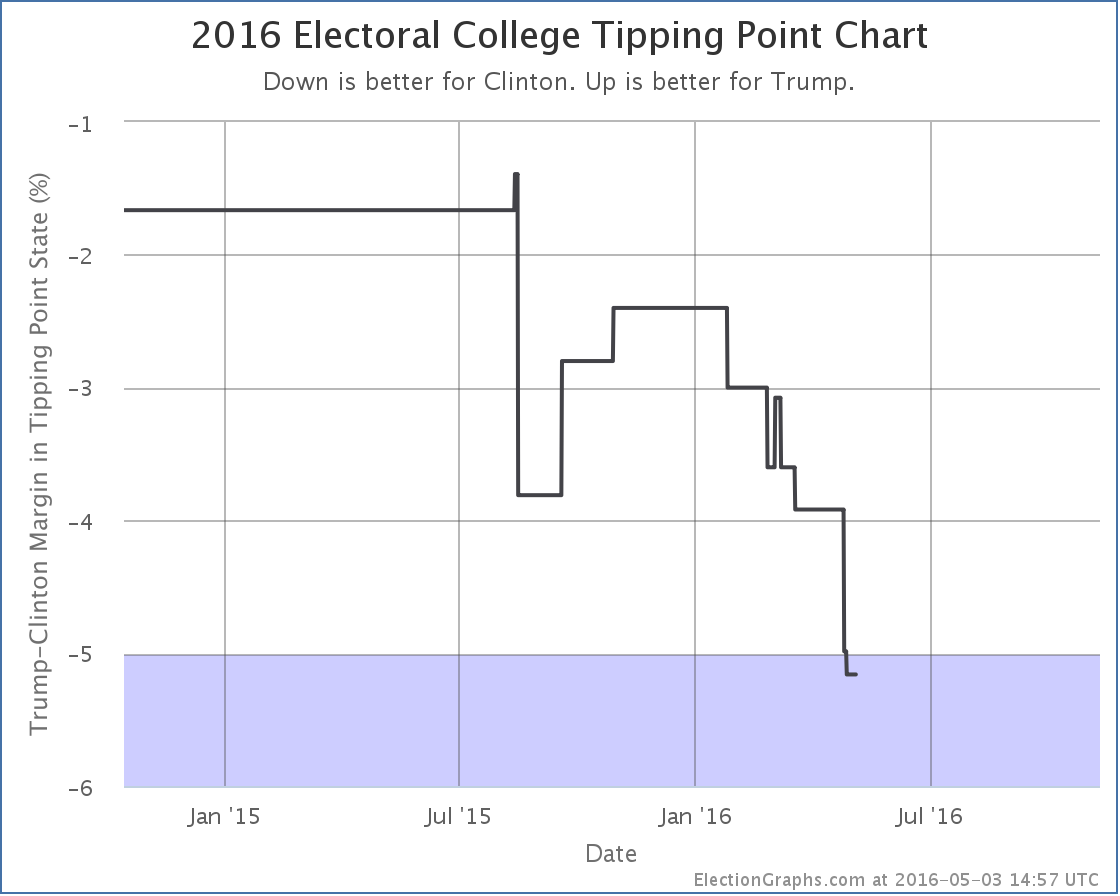
All this together means that Trump is now very far behind Clinton. She has the clear advantage. A big advantage. Trump has a lot of work to do if he wants to catch up and be in a winning position by November. It is not impossible, but it will require changing a lot of minds.
Clinton vs Cruz
Oh yeah, Cruz is still in it too Cruz was still in it when this last batch of polls was taken, and he did badly as well. The latest poll in Florida didn’t change the categorization of Florida, but since Florida was the tipping point state it moved the tipping point:
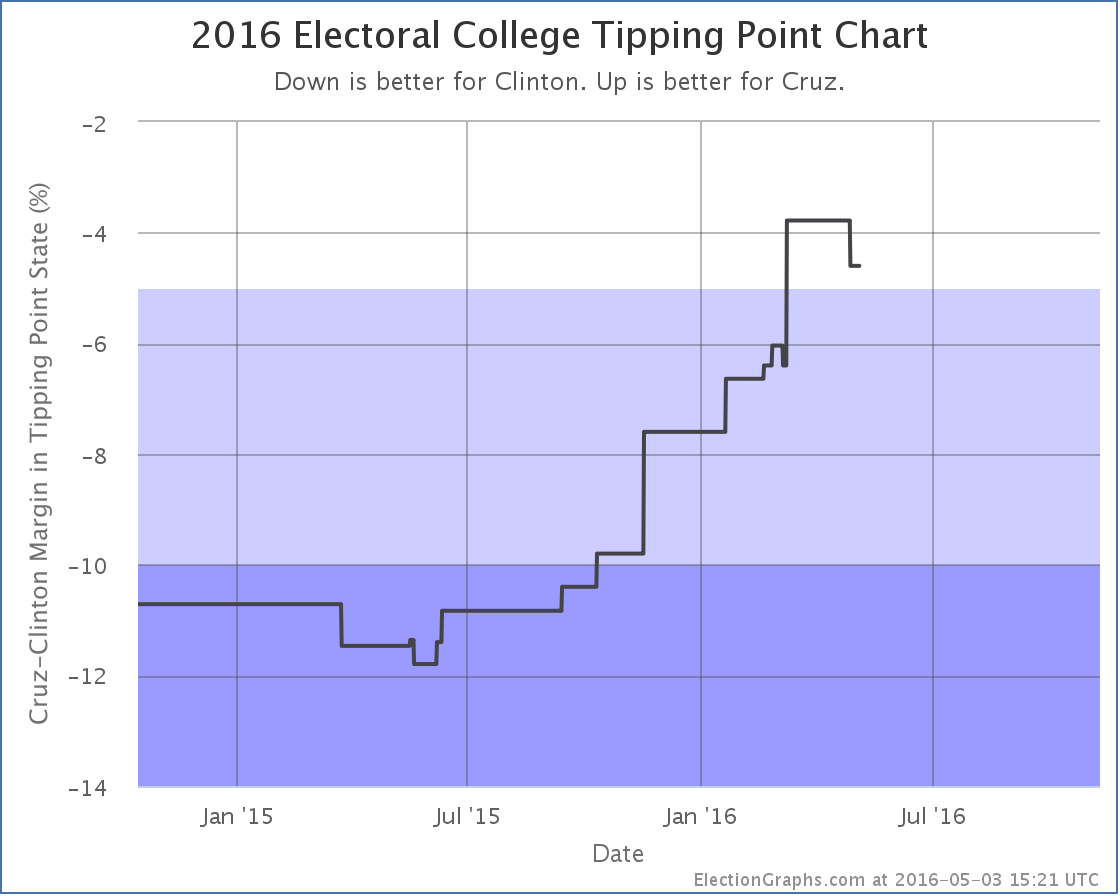
Given the state of the nomination races though any combination other than Clinton vs Trump appears to be completely academic now, absent some catastrophic unexpected event.
188.8 days until polls close on election day 2016.
Note: This post is an update based on the data on ElectionGraphs.com. Election Graphs tracks both a poll based estimate of the Electoral College and a numbers based look at the Delegate Races. All of the charts and graphs seen in this post are from that site. Additional graphs, charts and raw data can be found there. All charts above are clickable to go to the current version of the detail page the chart is from, which may contain more up to date information than the snapshots on this page, which were current as of the time of this post. Follow @ElectionGraphs on Twitter or like Election Graphs on Facebook to see announcements of updates or to join the conversation. For those interested in individual general election poll updates, follow @ElecCollPolls on Twitter for all the polls as they are added.
Since the last post here on the Electoral College back on April 19th there have been new polls in Maryland, Wisconsin, North Carolina (x3), Pennsylvania, New Hampshire, Indiana, and Arizona. Today the latest in Arizona and North Carolina make a difference to the ElectionGraphs.com estimates. There are two state category changes for Clinton vs Trump and one for Clinton vs Cruz. All three of these changes favor Clinton.
Clinton vs Trump
Maybe everything is going Trump’s way in the primary campaign right now, but things are heading in the opposite direction for the general election.
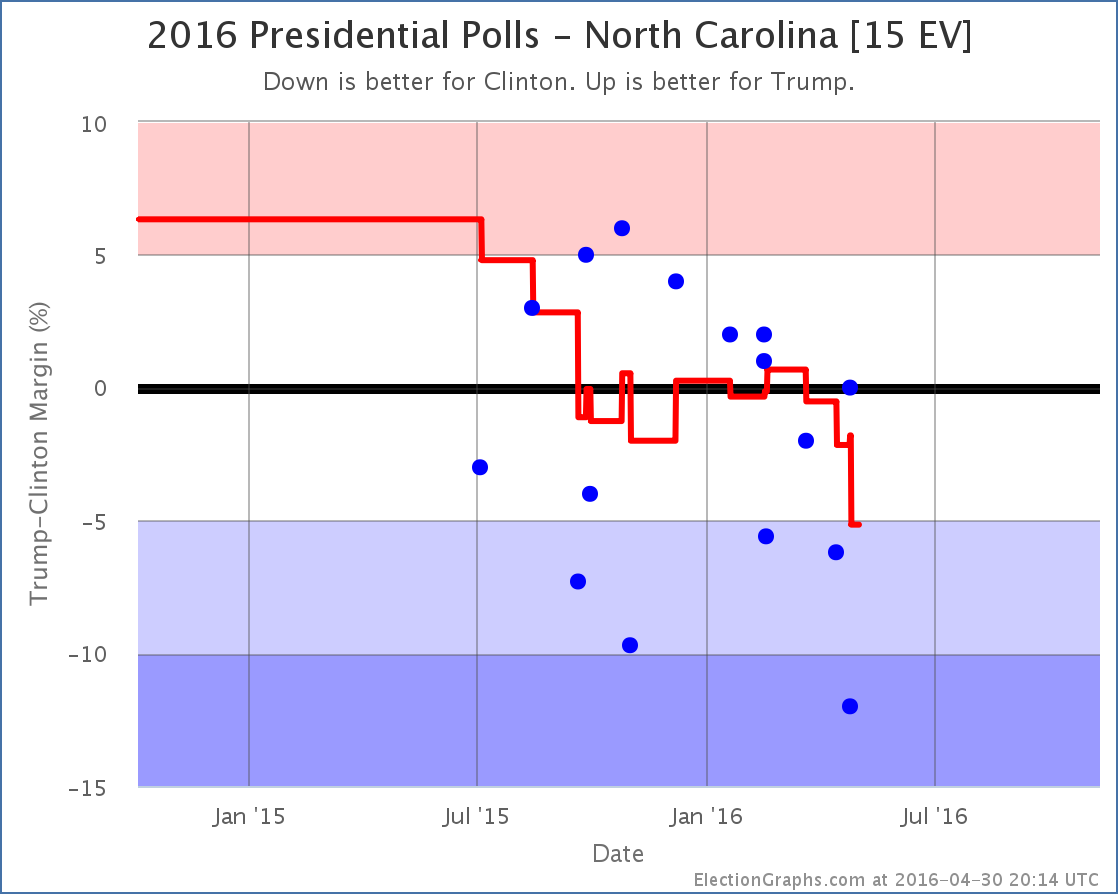
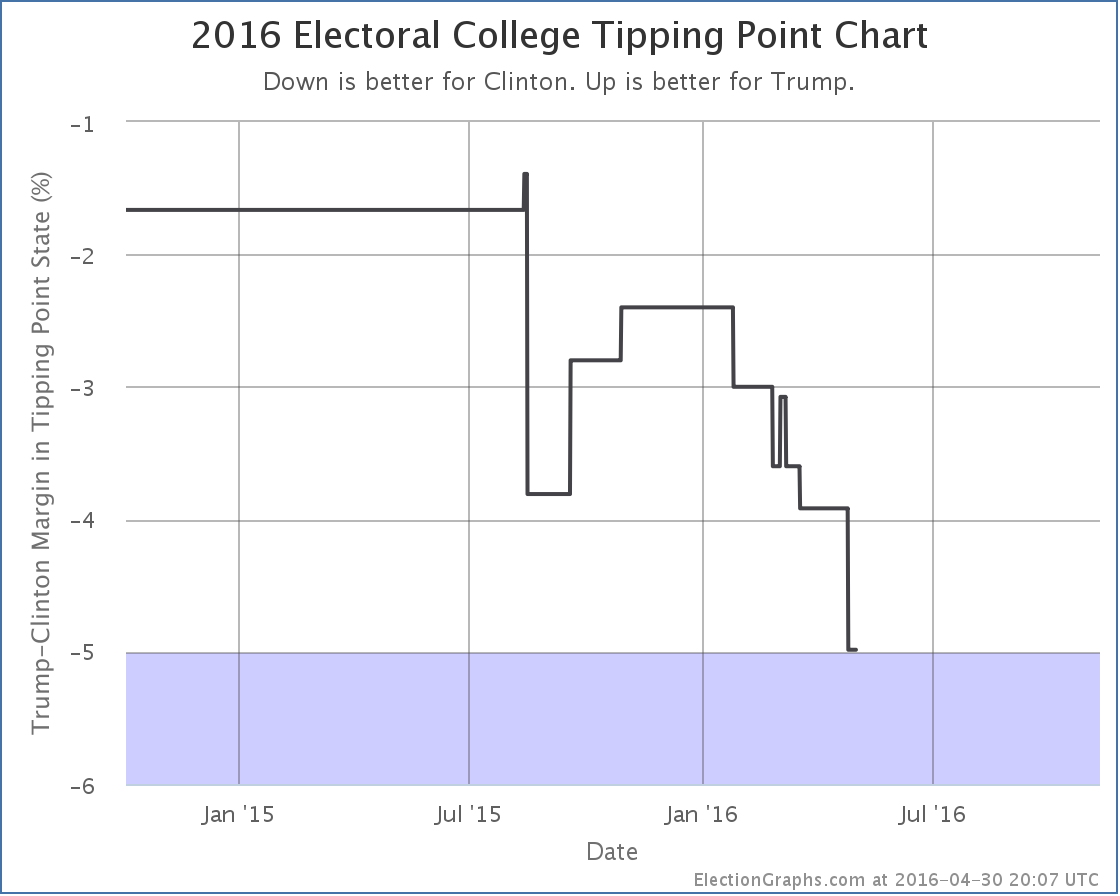
For quite a few months, the Clinton vs Trump poll average in North Carolina just bounced back and forth between Clinton and Trump. But as of now, the best Trump has done in the five most recent polls is a tie. The average has been trending downward since mid-March. The average is now a 5.2% Clinton lead. With that, North Carolina moves from “Weak Clinton” to “Strong Clinton”. This makes North Carolina blue enough that it isn’t considered a possible Trump pick up in the model any more.
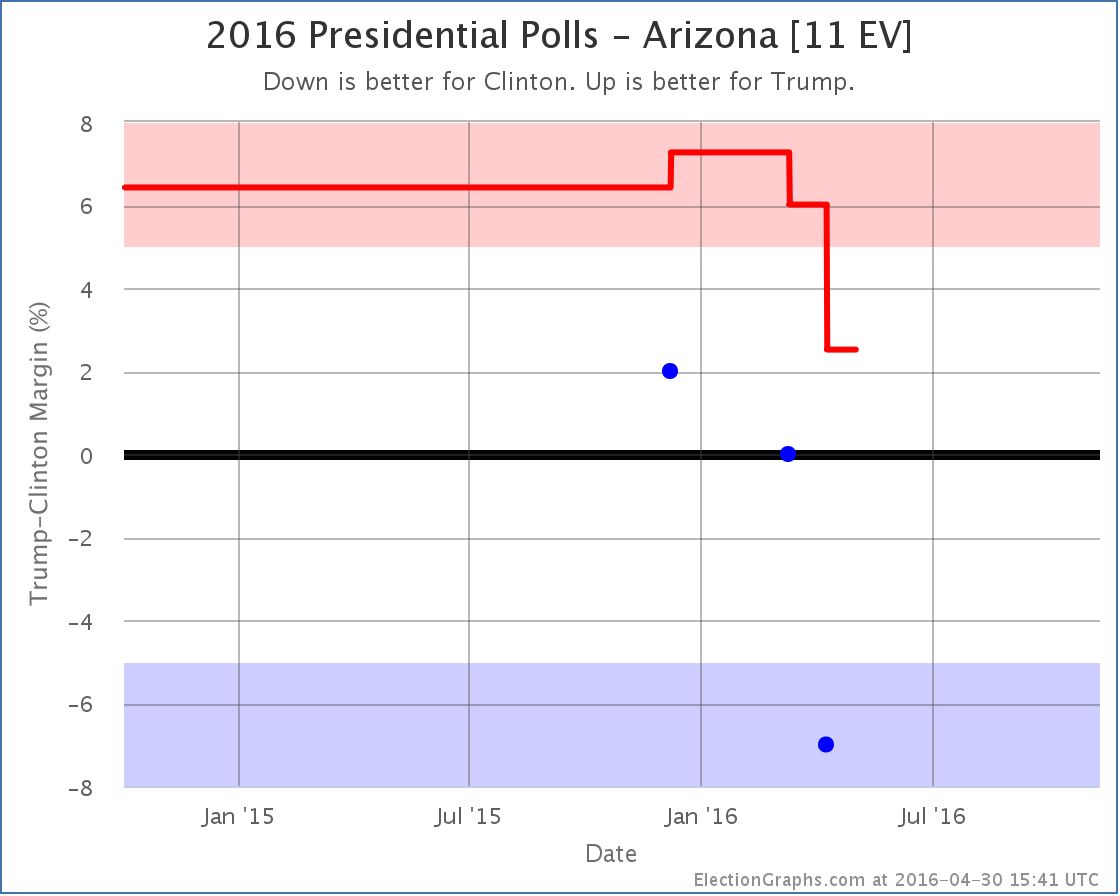
Arizona has been very lightly polled. There have only been three polls of Clinton vs Trump so far. So the average still includes the 2008 and 2012 election results. Each of the polls so far has been worse than the last for Trump though. The average now is only a 2.5% lead for Trump. With that, it is a “Weak Trump” state that is within reach for Clinton.
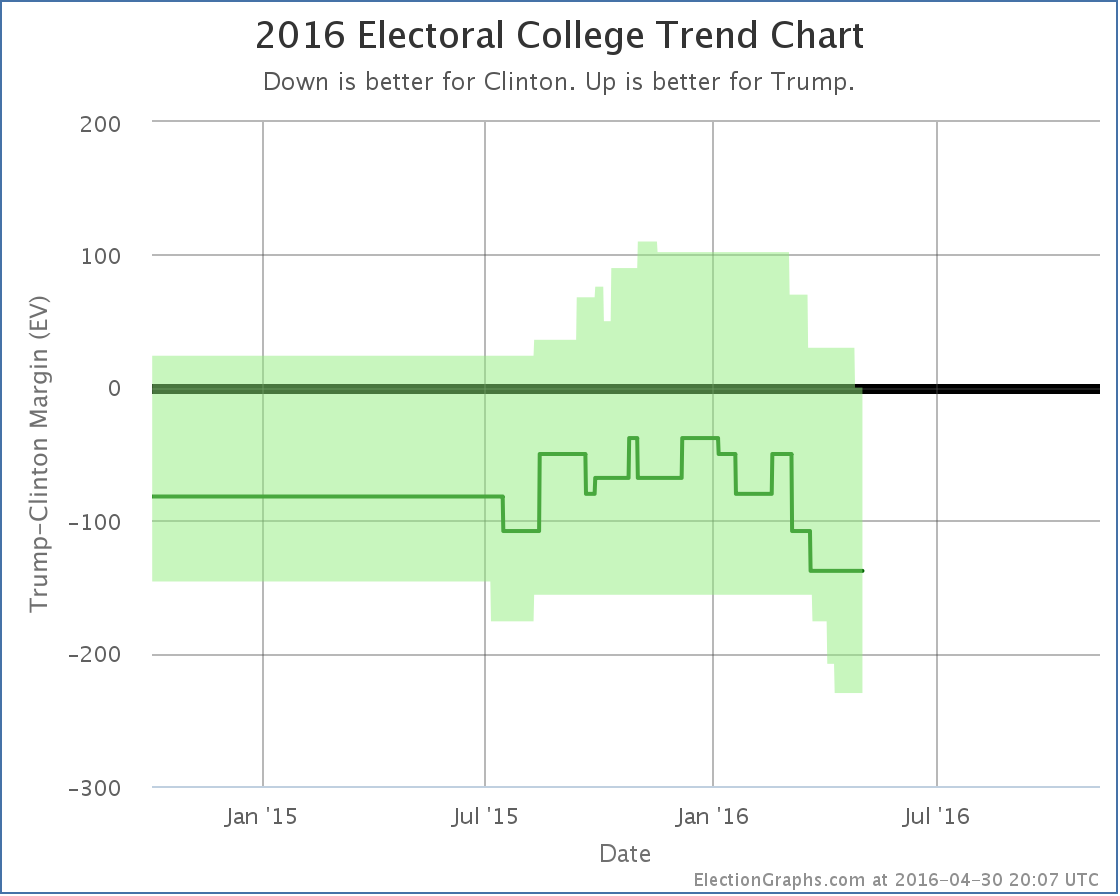
With these two changes, the overall trend in the expected range of possibilities looks like this:
With North Carolina’s movement, the tipping point moved in Clinton’s direction as well:
The downward trend that started around the New Year for Trump is continuing. The current summary now looks like this:
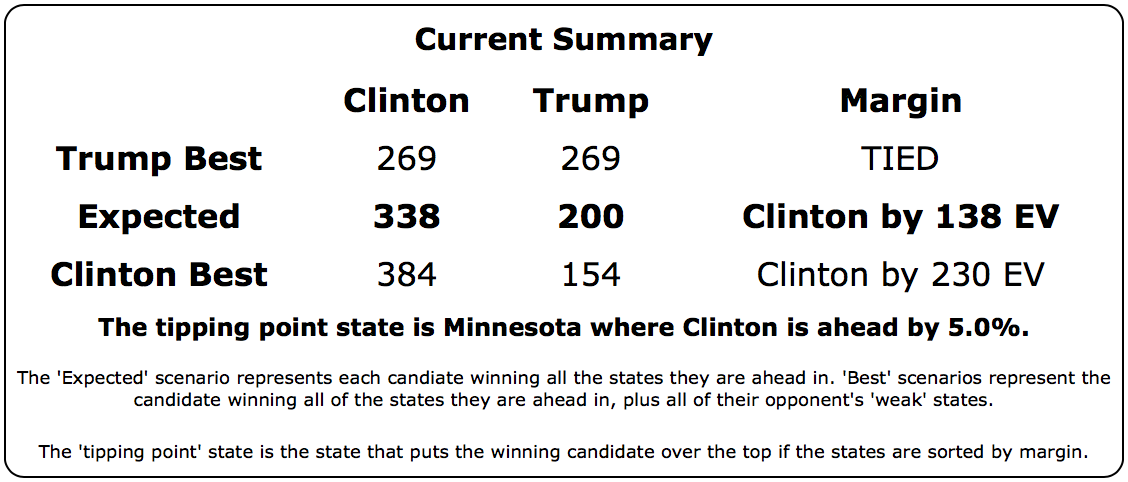
Yes, Clinton’s best case is better than it was with Arizona as a possible pickup.
But look at Trump’s current best case.
It is a 269 to 269 electoral college tie.
Can you even imagine a Clinton vs Trump race thrown into the House of Representatives? Wow.
Of course that won’t happen. But just like a contested convention, an electoral college tie is the kind of thing that gets political junkies excited. :-)
The bottom line on Clinton vs Trump is that after peaking around the New Year, Trump has been declining ever since. He is now at the point where if you give him not only all the states he is ahead in, but also the ones where Clinton is ahead by less than 5%, he only gets to a tie.
Things will undoubtedly change as both parties transition from primary mode to general election mode. The primary season has been very bad for Trump in terms of general election polling. The types of things he has been saying and doing that are winning him the Republican nomination are at the same time souring the general election voter against him.
The question is if he can turn that around once he is the official nominee. (Assuming nothing surprising happens to stop that of course.)
Clinton vs Cruz
Oh yeah, Cruz is still in this too.
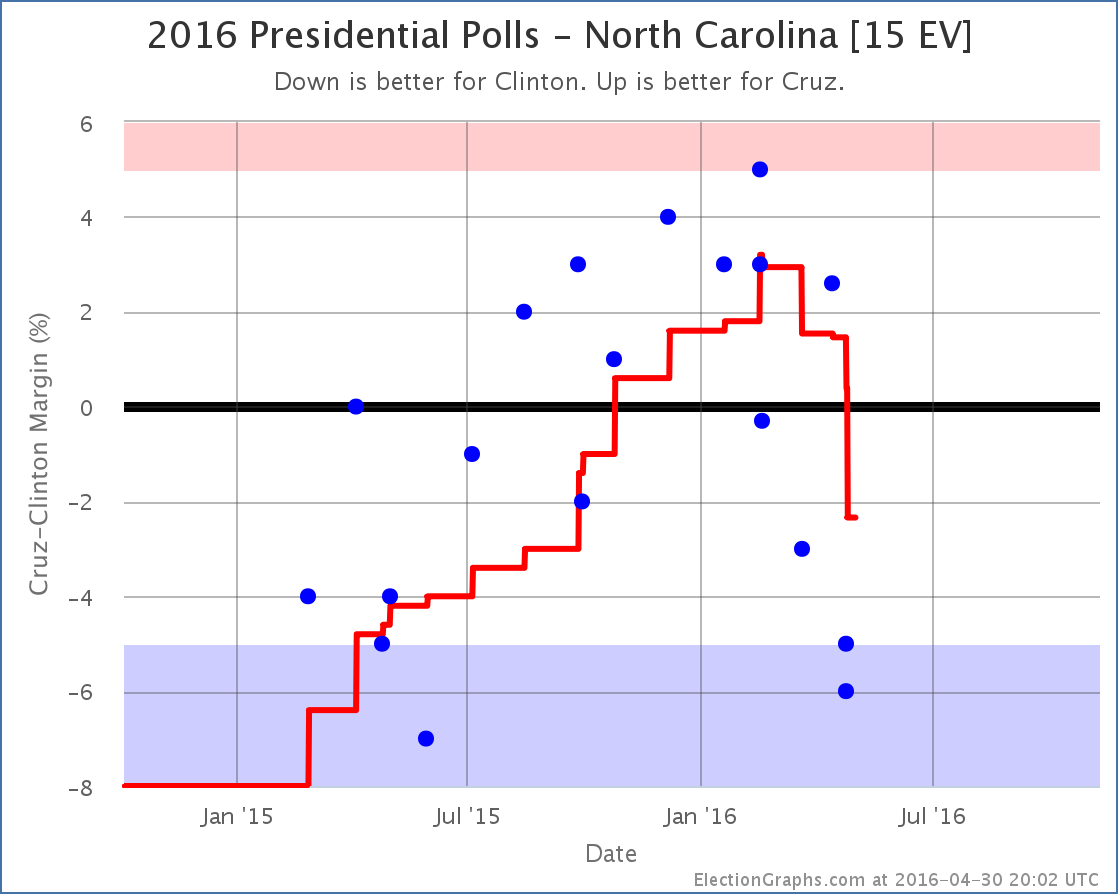
Cruz had been doing better and better in North Carolina. Until mid-March. Since then things have been moving against him. With this update, the lead in the state flips back to Clinton. This moves Cruz’s “expected case”:
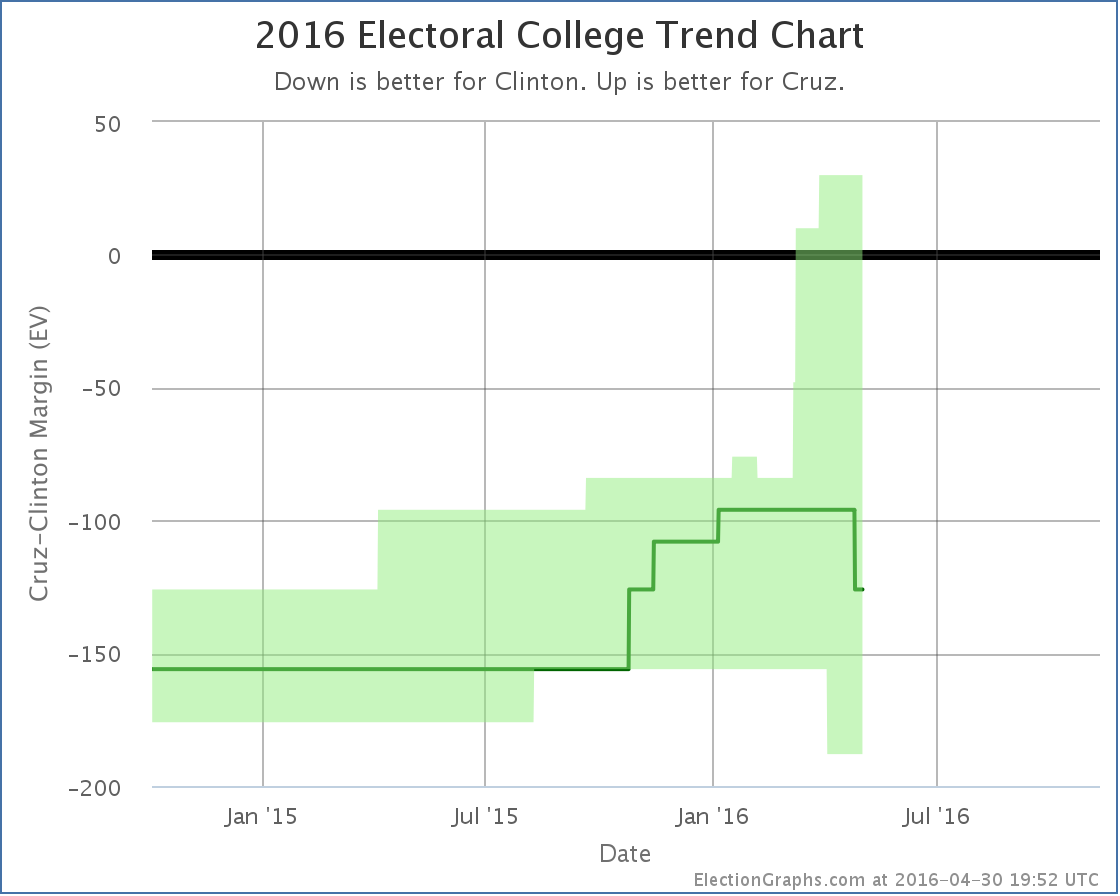
The new summary looks like this:
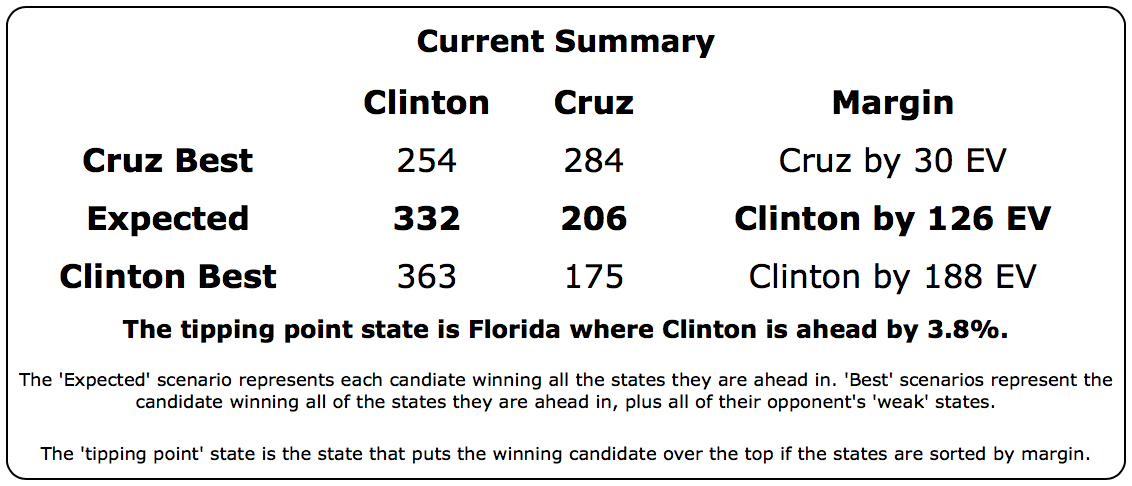
Notice that in all four of the key metrics, the expected case, the two best cases, and the tipping point, Cruz is doing better than Trump against Clinton.
Of course, Trump is on track to be the nominee and Cruz is not, absent some sort of coup at the convention via a rules change, a last minute Trump implosion, or something like that. Republican voters do not seem to be prioritizing “electability” this time around.
191.8 days until polls start closing on election day though. A lot will change between now and then. So we shall see…
Note: This post is an update based on the data on ElectionGraphs.com. Election Graphs tracks both a poll based estimate of the Electoral College and a numbers based look at the Delegate Races. All of the charts and graphs seen in this post are from that site. Additional graphs, charts and raw data can be found there. All charts above are clickable to go to the current version of the detail page the chart is from, which may contain more up to date information than the snapshots on this page, which were current as of the time of this post. Follow @ElectionGraphs on Twitter or like Election Graphs on Facebook to see announcements of updates or to join the conversation. For those interested in individual general election poll updates, follow @ElecCollPolls on Twitter for all the polls as they are added.
[Update 04:10 UTC to add the “Maybe everything is going Trump’s way…” sentence.]
[Update 04:52 UTC to add in some inexplicably missing words where a sentence stopped before it was complete.]
Trump did very well yesterday in PA/MD/CT/RI/DE.
In pledged delegates the results were Trump 110, Kasich 5, Cruz 3.
That is a crushing win, but that is not why I say everything is falling into place. Trump did a little better than expected in pledged delegates, but a massive Trump win had been expected for awhile. This was not a surprise, and was already baked into people’s projections for the rest of the race.
Even with this built into the expectations, as of my post last week we were looking at odds between about 40% on the low side and 64% on the high side for Trump actually getting to 1237 delegates and having an outright majority before the convention. A week later, several things change that and make an outright Trump win look far more likely, and a multi-ballot convention much less likely. If it isn’t the pledged delegate results from last night, then what is it?
The first thing is the officially uncommitted delegates from Pennsylvania. In past contests Trump has done a horrible job getting his loyalists into the slots that are nominally uncommitted, or for that matter even into the slots that are bound to him on the first ballot. It was plausible to expect that Trump would do similarly poorly with Pennsylvania’s uncommitted delegates which are elected by name on the ballot… without any indication on the ballot of who they support.
But Trump appears to have gotten his act together, making sure delegate slates were available to Trump supporters and such. Between delegates that explicitly said they support Trump, and those who said they would vote the way their district went (and all of them went for Trump), Trump ends up with 45 of the 54 uncommitted delegates by my estimates. There is some ambiguity in the statements made by some of these uncommitted delegates and some other folks have estimated the number of Trump votes slightly lower. But all the estimates have Trump winning most of these delegates.
This was unexpected, and also gives more confidence of Trump’s delegate wrangling abilities going forward. (Although Pennsylvania was the biggest pot of uncommitted delegates.)
Add in the uncommitted delegates that have expressed a preference (45 Trump, 3 Cruz, 3 Kasich, 3 TBD) and 2 additional uncommitted Cruz delegates from North Dakota that I logged in the last week, and the net change since New York ends up as:
Trump +155, Cruz +8, Kasich +8.
The new raw totals look like this:
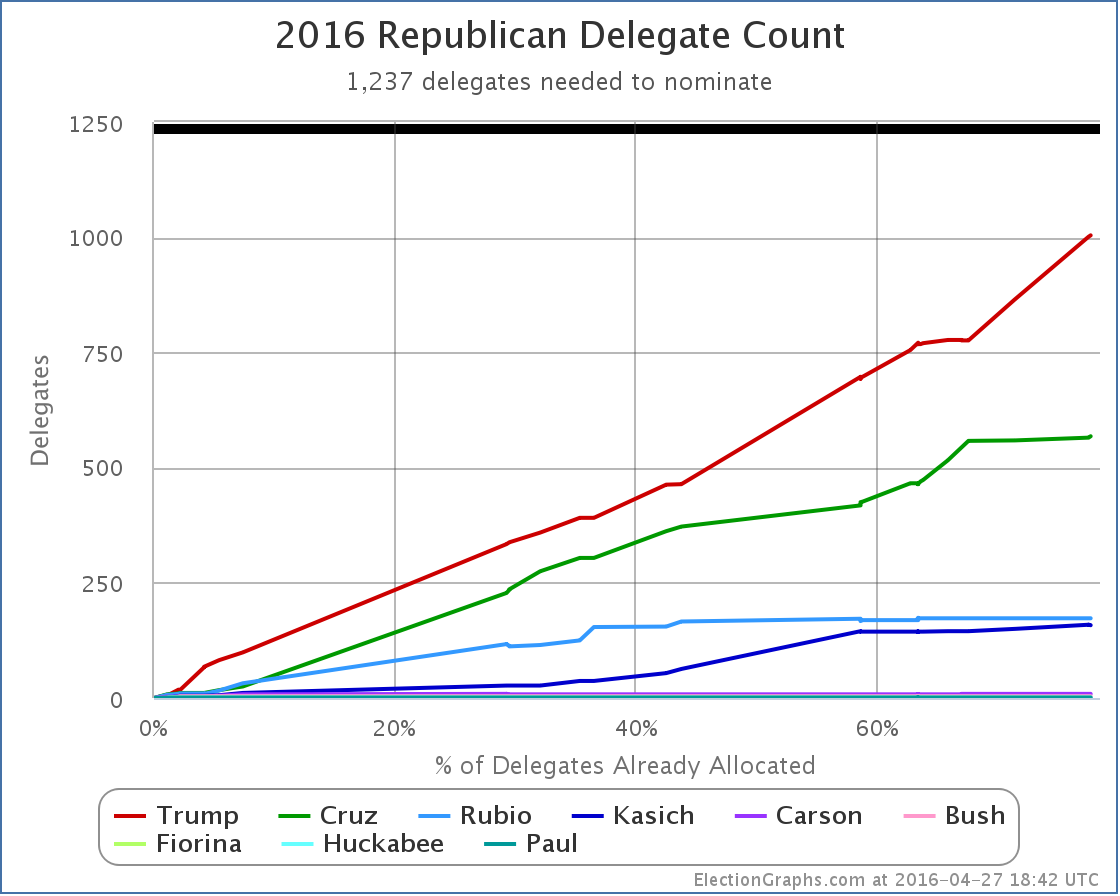
The finish line is in sight. Trump only needs 233 delegates to win this thing directly. No multi-ballot convention, just a straight up win on the first ballot.
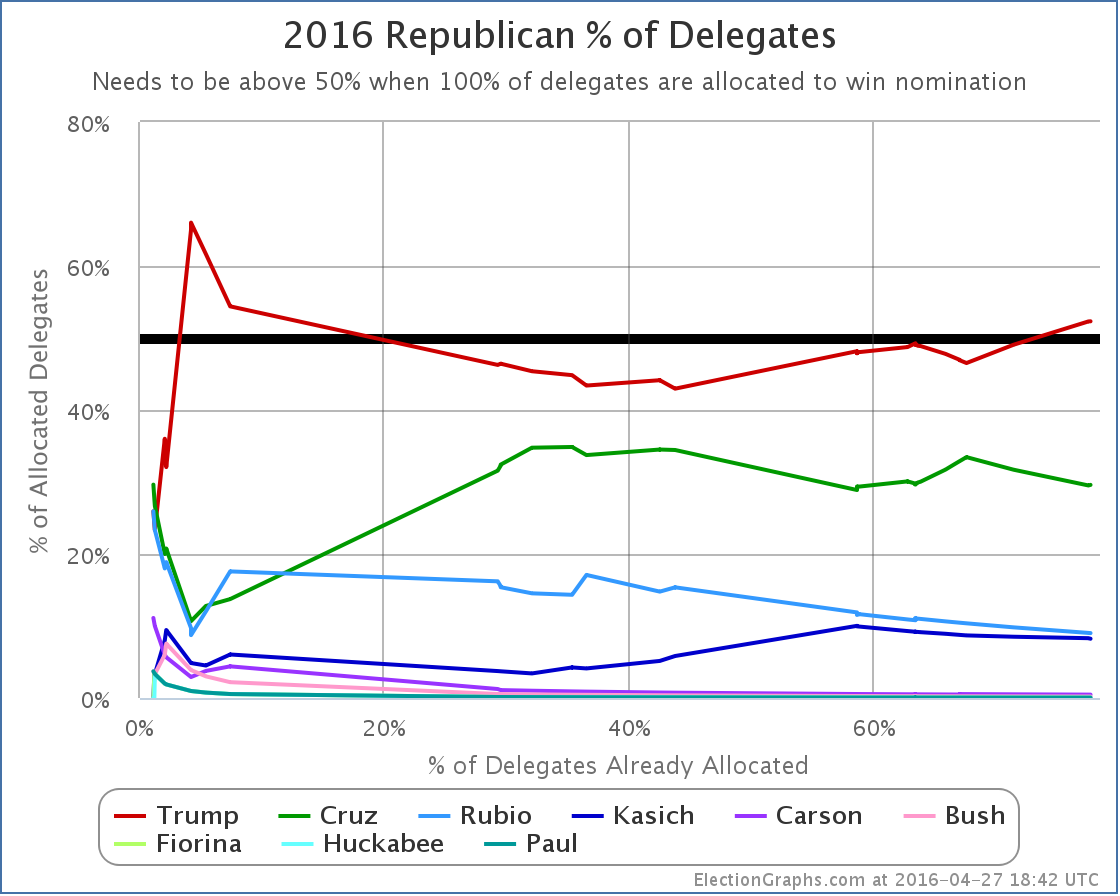
For the first time since Super Tuesday at the beginning of March, Trump also actually has a majority of the delegates so far… 52.32% of the delegates.
But what does it take to keep that? Time for the “% of remaining delegates needed” graph:
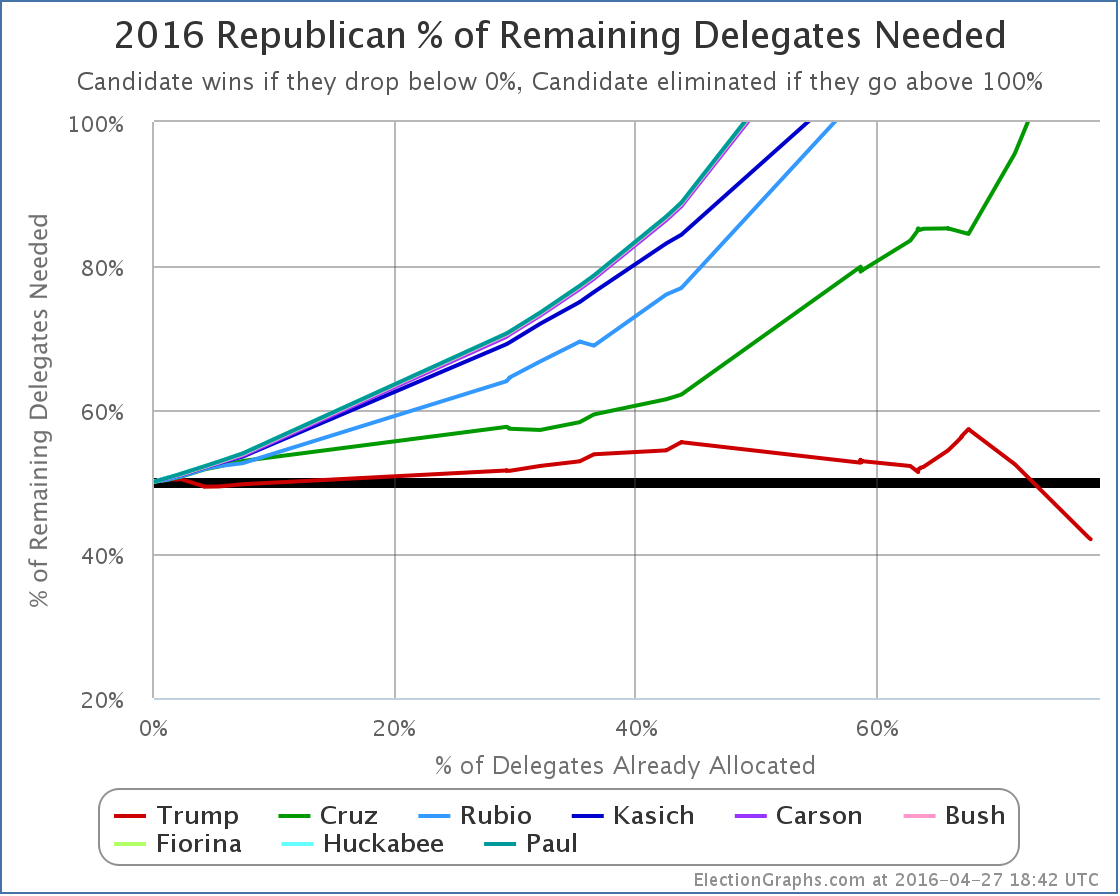
First note that with yesterday’s results Cruz has been mathematically eliminated from the possibility of a first ballot victory. Trump is now the ONLY candidate that can win on a first ballot. Everybody else is done unless there is a brokered convention… or I suppose unless Trump drops out or something crazy like that.
Looking directly at Trump’s line… Trump needed 53.52% of the delegates to improve his position. Since New York he actually got 90.64% of the delegates. This obviously means his position improved a lot. He now only needs 42.06% of the remaining delegates to win.
That means he could do 20% worse at delegate gathering in all the remaining contests than he has so far and still win.
If the Republicans allocated delegates proportionately everywhere like the Democrats do, this would clearly be over. It would be Trump’s nomination, and we’d be done.
Because of how so many Republican states tilt the delegate results to the winner though, if the anti-Trump’s were strong, there would still be a path to block Trump.
The anti-Trump scenarios that gave us odds of a multi-ballot convention relied on three things.
The first we mentioned above… Trump’s failure to win delegates when they were selected individually instead of being bound to primary results. Trump dispensed with that in Pennsylvania.
The second was Indiana. Until the last week, Indiana had not been polled. The anti-Trump contested convention scenarios all relied on Trump losing Indiana. Well, last week Indiana was finally polled. Three times. The results? The RCP average has Trump +6.3%. Given Indiana’s delegate rules, a win like that would get Trump most of Indiana’s 57 delegates… possibly all of them. Oops. And Trump now only needs to be getting 42% of the delegates to be on pace to win.
The third was California. Trump has been ahead in the polls in California forever. But the anti-Trump folks were hoping to keep him from winning by too much and to hold down his delegate total. But in the last week of polling, Cruz has been falling and Trump has been rising, so Trump’s margins have just been growing. RCP now has a 17.4% Trump lead in their California average. Assuming Trump wins Indiana and some of the other remaining states, Trump will very likely only need 30% or less of the delegates in California in order to wrap things up. If he is winning by almost 20%, that is going to be very easy to achieve.
The simulator at The Upshot using default assumptions now shows an almost certain Trump win.
The FiveThirtyEight simulator “follow the experts” model shows Trump 27 votes short of the magic number… but they don’t include ANY of the officially uncommitted delegates that have said they support Trump. Add those in… there are just under 50 of them now depending how you count… and you are easily over 1237.
Finally, Sam Wang’s numerical simulations of the rest of the race have moved from a 64% chance of a Trump win a little over a week ago to a 94% chance today.
I see no reason to disagree with this estimate.
We are no longer on a knife’s edge between a contested convention and an outright Trump win.
#NeverTrump is now hanging on by a thread. They maybe aren’t quite as far gone as Sanders is on the Democratic side, but it is getting close. Their last hope is to try to start turning things around with a surprise win in Indiana. Even with that though, Trump’s odds look very good.
Between yesterday’s results, polls in Indiana, and polls in California, this now looks like an almost certain outright Trump win.
This is now Trump’s to lose. Given everything he has done so far that pundits thought would sink him but in fact only strengthened him, it is hard to see how exactly that would happen.
So… time to start paying more attention to Clinton vs Trump. Right now that looks like Clinton 338 to Trump 200, a 138 electoral vote win for Clinton. But things are still early, and that will change…
Update 2016-05-02 17:52 UTC: Uncommitted delegate update plus adjustment in Rhode Island. Net change: Trump +1, Cruz -2.
Update 2016-05-03 03:53 UTC: Uncommitted delegate update checking multiple sources. Net change: Cruz +2, Kasich -2, Trump -4. (See my wiki for my current best estimates of uncommitted delegate preferences.)
Update 2016-05-04 08:11 UTC: Updates (including uncommitted) in Nevada, Wyoming and North Dakota. Net change: Cruz +6, Carson -2.
Note: This post is an update based on the data on ElectionGraphs.com. Election Graphs tracks both a poll based estimate of the Electoral College and a numbers based look at the Delegate Races. All of the charts and graphs seen in this post are from that site. Additional graphs, charts and raw data can be found there. All charts above are clickable to go to the current version of the detail page the chart is from, which may contain more up to date information than the snapshots on this page, which were current as of the time of this post. Follow @ElectionGraphs on Twitter or like Election Graphs on Facebook to see announcements of updates or to join the conversation. For those interested in individual general election poll updates, follow @ElecCollPolls on Twitter for all the polls as they are added.
|
|


