This is the website of Abulsme Noibatno Itramne (also known as Sam Minter).
Posts here are rare these days. For current stuff, follow me on Mastodon
|
Sam is solo again on this week’s Curmudgeon’s Corner podcast. As you would expect, the big topics are election related. Clinton clinching. The Sanders dead enders. Trump’s really bad week. Veep speculation. All of that. In addition, some brief hits on the Brock Turner case, the Gawker bankruptcy, some Apple stuff… and more!
Click below to listen or subscribe… then let us know your own thoughts!

Recorded 2016-06-11
Length this week – 1:36:22
 1-Click Subscribe in iTunes 1-Click Subscribe in iTunes
 View Podcast in iTunes View Podcast in iTunes
 View Raw Podcast Feed View Raw Podcast Feed
 Download MP3 File Download MP3 File
 Follow the podcast on Facebook Follow the podcast on Facebook
Show Details:
- (0:00:10-0:07:16) But First
- Alone Again
- Agenda
- Early Mornings
- (0:08:06-0:38:24) Election 2016 – Democrats
- Clinton clinches
- Sanders dead enders
- Will Sanders get what he wants?
- Clinton/Warren?
- Stein effect?
- Sanders as an independant?
- (0:39:28-1:11:04) Election 2016 – Republicans
- Trump’s bad week
- Trump’s fundraising
- Where Trump is spending money
- Dump Trump?
- Trump veeps
- Johnson effect?
- (1:12:08-1:36:02) Lightning Round
- Alex promotes his channel
- Brock Turner case
- Gawker bankruptcy
- Some Apple Stuff
- I got tipped!
A couple of days ago, Utah moved from Strong Trump to Weak Trump in my classifications, so I speculated that Trump’s post-clinching bump might be over. But with the most recent batch of polls (from Pennsylvania, Florida and Connecticut) there is already another move in Trump’s direction. Remember that the picture given by trailing state poll averages will always “lag” the underlying situation a bit, but for the moment, the trend I track here still looks like it is moving in Trump’s direction.
Lets look at the details. The state that changes status is Pennsylvania:
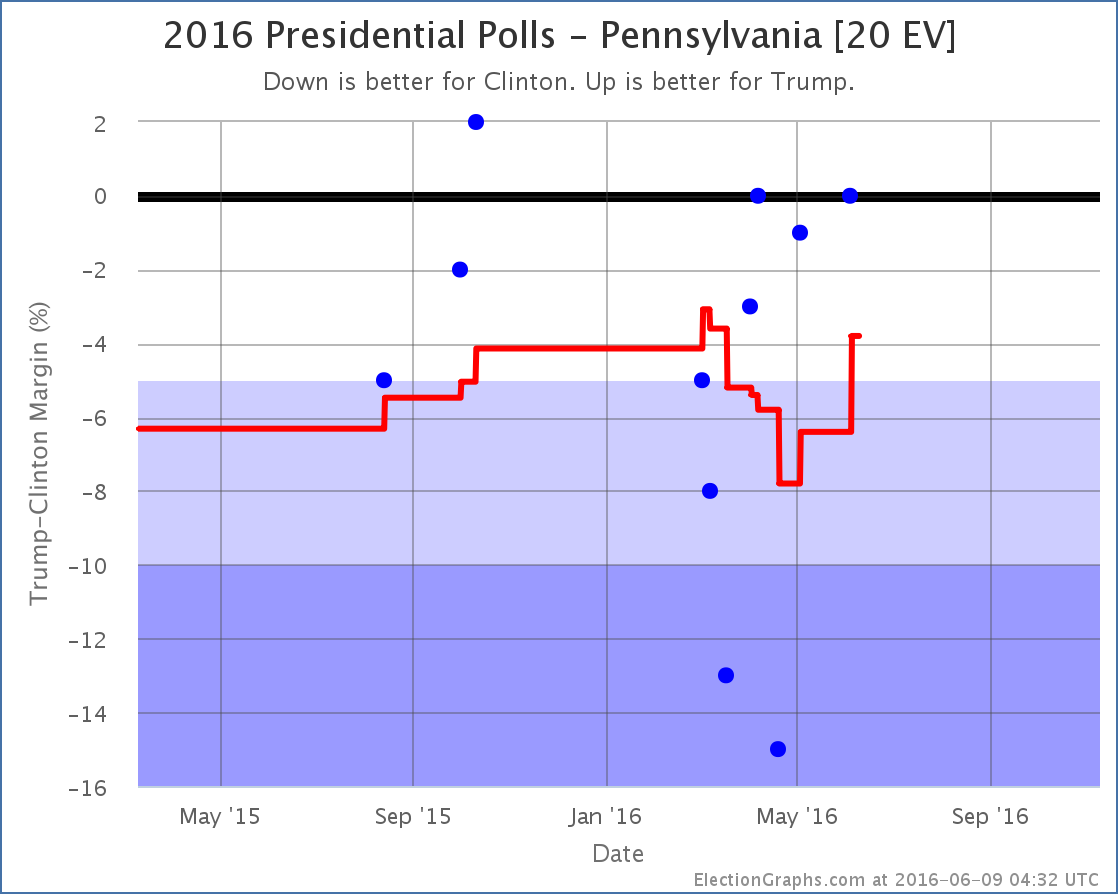
The range of poll results in Pennsylvania has been huge. From a 15% Clinton lead to a 2% Trump lead. With the addition of the latest poll, one of the two polls that showed Clinton up by more than 10% fall off the average, and therefore the average pops in Trump’s direction.This brings the average in Pennsylvania to a 3.8% Clinton lead. Clinton is still ahead, but it is once again close enough that I allow for the possibility of Trump pulling the state into his column.
If Trump actually is able to get Pennsylvania, it is a big get. Pennsylvania has the sixth largest number of electoral votes. Adding Pennsylvania into Trump’s best case, the national trend now looks like this:
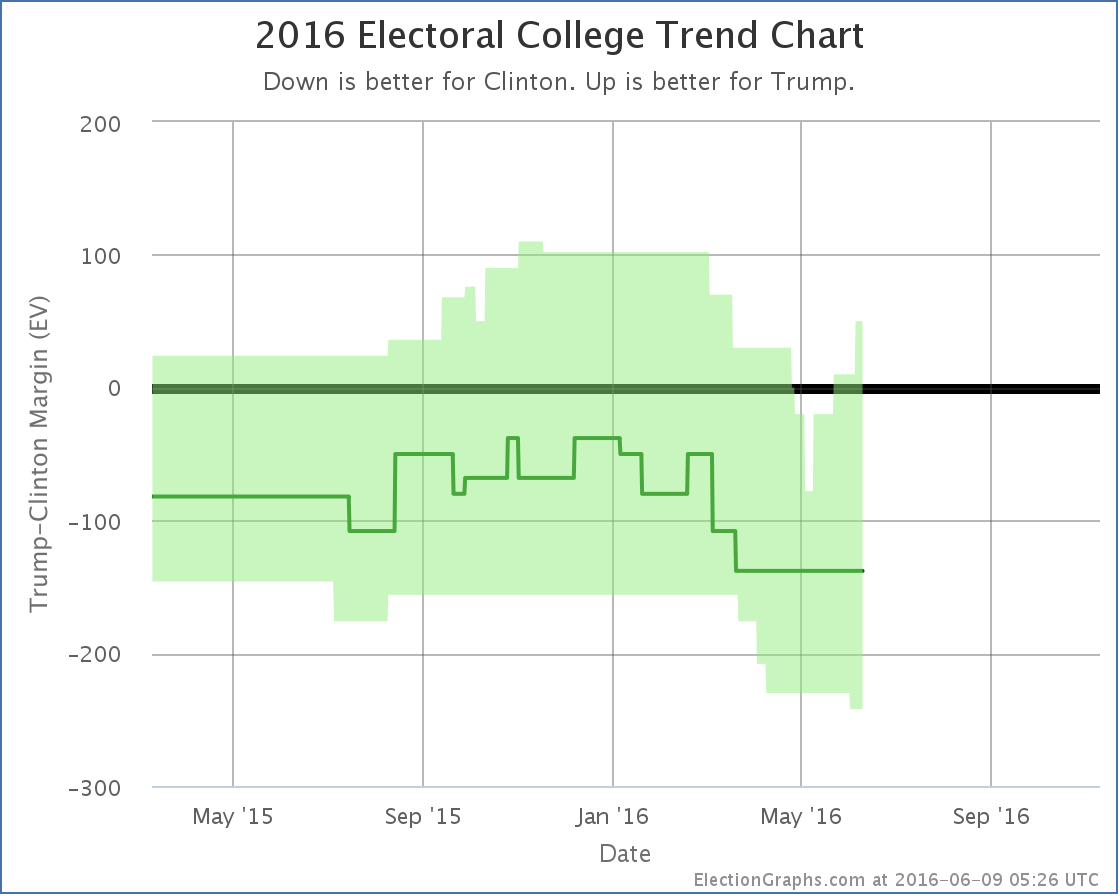
That spike in the upper right is Pennsylvania. In both electoral votes and the potential to make a difference in the race, Pennsylvania is more significant than Utah. If Clinton were to win Utah, it would be a surprise extra on top of an already large win, but a competitive Pennsylvania would potentially be very important to a winning path for Trump.
With Pennsylvania in the mix, if Trump won all the states where he leads, plus all the states where Clinton’s lead is less than 5%, Trump wins by a 50 electoral vote margin. This is his best “best case” since March.
Overall, despite Utah, and despite the fact the center “expected” line hasn’t moved, it looks like the overall trend here is still toward Trump.
The tipping point also moves with this change, and further boosts that impression:
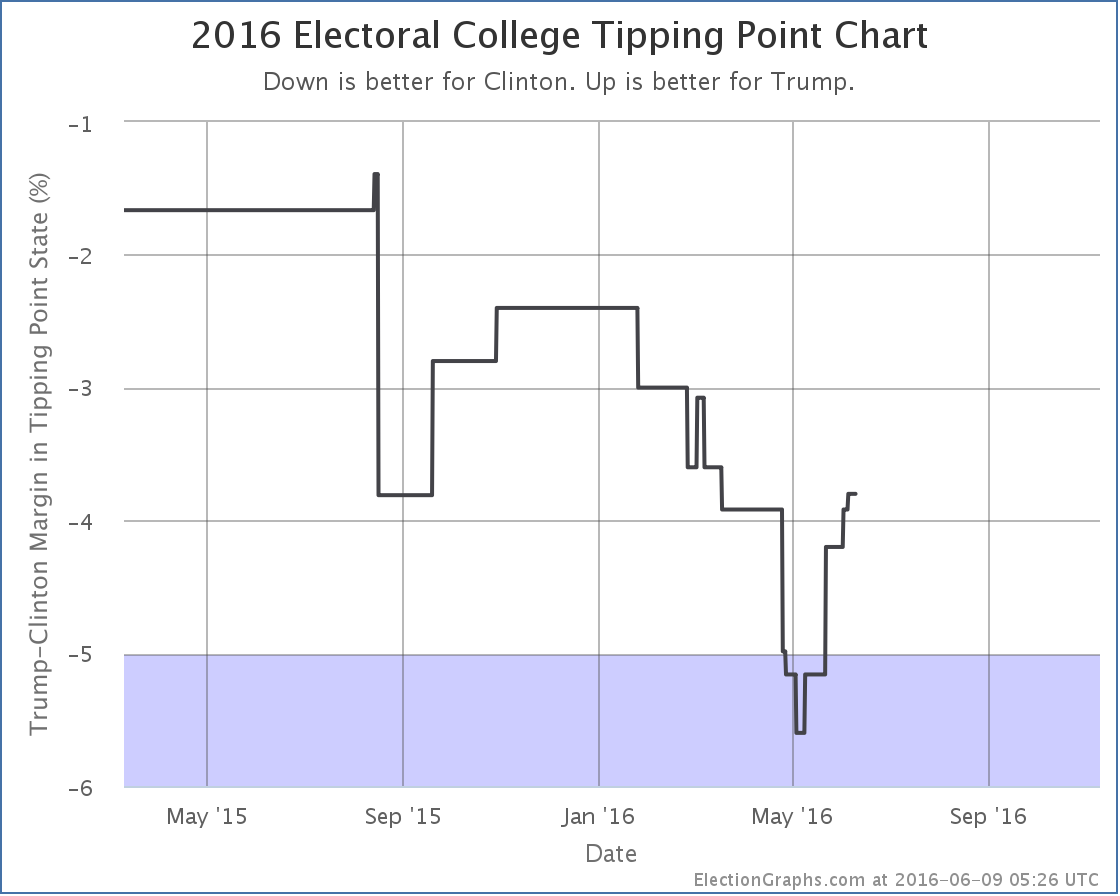
The tipping point moves from a Clinton lead of 3.9% in Nevada to a Clinton lead of 3.8% in Pennsylvania.
Given Clinton clinching the Democratic nomination and the national polls already showing Clinton pulling ahead, an end to the Trump bounce and a beginning of a Clinton bounce is to be expected. But it isn’t showing up here yet…
152.7 days until polls start to close on election night.
Note: This post is an update based on the data on ElectionGraphs.com. Election Graphs tracks both a poll based estimate of the Electoral College and a numbers based look at the Delegate Races. All of the charts and graphs seen in this post are from that site. Additional graphs, charts and raw data can be found there. Follow @ElectionGraphs on Twitter or like Election Graphs on Facebook to see announcements of updates or to join the conversation. For those interested in individual general election poll updates, follow @ElecCollPolls on Twitter for all the polls as they are added. If you find the information in these posts interesting or useful, please consider visiting the tip jar.
Trump clinched the nomination a week and a half ago but there were a few more contests left. CA/NJ/SD/MT/NM have now weighed in with their 303 delegates. Trump got all 303. As an unopposed candidate at this point, this is not unexpected.
And while the Democrats still have DC left, this is the end of the primary process on the Republican side. There are still 18 uncommitted delegates whose preferences are unknown, but their decisions at this point won’t change much.
Lets look quickly at the updated graphs:
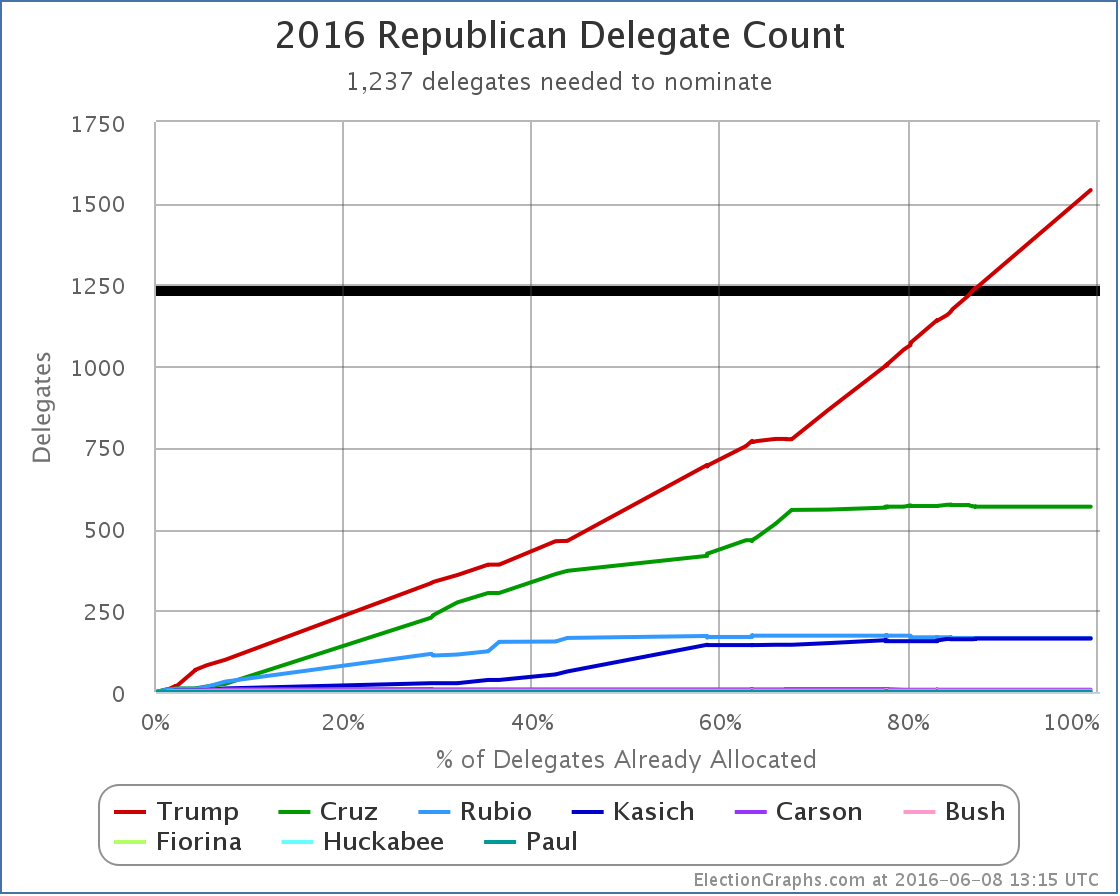
With this update Trump moves from just barely over the “magic number” to well over it with plenty of room to spare. The delegate count is now: Trump 1541, Cruz 569, Rubio 166, Kasich 164, Carson 7, Bush 4, Fiorina 1, Huckabee 1, Paul 1.
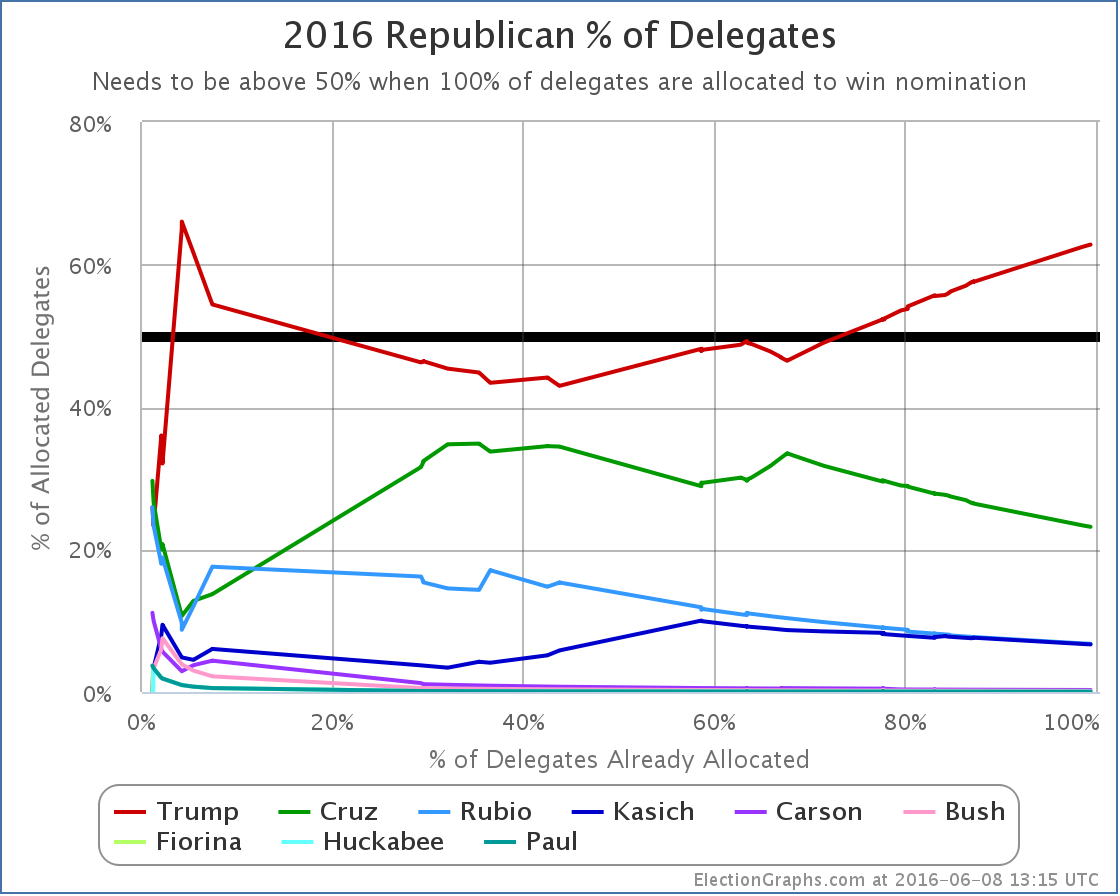
Trump now has 62.80% of the delegates allocated so far.
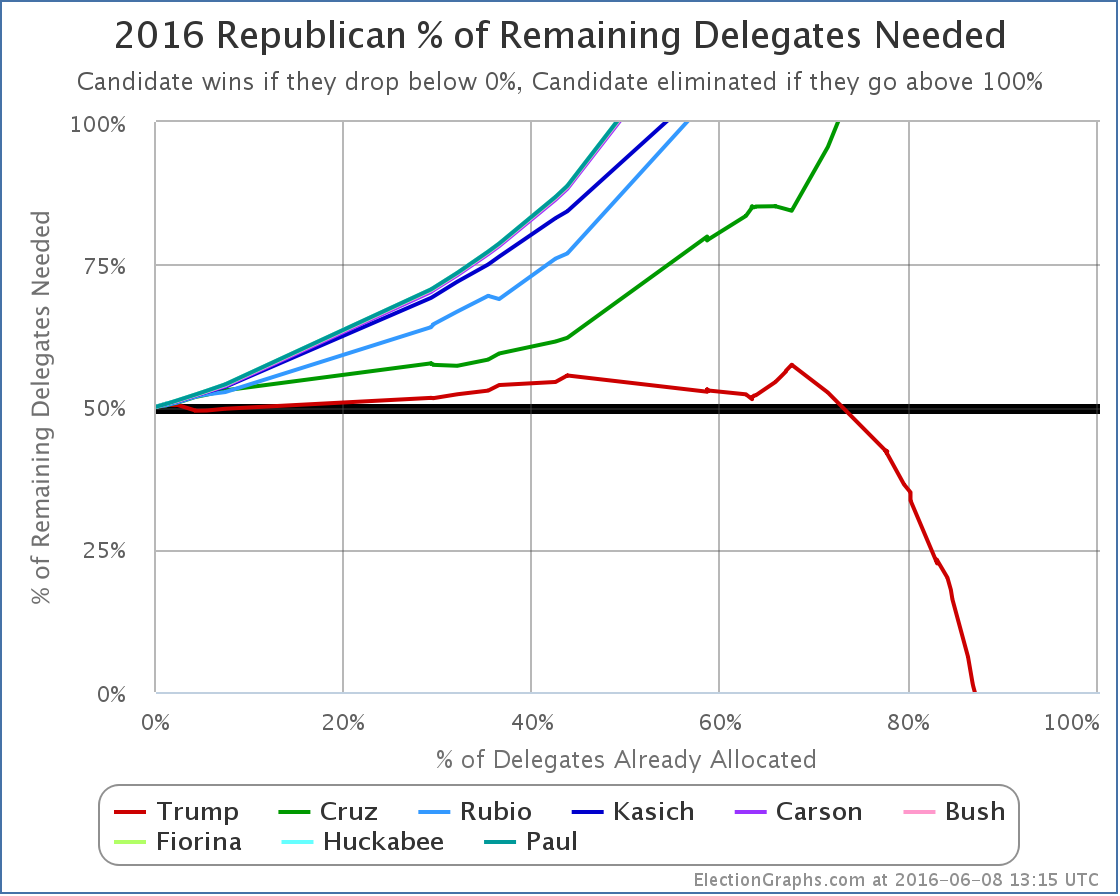
And just for reference, the “% needed to win” in final form.
There isn’t much more to say since this race is over minus any unexpected craziness. If there are any additional developments of note, we’ll update accordingly, but none is expected at the moment.
Time to concentrate on the general election.
Update 2016-06-30 06:00 UTC – Update from Vermont. Net change Kasich -1, Paul +1. (A Kasich delegate who considered themselves free after Kasich dropped out pledged his support to Paul.)
Update 2016-07-20 07:19 UTC: Final Election Graphs estimate was Trump 1541, Cruz 569, Rubio 166, Kasich 163, Carson 7, Bush 4, Paul 2, Fiorina 1, Huckabee 1, TBD 18. We now have the official roll call from the Republican National Convention: Trump 1725, Cruz 484, Kasich 125, Rubio 123, Carson 7, Bush 3, Paul 2, DNV 3. Differences were due to the application of rules in some states requiring all votes to go to candidates that were actually nominated (only Trump was officially nominated at the convention) and movement of additional uncommitted delegates to Trump.
Note: This post is an update based on the data on ElectionGraphs.com. Election Graphs tracks both a poll based estimate of the Electoral College and a numbers based look at the Delegate Races. All of the charts and graphs seen in this post are from that site. Additional graphs, charts and raw data can be found there. Follow @ElectionGraphs on Twitter or like Election Graphs on Facebook to see announcements of updates or to join the conversation. For those interested in individual general election poll updates, follow @ElecCollPolls on Twitter for all the polls as they are added. If you find the information in these posts interesting or useful, please consider visiting the tip jar.
Since the last update there have been polls in New Jersey, California and Utah. The results in Utah are the ones that made a difference:
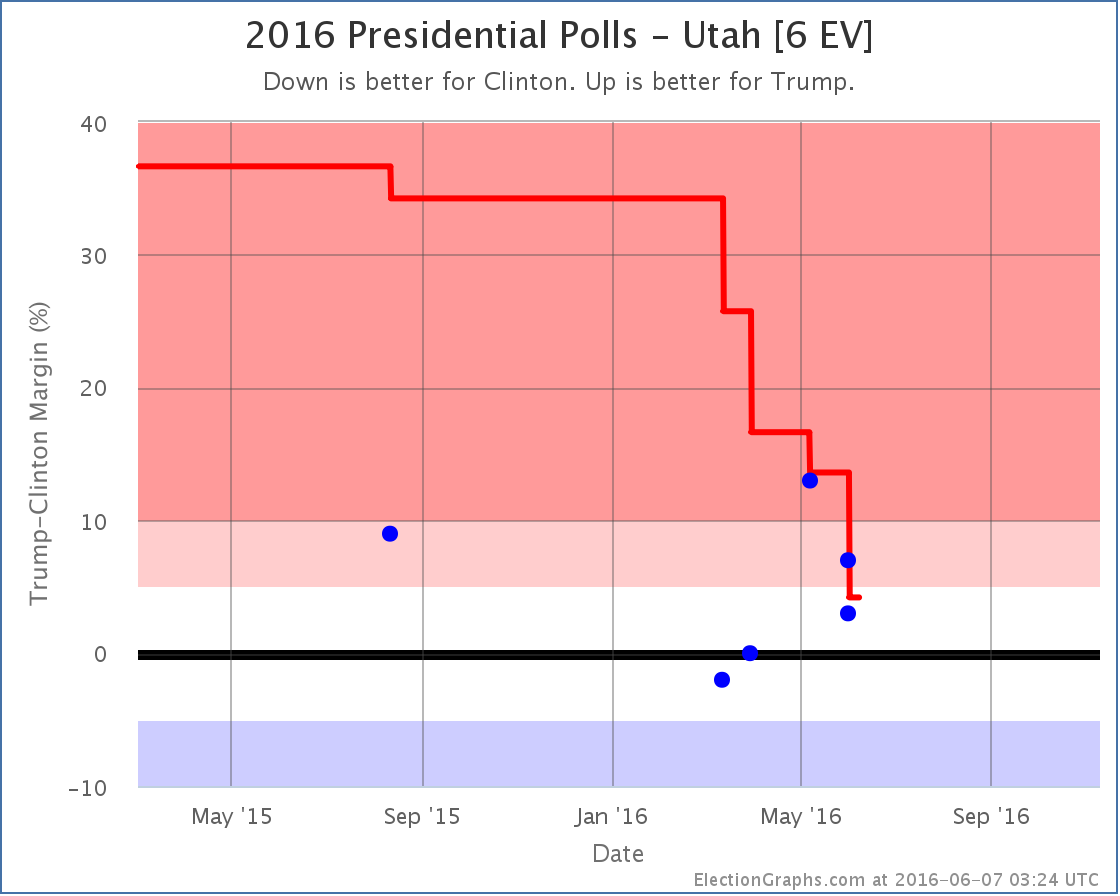
There are actually two new results logged in Utah, both from Gravis, covering the same time period. They asked the general election question twice. Once with just Clinton and Trump showing Trump leading by 7%, then again adding Johnson as a possibility, which reduces Trump’s lead to 3%. Rather than pick one or the other result, I include both.
It could be argued that this gives a single poll double weight in the average, but the way I think of it, this really is two separate results, measuring the election in different ways. So I chose to include both. This is arguable, and other people tracking poll averages may choose a different route. But this is the way I am doing it.*
In any case, these polls are within the range we have seen in all the polls this year. There is quite a bit of variability, but the one thing that is clear is that the Republican lead is much smaller than the 21% to 48% margins the Republicans saw in the 1996 to 2012 general elections. Since my poll averages are “primed” with the results of those five elections, it took awhile for the poll average to move from the huge Republican margin one would expect if Utah followed the pattern of the last few elections down to the 4.2% margin Trump now has. Put simply, this change was so large, a lot of evidence was needed before the average really believed it.
With Trump’s lead in Utah now less than 5%, it now goes into the Election Graphs “Weak Trump” category, which means it is a possible Clinton pick up. So her best case scenario improves:
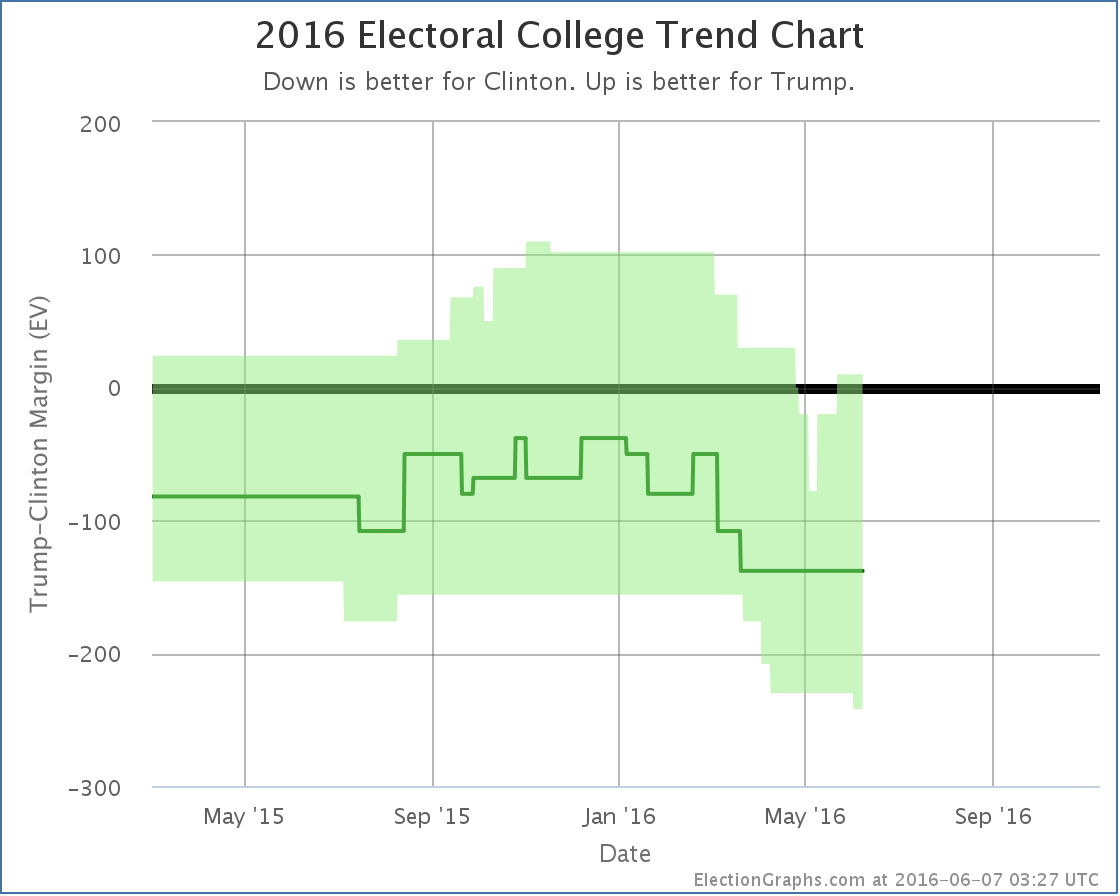
That little nub at the bottom right represents the possibility of Clinton winning Utah.
Leaving out the states where one of the candidates is ahead by more than 10%, the center of the spectrum now looks like this:
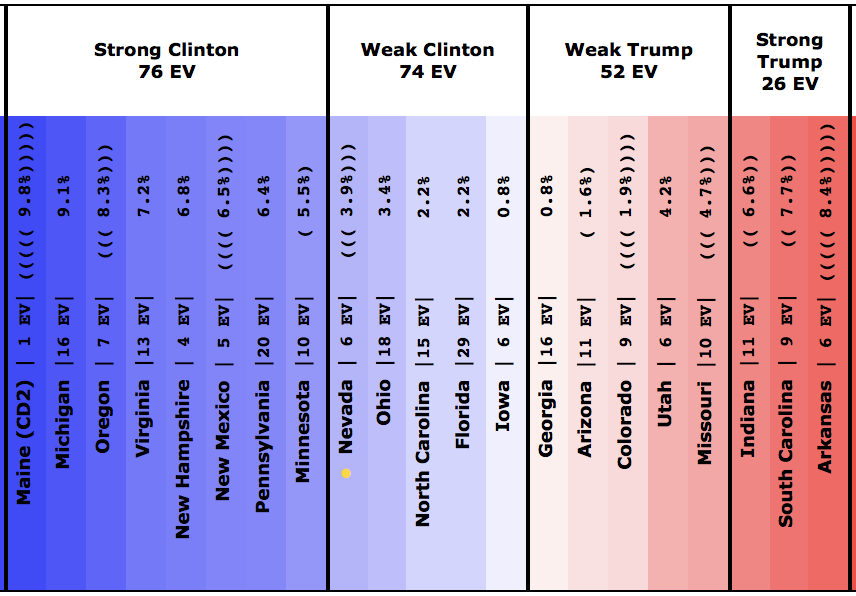
There are a lot of states here that haven’t yet had a full five polls for our average (indicated by the parentheses). But the fact that Georgia, Arizona and Utah may be competitive for Clinton show that Trump may indeed be “redrawing the map”… just not in his favor.
The tipping point is only a 3.9% Clinton lead on the other hand, so it isn’t an insurmountable lead by any means. Trump could still win this if campaign events go his way.
But Utah a possible Democratic stretch goal? Wow. Utah!
For reference, the last time Utah went Democratic was the Lyndon Johnson landslide over Barry Goldwater in 1964. Now, I still wouldn’t bet on Clinton winning Utah. But that it is even close is still stunning.
The overall situation summary now looks like this:
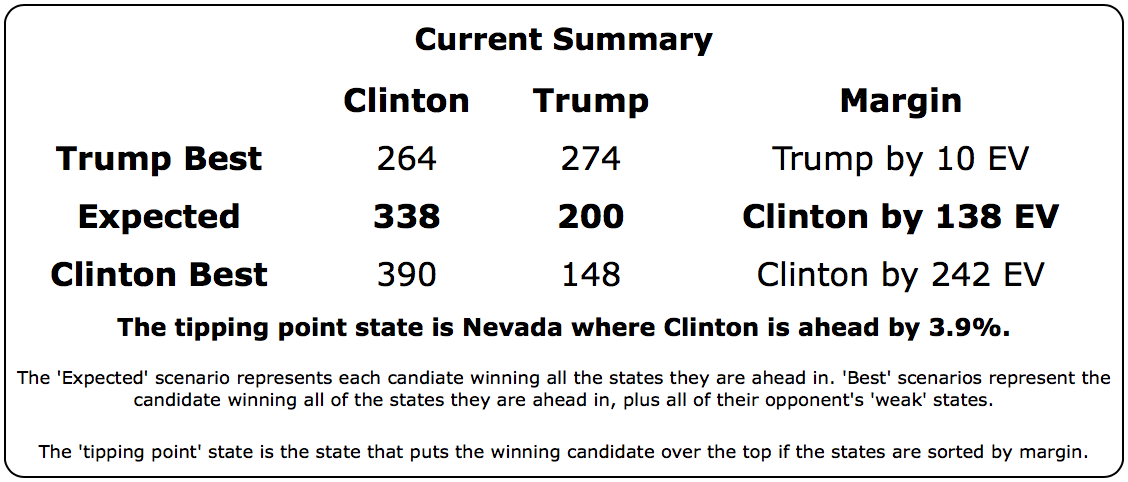
So wait, is the Trump bounce over? Well, this is a move in Clinton’s direction, so it breaks the streak of movements in Trump’s direction that had lasted for about a month. So by that measure at least the “bump” may be over.
This is just one change though, it would be premature to say that the trend is now in Clinton’s direction. As usual, we need to wait for more polls…
154.8 days until the general election polls start to close. There will be plenty of movement between now and then. Stay tuned.
* For more notes on how polls including third and forth parties will be treated on Election Graphs, see the archive of @ElecCollPolls tweets from May 29th.
Note: This post is an update based on the data on ElectionGraphs.com. Election Graphs tracks both a poll based estimate of the Electoral College and a numbers based look at the Delegate Races. All of the charts and graphs seen in this post are from that site. Additional graphs, charts and raw data can be found there. Follow @ElectionGraphs on Twitter or like Election Graphs on Facebook to see announcements of updates or to join the conversation. For those interested in individual general election poll updates, follow @ElecCollPolls on Twitter for all the polls as they are added. If you find the information in these posts interesting or useful, please consider visiting the tip jar.
Edit 14:20 UTC – Fixed typo.
On this week’s Curmudgeon’s Corner Sam is mostly solo. He talks about the 9th anniversary of this podcast, the usual rundown of Election 2016 with bits on Trump’s recent antics, the Sanders end game, the Libertarian convention and even David French. In the non-political world, he covers the gorilla incident, hate speech vs free speech, and a book he read recently. And then to top it off, we have Michael from Pennsylvania back to talk more about gay Republicans.
Click below to listen or subscribe… then let us know your own thoughts!

Recorded 2016-06-04
Length this week – 1:49:31
 1-Click Subscribe in iTunes 1-Click Subscribe in iTunes
 View Podcast in iTunes View Podcast in iTunes
 View Raw Podcast Feed View Raw Podcast Feed
 Download MP3 File Download MP3 File
 Follow the podcast on Facebook Follow the podcast on Facebook
Show Details:
- (0:00:10-0:03:44) But First
- (0:05:00-0:32:18) Election 2016 – Trump Stuff
- Call for Cohosts
- Podcast Anniversary
- Nomination Clinched
- Normal Wolves (Alex Break)
- Republican Capitulation
- This week’s Trump craziness
- Anti-Trump violence
- (0:33:28-1:02:45) Election 2016 – Everything Else
- Sanders End Game
- Libertarian Convention
- David A French?
- (1:03:25-1:22:48) Hodgepodge
- Gorilla Incident
- Hate Speech
- Book: Dutch
- (1:24:08-1:49:12) Michael from Pennsylvania
The national polls at this point show that Trump’s “bump” from clinching the nomination is most likely already over, and Clinton has started to gain ground again. You can see this in both the Pollster and RCP charts. Here at Election Graphs though we track the state level polls and model the electoral college.
Since in any given state there are fewer polls than are done at the national level, the state poll averages move more slowly, and therefore the national picture also reacts more slowly to changes in the state of the race. So while the national polls have seen the bounce come or go, we are still seeing improvement in Trump’s situation.
Since the last update about 9 days ago there have been polls added in New Mexico, Virginia, North Carolina, Oregon, Michigan, New York, New Jersey, New Hampshire, Georgia, California (x4), and Florida. The Florida one is the one that resulted in an overall change.
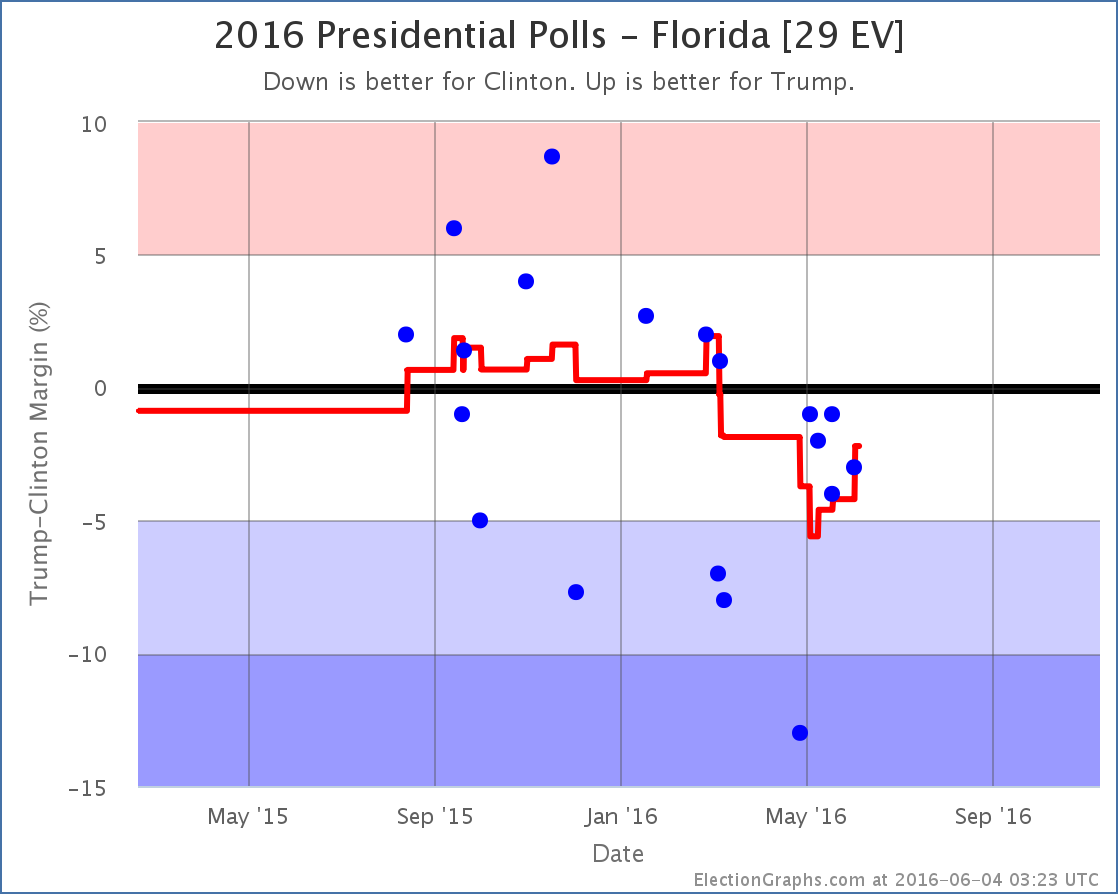
Basically, what now looks like an outlier poll from April showing Clinton with a huge 13% lead rolls off the average and so we have a pop in the Trump direction. Florida doesn’t change categories though. I had it classified as “Weak Clinton” before, and it is still “Weak Clinton” now.
But Florida was the tipping point state, the state that would have put Clinton over the top if you rank the states by how strongly they support one candidate over the other. So when Florida moves, so does the tipping point:
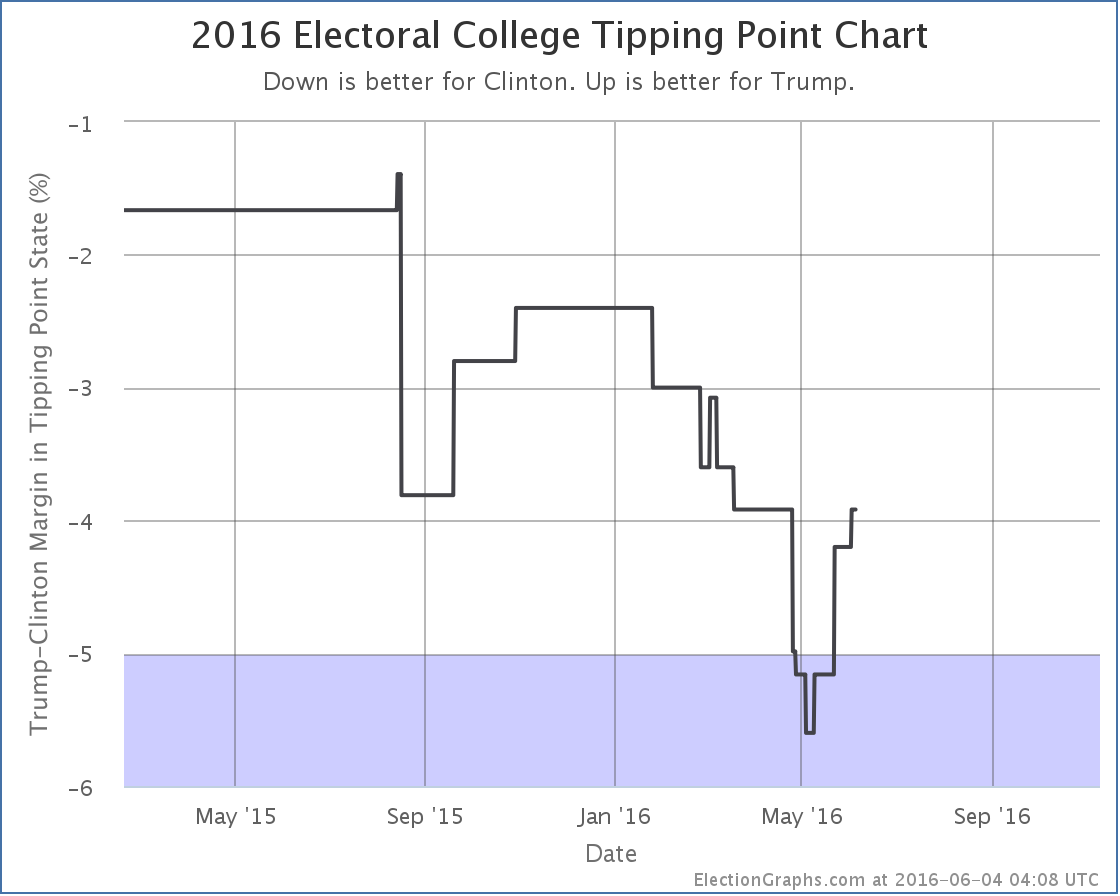
The tipping point moves from a 4.2% Clinton lead in Florida to a 3.9% Clinton lead in Nevada.
This means that while Clinton is clearly ahead, it would only take about 2% of people changing their minds (if those 2% were evenly distributed across the country) to flip the lead to Trump. You could get a similar result from the undecideds breaking disproportionately to Trump.
The national polls indicate Clinton is pulling further ahead again. We will quite possibly see that soon at the state by state level tracked here. But not yet. For now, the analysis here is still showing Trump gaining ground.
157.3 days until polls start to close on election night 2016.
Note: This post is an update based on the data on ElectionGraphs.com. Election Graphs tracks both a poll based estimate of the Electoral College and a numbers based look at the Delegate Races. All of the charts and graphs seen in this post are from that site. Additional graphs, charts and raw data can be found there. All charts above are clickable to go to the current version of the detail page the chart is from, which may contain more up to date information than the snapshots on this page, which were current as of the time of this post. Follow @ElectionGraphs on Twitter or like Election Graphs on Facebook to see announcements of updates or to join the conversation. For those interested in individual general election poll updates, follow @ElecCollPolls on Twitter for all the polls as they are added.
The Election Graphs delegate estimate now has Trump at 1238, one more than he needed to clinch the nomination.
AP announced that Trump had exceeded 1237 by their count on Thursday. They had canvassed the remaining uncommitted delegates who had not expressed a public preference, and found enough of them to put Trump over the top. When AP does this sort of thing, they don’t generally release their full list of delegates though, so it was hard to confirm this independently. But Election Graphs was able to spend a few hours Friday night digging through various sources to look for more specific information on specific uncommitted delegates, and we were also able to get Trump over the top.*
He will of course get even more delegates on June 7th, but he doesn’t need them. Absent a catastrophic unexpected event, Trump will be the Republican nominee for President in 2016.
The final “% of remaining delegates needed to win” chart looks like this:
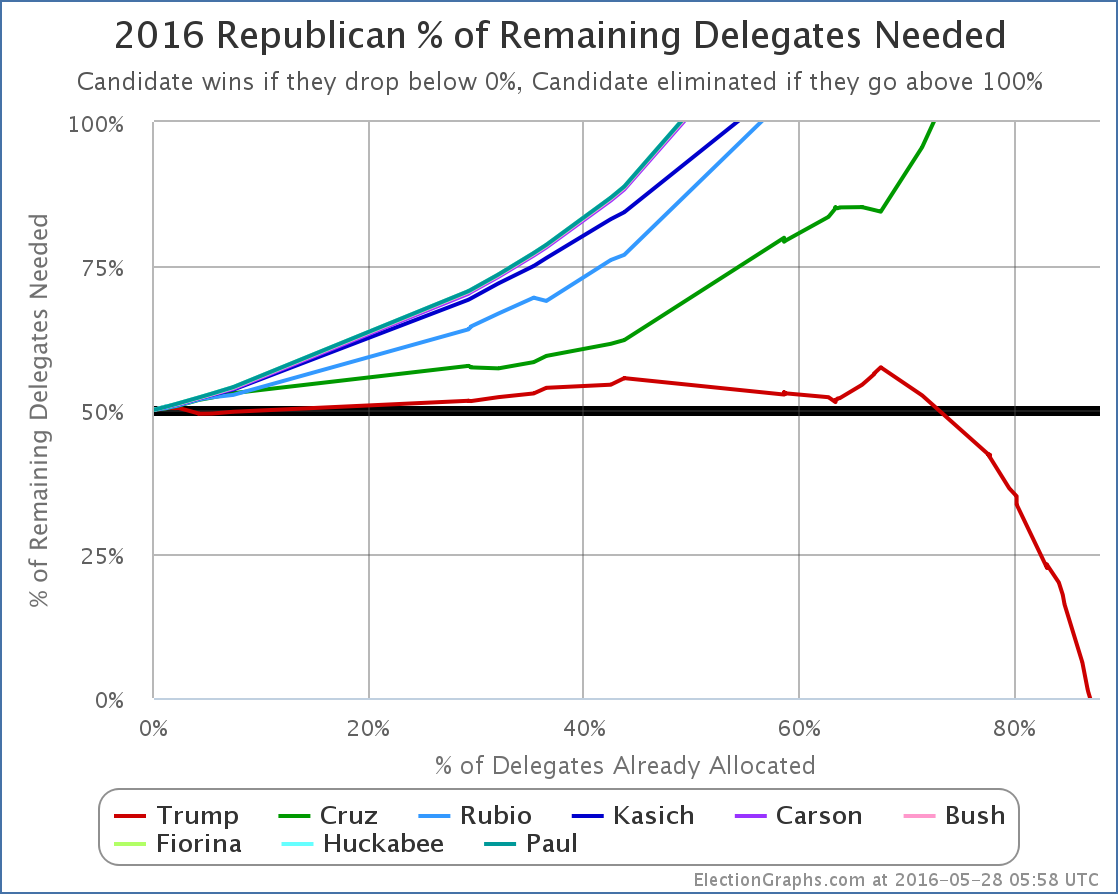
Trump hovered just over 50% for most of the race, but essentially as soon as Cruz was mathematically eliminated, Trump dropped below 50% needed, and rapidly raced to the conclusion. This was of course aided by Cruz and Kasich dropping out, but even if they hadn’t, the writing was on the wall. It would have taken a huge effort with a groundswell of popular support for his opponents to prevent Trump from getting to 1237 at that point, and it was obvious that neither the political will, or the voters for Cruz or Kasich were there. And so it ended.
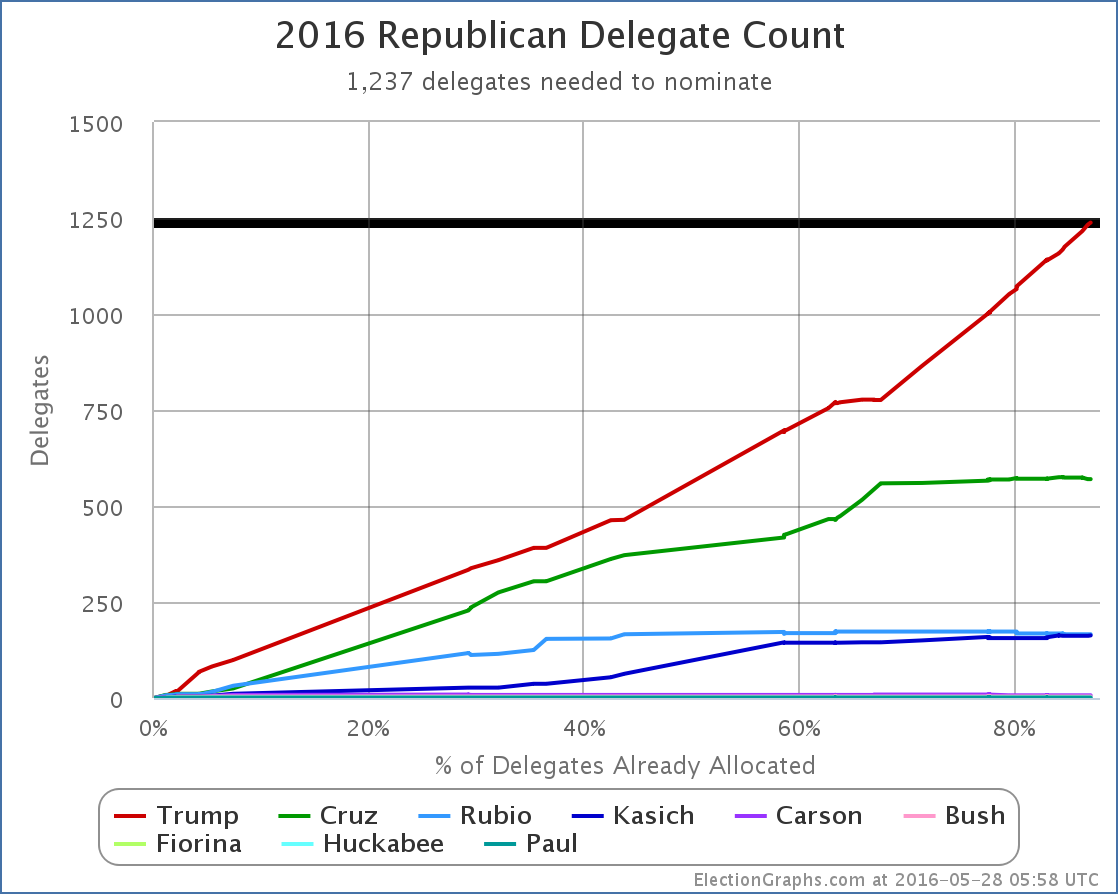
At this point the delegate count is Trump 1238, Cruz 570, Rubio 166, Kasich 163, Carson 7, Bush 4, Fiorina 1, Huckabee 1, Paul 1.
Trump will of course collect more before things are done. There is a chance others may pick up a handful too, but if they do it will be insignificant, and it is quite possible Trump will sweep the remaining delegates.
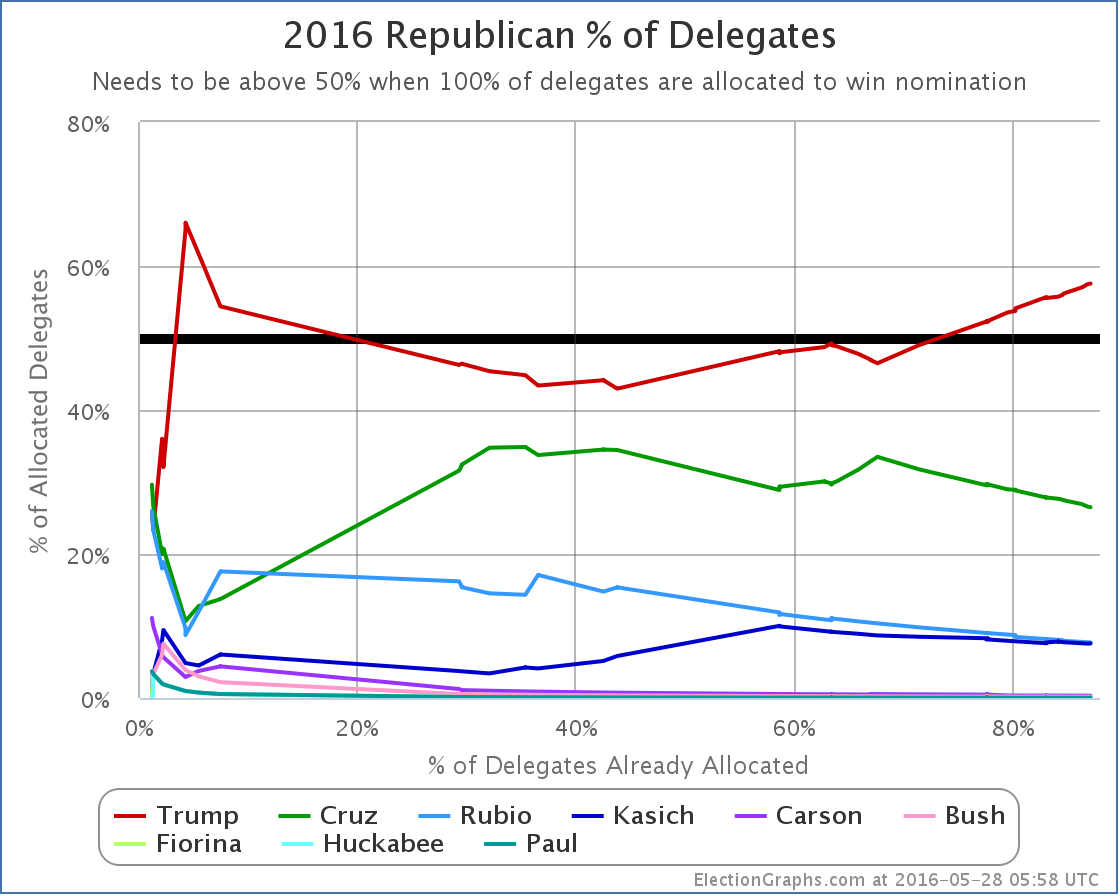
At this point Trump has 57.55% of the delegates. Cruz was next at 26.50%. Trump’s percentage will increase before we are done with all the delegate allocation.
Election Graphs will continue to monitor the delegate totals from the last few races for completeness, but for all intents and purposes the Republican race is now done. This has been the craziest oddball primary race in many decades. It has been fascinating to watch it play out.
Trump led from New Hampshire onward. From that point forward nobody ever came close. Until we got to the Northeast states though, the others were getting a high enough percentage to keep the possibility of blocking him alive, with the odds of Trump not getting to 1237 as high as 36% as late as April 18th according to the best simulations. (My gut feel had it higher, at 60%, but the numeric simulations were a better guide.) Now, that still meant Trump was probably going to get to 1237, but there was a decent shot at stopping it.
But then the anti-Trump forces essentially collapsed and gave up. It is just too hard to make the case that people should vote for you in order to help stop someone else, even after it is very clear you can’t win yourself. In my Curmudgeon’s Corner 2016 predictions show I essentially predicted exactly that. But in the heated days of March and April, I allowed myself to get a little too excited about the news nerd’s dream of a contested convention, as did a lot of people looking at the race. In the end though, it is really hard to stop someone who has led from beginning to end.
And so we have Trump.
It has been a lot of fun watching this primary process play out. The Democratic side should be winding up very shortly as well.
And then it is full speed ahead to the general election. If you have enjoyed my coverage of the Republican delegate race, I hope you’ll stay around for the Electoral College analysis.
164.7 days until polls start to close on the general election. The next few months will be quite a ride. Stay tuned!
* For those who want the specifics, in the last few days there were updates to the preferences from uncommitted delegates in North Dakota, Oklahoma, Colorado, Pennsylvania, the Virgin Islands, and Louisiana. Added up, the net change was Trump +23, Kasich +1, Cruz -3.
Update 2016-05-30 16:44 UTC – Change from Colorado: Trump +1, Cruz -1.
Update 2016-06-03 14:40 UTC – Change from Oregon: Trump -1, Kasich +1.
Note: This post is an update based on the data on ElectionGraphs.com. Election Graphs tracks both a poll based estimate of the Electoral College and a numbers based look at the Delegate Races. All of the charts and graphs seen in this post are from that site. Additional graphs, charts and raw data can be found there. All charts above are clickable to go to the current version of the detail page the chart is from, which may contain more up to date information than the snapshots on this page, which were current as of the time of this post. Follow @ElectionGraphs on Twitter or like Election Graphs on Facebook to see announcements of updates or to join the conversation. For those interested in individual general election poll updates, follow @ElecCollPolls on Twitter for all the polls as they are added.
Edit 14:00 UTC to add the * with the delegate changes from the last few days.
Edit 2016-06-04 04:04 UTC to fix the title from Electoral College to Republicans. Sigh.
This week on Curmudgeon’s Corner Sam and Ivan are back into the swing of things with most of the show covering Election 2016. What does Sanders want at this point? What about that Trump surge in the polls? How about all the other Trump stuff this week? But they cover a few other things too, from Sam’s latest travel adventures, to bathroom laws, to the EgyptAir crash, to Obama in Hiroshima, and more.
Click below to listen or subscribe… then let us know your own thoughts!

Recorded 2016-05-26
Length this week – 2:01:45
 1-Click Subscribe in iTunes 1-Click Subscribe in iTunes
 View Podcast in iTunes View Podcast in iTunes
 View Raw Podcast Feed View Raw Podcast Feed
 Download MP3 File Download MP3 File
 Follow the podcast on Facebook Follow the podcast on Facebook
Show Details:
- (0:00:10-0:23:40) But First
- Sam Travel
- Agenda
- Computer Upgrades
- Changing Buildings
- (0:24:25-0:45:17) Interview Show Followup
- Missing Views
- Ivan confused by Michael from Pennsylvania
- Fiscally Conservative Republicans?
- (0:46:26-1:02:49) Election 2016 – Democrats
- What does Sanders want? – Platform
- What does Sanders want? – Relevance
- What does Sanders want? – DWS’s Head
- What does Sanders want? – Rules changes
- When does Sanders fold?
- (1:03:53-1:31:24) Election 2016 – Republicans
- Trump surge in national polls
- Trump/Ryan dance
- Trump Supreme Court List
- Trump and 90’s Clinton Scandals
- Anti-Trump Strategies
- Trump’s Odds
- (1:32:39-2:01:25) Lightning Round
- Clinton’s Email
- Election Graphs Commenters
- Bathroom Laws
- Violent Protestors
- EgyptAir Plane
- Obama Hiroshima Visit
- Thiel vs Gawker
- 1000 likes for Election Graphs
Now that the nominees are essentially certain, state level general election polling is ramping up quickly. It has only been a few days since the last update to my electoral college models, but there have already been polls in New Jersey, Virginia, North Carolina, California, Ohio, and Wisconsin. But of these, it was the new poll in North Carolina that made a difference.
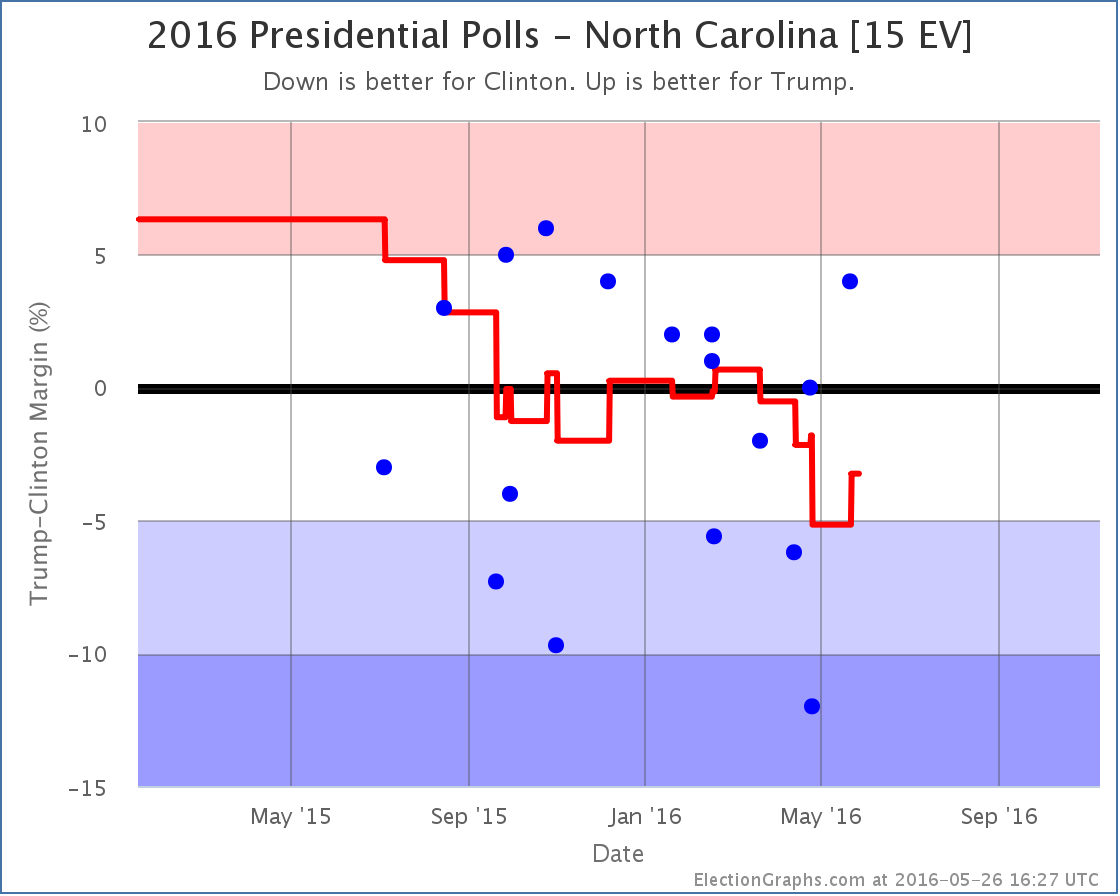
Trump gets his best individual poll result in North Carolina since last December, and the poll average moves from a Clinton lead of 5.2% to a Clinton lead of only 3.2%. With North Carolina once again within reach, Trump’s best case improves:
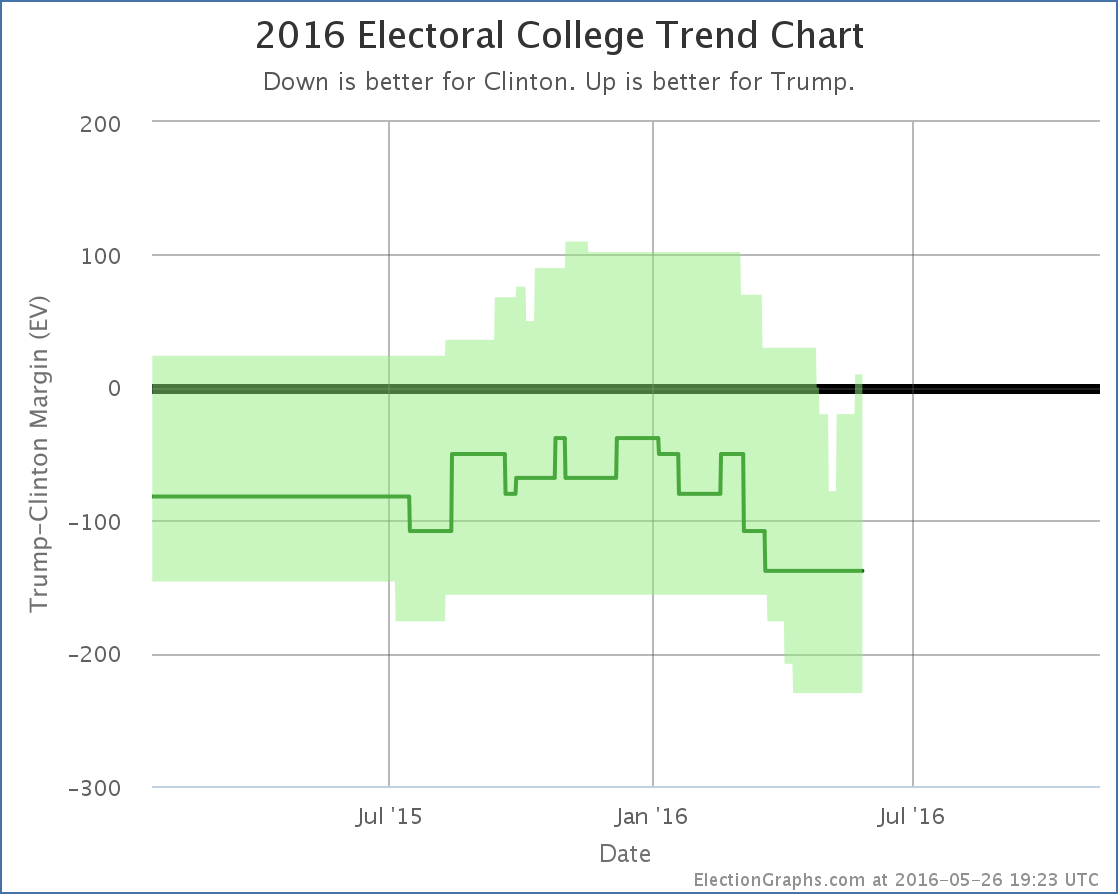
Now if Trump wins all the states he leads, plus all the states where Clinton’s lead is less than 5%, he squeaks out a 10 electoral vote win. Between this and Florida, this puts him back on the plus side for his “best case” after just under a month where even this rosy scenario was underwater for him.
Since North Carolina had been the tipping point, that metric also moves:
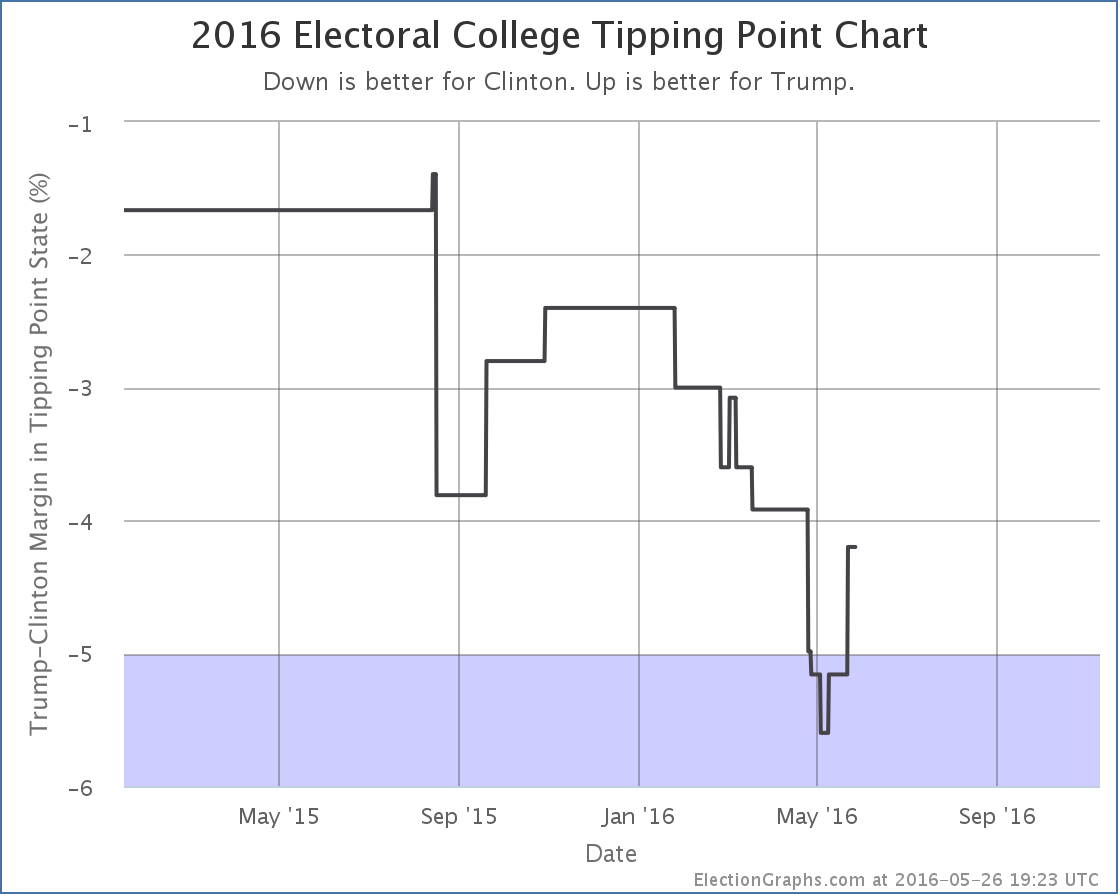
The tipping point state is now Florida, where Clinton leads by 4.2%.
From January to the beginning of May, there were 12 changes to the “bubble” and 8 changes to the tipping point. Only one of each category was in Trump’s direction. Overwhelmingly those months were a story of Trump’s position against Clinton deteriorating.
Since then we have two bubble changes and two tipping point changes, but all four have been moves in Trump’s direction. It is certainly looking like Trump hit bottom and is now bouncing back. The question is of course how far he bounces, and how long it lasts.
165.4 days until the polls start to close on election night.
Note: This post is an update based on the data on ElectionGraphs.com. Election Graphs tracks both a poll based estimate of the Electoral College and a numbers based look at the Delegate Races. All of the charts and graphs seen in this post are from that site. Additional graphs, charts and raw data can be found there. All charts above are clickable to go to the current version of the detail page the chart is from, which may contain more up to date information than the snapshots on this page, which were current as of the time of this post. Follow @ElectionGraphs on Twitter or like Election Graphs on Facebook to see announcements of updates or to join the conversation. For those interested in individual general election poll updates, follow @ElecCollPolls on Twitter for all the polls as they are added.
Edit 23:36 UTC to adjust sentence order in the first paragraph.
With the final results all but inevitable, these updates will be somewhat mechanical absent something unexpected happening.
After Oregon, Trump needed 18.13% of the remaining delegates to win.
In Washington, Trump got 41 of 44 delegates. Nobody else got those last three, they will be officially uncommitted. No word yet on who those three delegates actually are and who they will support.
Also since the initial post on Oregon, updates there moved one delegate from Kasich to Cruz, plus an update in the Virgin Islands moved all but one uncommitted delegate there to Trump. Between these two places, the net change was Trump +7, Kasich -1, Rubio -2.
So total change since Oregon: Trump +48, Kasich -1, Rubio -2.
So Trump got over 100% of the new delegates since Oregon, since he got all of the actual new delegates, plus stole some from the others.
Updated graphs:
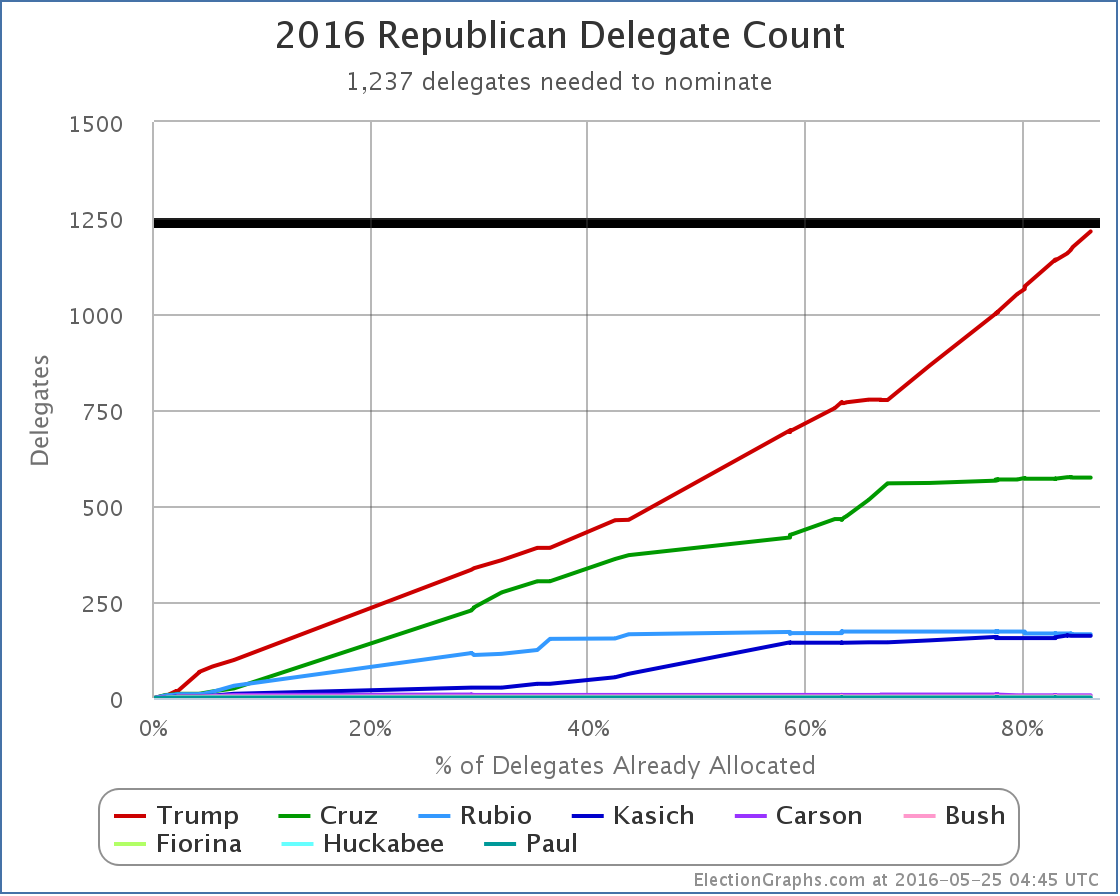
New delegate totals: Trump 1215, Cruz 574, Rubio 166, Kasich 162, Carson 7, Bush 4, Fiorina 1, Huckabee 1, Paul 1.
There are 341 delegates left. Trump only needs 22 of them.
As a note, there are currently 32 uncommitted delegates who have not yet expressed a preference by my count. There doesn’t seem to be an effort going on to push these folks to do so, but we’re now at the point where these uncommitted delegates could push Trump over the edge at any time if a bunch of them were to come out and say they were supporting him.
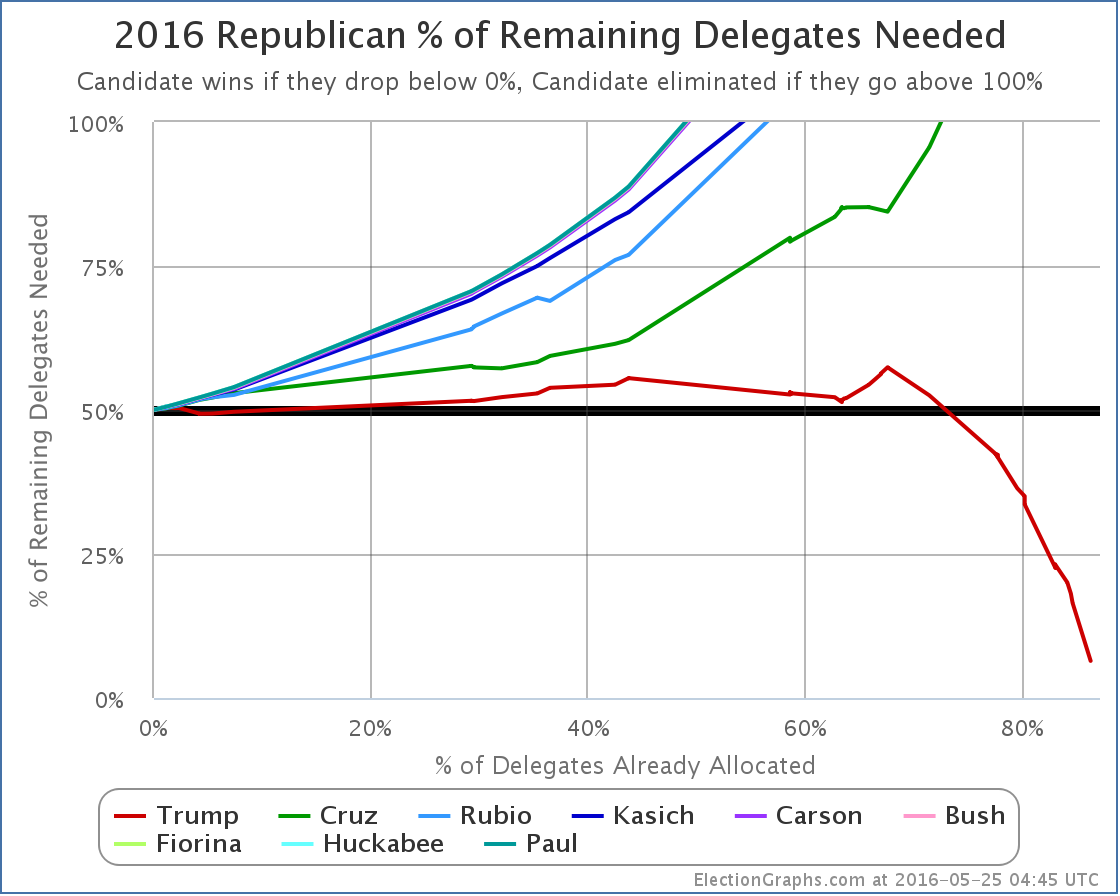
Trump now needs 6.45% of the remaining delegates to win.
That could be done with the uncommitted delegates sooner, but it is most probable this will come shortly after New Jersey closes their polls on June 7th. It is unlikely we will need to wait for the four Western states whose polls close later that evening.
Update 2016-05-26 14:51 UTC – AP says they have found enough uncommitted delegates to put Trump over 1237. I’ll update totals here as I get information on specific uncommitted delegates and state counts. Depending on how forthcoming AP is with the list of actual delegates that told them they support Trump, I may or may not be able to confirm 22 more uncommitted delegates before June 7th when the pledged delegates should push Trump over the edge anyway.
Update 2016-05-28 05:29 UTC – Uncommitted delegate update: Trump +20, Kasich +1, Cruz -3. I’ve done my best using all my usual sources to match AP’s conclusion. So far I have only been able to get up to Trump 1235… two delegates short… AP called various of these uncommitted delegates to get their count, but only released the totals and a few of the names, not all of the names, so it is impossible to confirm their total delegate by delegate. I’ll keep looking for more info on the remaining 18 uncommitted delegates on my list. If I find the remaining two before the next votes on June 7th, I’ll of course update.
Update 2016-05-28 05:54 UTC – I kept searching, and eventually found 3 more Trump delegates. That puts Trump at 1238 and therefore over the top. New blog post from me soon.
Note: This post is an update based on the data on ElectionGraphs.com. Election Graphs tracks both a poll based estimate of the Electoral College and a numbers based look at the Delegate Races. All of the charts and graphs seen in this post are from that site. Additional graphs, charts and raw data can be found there. All charts above are clickable to go to the current version of the detail page the chart is from, which may contain more up to date information than the snapshots on this page, which were current as of the time of this post. Follow @ElectionGraphs on Twitter or like Election Graphs on Facebook to see announcements of updates or to join the conversation. For those interested in individual general election poll updates, follow @ElecCollPolls on Twitter for all the polls as they are added.
Edit 15:21 to not imply the Virgin Islands are a state.
Edit 2016-05-28 13:57: Corrected the Trump delegate update not he first 2016-05-28 update to be Trump +20. The 1235 at that point was correct. I’d missed counting two Louisiana delegates in the delta.
|
|
![]() 1-Click Subscribe in iTunes
1-Click Subscribe in iTunes![]() View Podcast in iTunes
View Podcast in iTunes![]() View Raw Podcast Feed
View Raw Podcast Feed![]() Download MP3 File
Download MP3 File![]() Follow the podcast on Facebook
Follow the podcast on Facebook


