Although the frequency has slowed, I still occasionally get people asking how I am sleeping what with a baby in the house and all, and everything everybody always says about no sleep when there is a new baby. I’ve been meaning for a long time to post about this, since at least October, but am just now getting around to it. Anyway, because I am certifiable and track everything, I can give some quantitative answers to the sleep question.
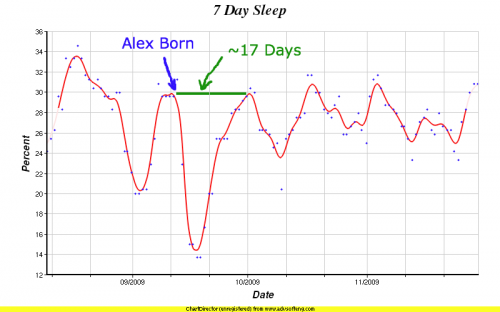
Here is a relevant chart:
This is a chart with daily values of the percent of the previous seven days I spent asleep. (Click the chart for a larger version.)
Unfortunately I did not start tracking this number until August even though I had the capability to do so earlier. If I had started earlier we would have had a better baseline to do a longer term before and after comparison. In this chart I have used the smoothing factor for the trend line that I usually use for my one month charts, rather than what I would normally use to show the amount of time shown here. This allows me to show a little more responsiveness in the trend line to short term changes. For a current chart with my normal smoothing values, see here.
Anyway, if one looks at how much sleep I was getting immediately before Alex was born, it is at about the 30% level. That would be about 7.2 hours per day of sleep. You can clearly see the deep dive down to about 14% (about 3.4 hours per day). But this does not last very long. 17 days later I recover to the immediate pre-Alex level. Of course I don’t stay there for long. You can see I move up and down between about 24% (about 5.8 hours a day) and 31% (about 7.4 hours a day). If I had to hazard a visual guess at an average for October and beyond, I’d say about 27% (about 6.5 hours per day).
Because I only have the month or so of pre-Alex data though, it is hard to see if there is a distinct before and after longer term change. As you can see, I did have a pre-Alex peak of 34% (about 8.2 hours per day) that has not yet been equaled. But it impossible to say if that was an abnormal peak. Also, there was a dip down to 20% (about 4.8 hours per day) at one point when I was staying up late on a couple of personal projects. So the “normal” range may have been pretty wide to begin with.
So the 17 day “back to normal” recovery time is probably about the best estimate that can be made with this data. I’m still annoyed for not having tracked this metric for longer. I had the ability to do so starting approximately in February, but I didn’t. Oh well.
Now, this does show however that aside from the one peak in August, I’ve never been close to the 33% (8 hours a day) generally recommended sleep level, and I’m not very consistent at all in terms of how much I sleep. Oh well. I doubt I’m really all that atypical on that front, although I must admit I would probably enjoy it if I could get and keep my average closer to that 33% level.
Finally, and this is an important point, this is MY recovery time… but BRANDY was the almost exclusive source of food and was the one that was almost always the one who got up and stayed up nights with Alex when needed. So HER chart would look vastly different, and her sleep recovery time much longer, if it has even recovered yet. I can’t show any graphs of that though, as Brandy won’t let me hook her up to machines to monitor her at night. I have no idea why. :-)

