There has been polling going on about the 2016 election since the 2012 election. (Actually, earlier, the first state level 2016 matchup poll in my database is from May 2012.) For most of that timeframe, the pollsters have been polling people who they deemed likely to run. Candidates were not for the most part outright declaring their intentions one way or another, and even when they seemed to, sometimes they were not believed.
That is now changing rapidly. While “formal” announcements that candidates are running 100% for sure for realsies may yet be a little further out, we now have candidates being pretty explicit that they are “exploring the possibility” or “considering” or whatnot, and we have a few that are being more and more definitive that they will not be running. Now, many of the people who are looking like they are running may decide not to after all before we get to the Iowa caucuses. And some of the ones saying they won’t run may change their minds. But we are starting to get a much better sense of who is in and who is out.
So, for instance, in the last couple weeks, we’ve had Romney making strong moves indicating he is in, while Ryan has stated that he has decided not to run. So why does the top of my 2016 Electoral College Analysis look like this?
Clinton vs Ryan is listed right there, but Clinton vs Romney is not. Why is this? Ryan is not running, shouldn’t he be dropped? Romney looks like he is running, and a number of polls on the Republican nomination show him in the lead at the moment, shouldn’t he be here?
The short answer is that I show the five “best polled” candidate combinations at the top of the page, and there is a lot of polling on Clinton vs Ryan (52 state level polls in my database) while there have been very few so far on Clinton vs Romney (only 4 state level polls in my database).
As pollsters start deciding to poll Clinton vs Romney more, and Clinton vs Ryan less (or not at all), this list of the five best polled combinations will update automatically and Clinton vs Ryan will drop off and Clinton vs Romney will very likely move onto this list. I choose not to hand edit this list by who seems to up or down in the primary polls at the moment, instead, I’ll let the fact that pollsters will show more interest in candidates that seem more likely to win take care of that. But it will take a little time for that to catch up, since actual polls have to be done first.
Of course, I also provide the drop downs, so anybody who wants to see any combination at all can go look. But the top five really are the ones that have decent polling, and beyond that there really isn’t a lot to see.
(Note: Once we actually get to the primaries and caucuses and have actual delegate counts, I will probably keep the five “best polled” list, but instead of defaulting to the best polled combination in terms of what I show on the rest of the page, I’d default to the delegate leaders in both parties… probably. Of course, there is a good chance these will match.)
Now, even for most of you who have already read the above, this is probably enough information. You can consider yourselves done now…
OK… for those few of you (if any) that want more detail and are still here…
I am trying to show the “best polled” combinations, which isn’t necessarily the same as the “most polled”. There are a number of ways one could calculate this, and none are perfect. I chose one way in particular, and it isn’t perfect either, and it certainly has its flaws, but it does the job well enough for these purposes.
Namely, my whole site is based on looking at a “5 poll average” for each candidate pair in each state. In certain cases this can actually include more than 5 polls to break various sorts of ties I care about. But these polls cover a certain amount of time.
For instance, right now if you look at Clinton vs Paul in North Carolina you’ll see that the average currently include five polls, which span the last 5.0 months. (The oldest poll in the average is from August 16th, just about 5 months ago as I’m making this post.)
As a contrast, if you look at Cuomo vs Perry in Vermont you’ll see that it has NEVER been polled, which means I pull in the last five general elections in Vermont as an approximation. That means the oldest data included in the average here is from November 6th 1996, so the average goes back 18.2 years.
States where this timespan is low are better polled than those where it is high. By the time we get to the election in 2016, I expect to see many close states with timespans measured in days.
But, if 2008 and 2012 are guides, some of the less contentious states may not get polled at all, or maybe just have one poll in the whole cycle. After all, everyone knows the Democrat is going to win DC by a huge margin, and the Republican is going to win Nebraska’s 3rd congressional district by a huge margin, and there aren’t that many electoral votes there either, so why bother?
Given that polling is concentrated in close states (and to some degree in big states even if they aren’t particularly close) and close states matter a lot more if you are trying to determine the electoral college outcome, I didn’t want to just average the timeframes of the 50 states (plus DC and 5 congressional districts).
So I decided to do a weighted average of the timeframes, weighted by the inverse of the absolute value of the margin. Since my method doesn’t allow exact ties in the averages, I don’t have to worry about division by zero, although really close states will have a very strong influence on the average.
So, for example, a really close state with a margin of 0.1% would get a weight of 1000, while something like DC (average margin of 80.3% over the last five presidential elections) would only get a weight of about 1.2. Using these weights, I construct an average of the 56 jurisdictions with electoral votes.
There is also the possibility of further weighting this by electoral college strength, I didn’t do that though. Isn’t this already complicated enough to explain?
In any case, from this you get a number from which you can compare how well various candidate pairs have been polled so far. Lets look at this for the top 25 candidate pairs:
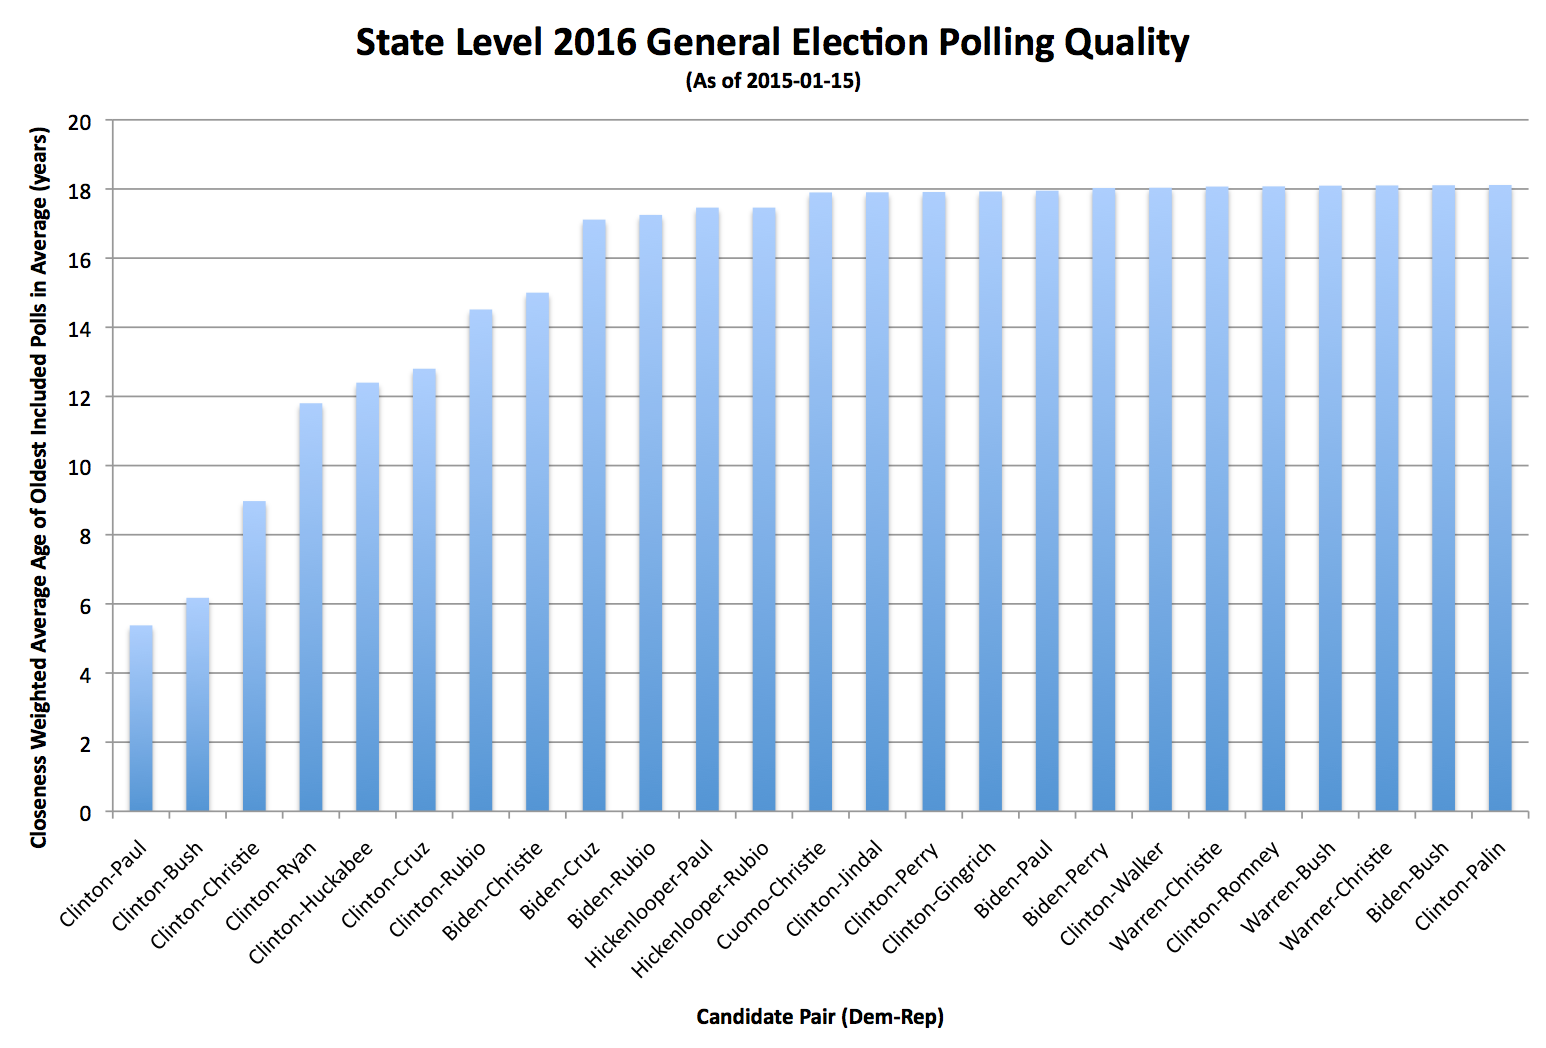 Click through on the image for a bigger version if desired.
The lower this number is, the better polled the combination has been. Candidate combinations that have not been polled at all will show up at 18.2 years at the moment.
You can see that Clinton vs Paul is best polled (5.4 years), with Clinton vs Bush right behind (6.2 years). Then we have a gap until Clinton vs Christie (9.0 years). Then another gap before Clinton vs Ryan (11.8 years), Huckabee (12.4 years) and Cruz (12.8 years). At this point we’re past the top five and you can tell we’re relying quite a lot on old elections and less and less on actual polling of these candidates.
The first non-Clinton combination comes in at #8: Biden vs Christie (15.0 years).
Where is Clinton vs Romney in this? #21. 18.1 years. Just BARELY better than no polling at all.
Hickenlooper vs Rubio has better polling by this metric than Clinton vs Romney. (#11, 17.5 years).
Looking at specific polls, there is only ONE poll for Hickenlooper vs Rubio, but it is in Colorado where the margin is 0.7%. Clinton vs Romney has been polled once each in New Jersey (margin 14.6%), New Hampshire (margin 3.3%), Iowa (margin 2.8%) and Florida (margin 1.1%). While some of those are close, they are less close, so lower weight is given to those.
There are NO states where Clinton vs Romney has a full five poll average (that would of course be impossible with only four polls).
By contrast, Clinton vs Paul has full five poll averages not including any old general election results in New Jersey (Clinton+22.4%), Pennsylvania (Clinton+12.6%), Florida (Clinton+11.3%), Virginia (Clinton+10.6%), Ohio (Clinton+8.8%), Michigan (Clinton+8.6%), New Hampshire (Clinton+6.1%), Iowa (Clinton+5.7%), North Carolina (Clinton+0.2%), Colorado (Paul+2.0%), Kentucky (Paul+4.2%), Kansas (Paul+6.8%) and Alaska (Paul+7.4%).
Bottom line, we can’t say much about a Clinton vs Romney matchup on a state by state level yet, there just hasn’t been enough polling yet. That will probably change rapidly over the next few months if Romney goes all in. And Ryan will fall off. And the “top five” list will otherwise adjust appropriately to changes in the field.
If you do look at Clinton vs Romney you will of course see something. The little polling there is has improved Romney’s “best case” from winning by 24 electoral votes to winning by 44 electoral votes. In this, he does better than any of the Republicans currently in the Top 5 best polled… but it is based on so little data, it is too early to make anything of it at all. You are still basically looking at the last five presidential elections, not any real Clinton vs Romney trend.
This is why I show only the Top 5 as highlighted combinations. Polling quality drops off very quickly, once you get much beyond that, you’re not looking at real data yet. This is also why while all changes will show up in the @ElecCollPolls twitter feed, I’ll only be posting analysis here when something significant changes in the status of one of the top five candidate combinations.
Well, not counting this post. :-) But I wanted to explain why Ryan is showing up, while Romney is not, and why even if we start getting some status changes in states for Clinton vs Romney, I most likely won’t start talking about them much until that combination has enough polls to show up on the top five best polled. Until then, we don’t really have a decent picture of what is going on in this sort of state poll based analysis.
Edit 22:15 to add more links and to change the “Clinton vs Romney has lower quality polling than” example from Hickenlooper vs Paul to Hickenlooper vs Rubio, so I would have an example that didn’t include any candidate showing up in the top five pairings.
Edit 2015-01-17 22:30 to correct Clinton vs Paul results in Colorado. It is Paul+2.0%, not Clinton+2.0% as previously stated.

