This is the website of Abulsme Noibatno Itramne (also known as Sam Minter).
Posts here are rare these days. For current stuff, follow me on Mastodon
|
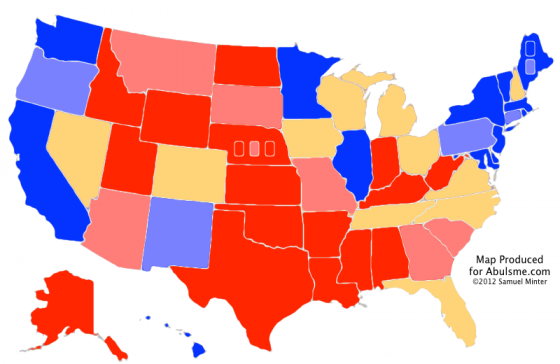
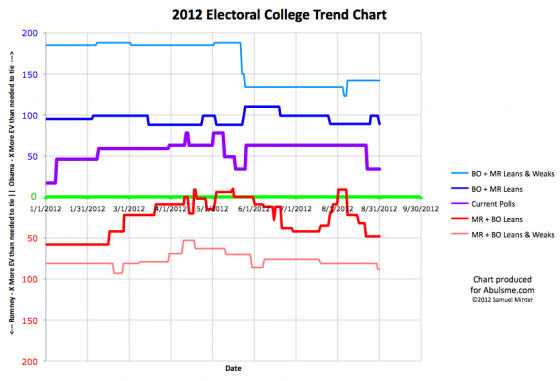
One update today, and it is Missouri reversing the move it made on the 25th:
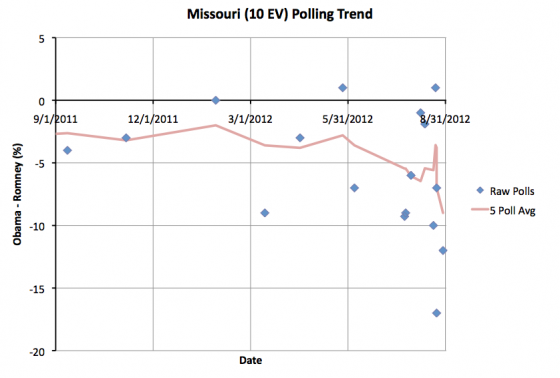
As you can see, polling in Missouri lately has been a bit, uh, wild. The last five polls, which only go back about a week and a half, have ranged from an Obama lead of 1%, to a Romney lead of 17%. That is just all over the place. I’m not sure that public opinion is really swinging quite so much so fast and there is something odd with the polls instead, but we have what we have. Before the two new polls I added today, the five poll average had a Romney lead of 3.8%. The two new polls were very good for Romney and we are now up to a Romney lead of a full 9%!
This is a very quick moment in Romney’s direction. I guess if there was indeed any movement away from the Democrats due to Akin, the backlash is now in full effect. Most of the last year Romney has been ahead in Missouri, but not by much. If the trend of the last few polls holds up, it looks like Obama’s support in Missouri pretty much collapsed and the state may even be heading toward my “Strong Romney” category.
With the polling as all over the place though, I’d reserve judgement on that. The next polls may move in the opposite direction. For the moment though, Missouri is very much in the “Weak Romney” category, meaning Romney has a pretty substantial advantage there, but not so large that he can feel safe completely ignoring the state.
This change once again reduces Obama’s best case:
|
Romney |
Obama |
| Romney Best Case |
317 |
221 |
| Current Status |
235 |
303 |
| Obama Best Case |
180 |
358 |
This means that even in his best case, Obama can’t reach his 365 to 173 victory margin from 2008. Even though Romney has had a good month in our models, Obama is still ahead… but the margins from 2008 are veery unlikely. This will be closer than 2008 unless something dramatic changes.
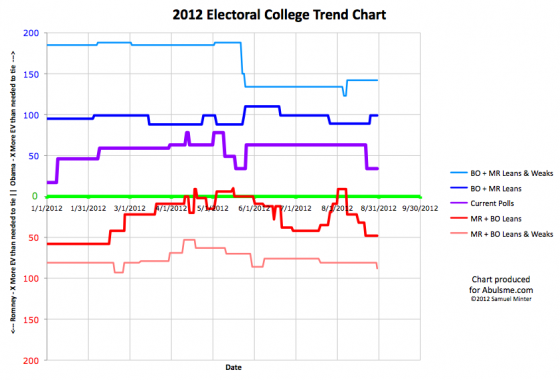
Note: Chart and map from the Abulsme.com 2012 Electoral College Prediction page. Both assume Obama vs Romney with no strong third party candidate and show polling as it currently exists. Things will change before election day. On the map red is Romney, blue is Obama, gold states are too close to call. Lines on the chart represent how many more electoral votes a candidate would have than is needed to tie under several different scenarios. Up is good for Obama, Down is good for Romney.
Edit 2012 Sep 6 09:34 UTC to add final note.
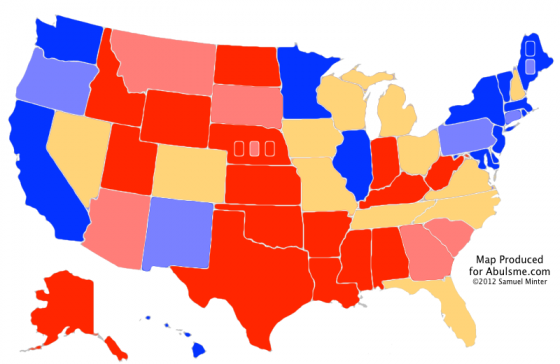
One state changing status today, and that is Connecticut, where Obama’s lead has diminished:
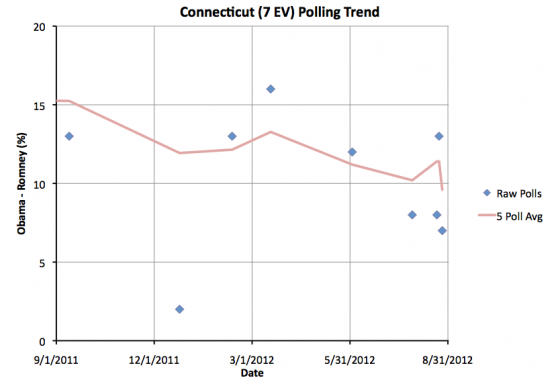
Connecticut has been fairly sparsely polled, being generally considered to be a pretty safe Obama state. But there have been a few new polls recently, and they have shown Obama’s lead somewhat diminished from the levels it had been at most of the last year. With today’s update, Obama’s lead in the five poll average drops to 9.6%.
Now, that is still a pretty substantial lead, but it moves Connecticut from my “Strong Obama” category to my “Weak Obama” category. In general, this represents states where the candidate has a definite lead, but not so large a lead that it is safe to ignore the state. The right set of events could potentially reduce the lead further and make the state competitive.
Having said that, it would take a pretty substantial change in the dynamics of the race to make Connecticut competitive, so that is not expected. But the slow deterioration of Obama’s margin in the state may still be something to watch.
Since Connecticut neither is nor was a “too close to call” state, the three models I track do not change:
|
Romney |
Obama |
| Romney Best Case |
317 |
221 |
| Current Status |
235 |
303 |
| Obama Best Case |
170 |
368 |
Note: Chart and map from the Abulsme.com 2012 Electoral College Prediction page. Both assume Obama vs Romney with no strong third party candidate and show polling as it currently exists. Things will change before election day. On the map red is Romney, blue is Obama, gold states are too close to call. Lines on the chart represent how many more electoral votes a candidate would have than is needed to tie under several different scenarios. Up is good for Obama, Down is good for Romney.
Edit 2012 Sep 6 09:33 UTC to fix link in final note.
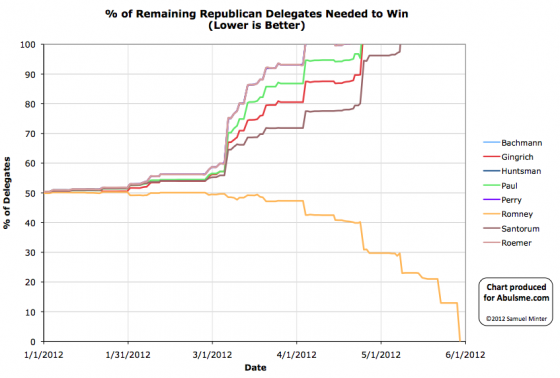
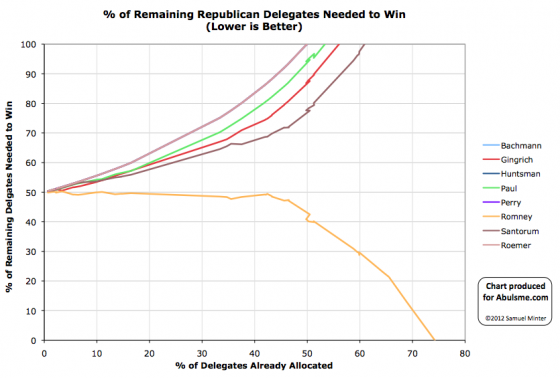
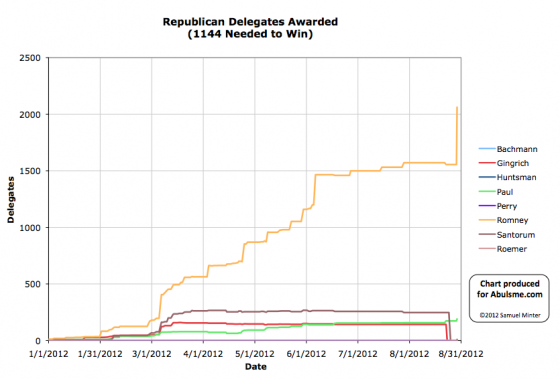
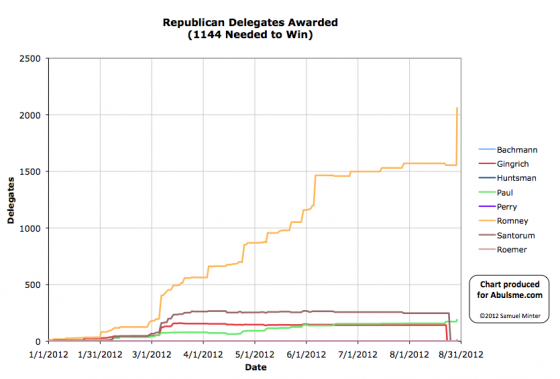
While there are still speeches yet to come, and a few more things my happen at the Republican National Convention, the actual nomination is now complete. The Republicans officially have a nominee. So time to review the final results of the delegate race.
| Stage |
Bachma. |
Gingri. |
Huntsm. |
Paul |
Perry |
Romney |
Santor. |
Roemer |
NV/U |
| Peak |
2 |
159 |
2 |
173 |
6 |
1571 |
268 |
0 |
|
| Final Est |
1 |
142 |
0 |
173 |
0 |
1555 |
247 |
0 |
168 |
| Roll Call |
1 |
0 |
1 |
190 |
0 |
2061 |
9 |
1 |
23 |
| Official |
0 |
0 |
0 |
0 |
0 |
2061 |
0 |
0 |
255 |
Peak represents the highest delegate estimate the candidate had during the primary season (not counting the final convention results).
The final estimates reflect the best estimates used here as of the “end” of the primary season. Specifically these is the estimate on August 22nd 2012, right before Gingrich and Santorum released their delegates. These released delegates were then free to vote for whoever they wanted in the Roll Call.
The roll call represents the count of the votes verbally given by the states at the Roll Call at the convention on August 28th 2012. (There were five votes in Pennsylvania that some reported as going to Paul Ryan, others have said the speaker said “Paul, Ron”. I believe these were intended for Ron Paul, so have counted them as such.)
The official count represents the vote as recorded by the convention. Romney was the only candidate who was officially nominated and seconded at the convention, so therefore was the only candidate who could officially receive votes and have them registered. Officially any votes for anybody else were equivalent to abstentions.
Lots more details on the final results of the full process can be found on the Results of the 2012 Republican Party presidential primaries page on Wikipedia, Green Papers (including totals), and DCW.
Note: Charts from the Abulsme.com 2012 Republican Delegate Count Graphs page. The first and second charts represent the % of remaining delegates the candidates needed in order to reach 1144 and win the nomination. Going above 100% represented being mathematically eliminated, dropping to 0% represented “clinching” the nomination. The first chart shows this by date, while the second shows this by % of the delegates determined so far. The third chart is the % of delegates the candidate has collected. The fourth is the actual number of delegates. These numbers include estimates of the eventual results of multi-stage caucus processes as those estimates were refined over time. The final data point represents the roll call count, not the official results which only counted votes for Romney.
[Edit 2012 Aug 29 14:59 to add two more charts and revise the final note.]
[Edit 2012 Aug 29 15:42 to add links to sources for more info.]
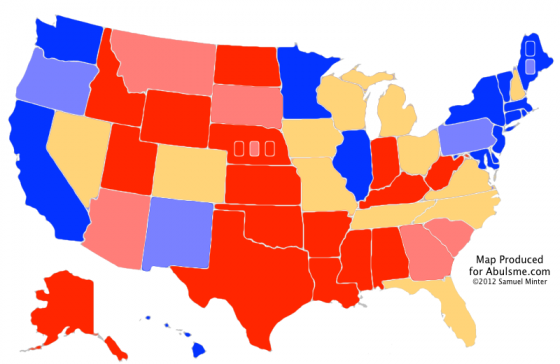
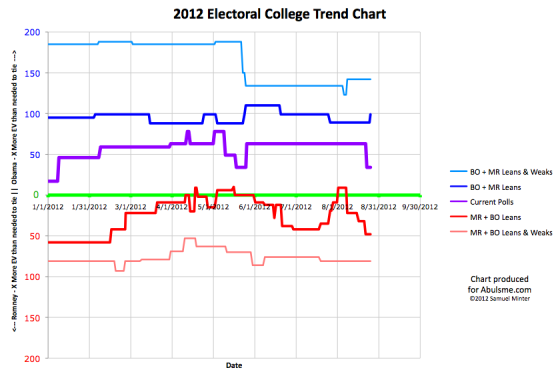
One change in this update, and for the first time in more than two weeks it is a move in Obama’s direction.
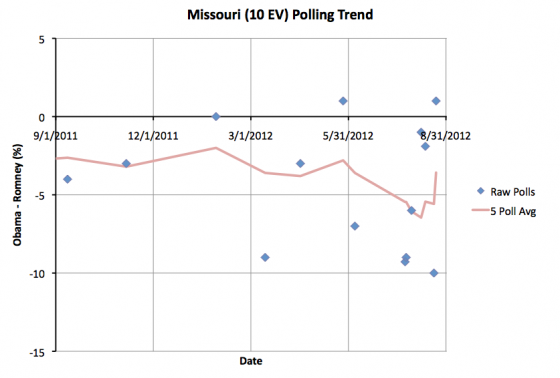
The state that moves this time is indeed Missouri (10 ev), the location of the recent dustup about comments made by Todd Akin. Could some of that be spilling into the presidential poll numbers? Well, I’d be reluctant to say that quite yet. Two of the five polls in the five poll average were taken after the incident last weekend. A PPP poll on the 20th showed Romney up 10% in Missouri. Then a Rasmussen poll on the 22nd showed Obama up 1%. Now, perhaps that was real movement caused by the coverage going on in those days. Or not. The two polls are just not enough to get a good grasp on that.
The addition of the latest poll does drop Romney’s lead in the state in my average to 3.6% though, which is enough to call the state close again. While Obama is still behind here, it is now close enough that putting some effort into trying to win it doesn’t seem completely unreasonable. Having said that, despite a few scattered polls showing Obama leads, Obama has never been ahead here in the five poll average. Obama winning Missouri is unlikely absent large moves nationally pushing toward an Obama landslide.
This does improve what I call Obama’s “best case”:
|
Romney |
Obama |
| Romney Best Case |
317 |
221 |
| Current Status |
235 |
303 |
| Obama Best Case |
170 |
368 |
Obama’s best case now actually exceeds his 2008 results (a 365 to 173 victory). This would require a sweep of all of the close states though, including the ones he is behind in at the moment. That would be Florida (29 ev), North Carolina (15 ev), Tennessee (11 ev) and Missouri (10 ev). In the five poll average at the moment, Romney is ahead by 3.5% in Florida, 0.6% in North Carolina, 4.2% in Tennessee and 3.6% in Missouri.
I’ve always said that a lead less than 5% can disappear overnight with the right events in the news, but still, it is hard to imagine at the moment the kind of news that would get Obama all four of these states.
Florida has bounced back and forth all year. It is easy to imagine it going either way.
North Carolina is more of a stretch. Obama has sometimes been in the lead there, but most of the time Romney has been. But maybe if things go very well for Obama he will manage North Carolina.
Tennessee and Missouri though? Obama has never been ahead in those states. Obama taking leads in either states would be indicative of a huge Romney collapse.
The Republican convention is starting in a few days though. So don’t expect many moves in Obama’s direction in the short term. Unless the convention is a huge disaster, it is much more likely we see more movement toward Romney from now until the Democratic Convention gets under way.
Note: Chart and map from the Abulsme.com 2012 Electoral College Prediction page. Both assume Obama vs Romney with no strong third party candidate and show polling as it currently exists. Things will change before election day. On the map red is Romney, blue is Obama, gold states are too close to call. Lines on the chart represent how many more electoral votes a candidate would have than is needed to tie under several different scenarios. Up is good for Obama, Down is good for Romney.
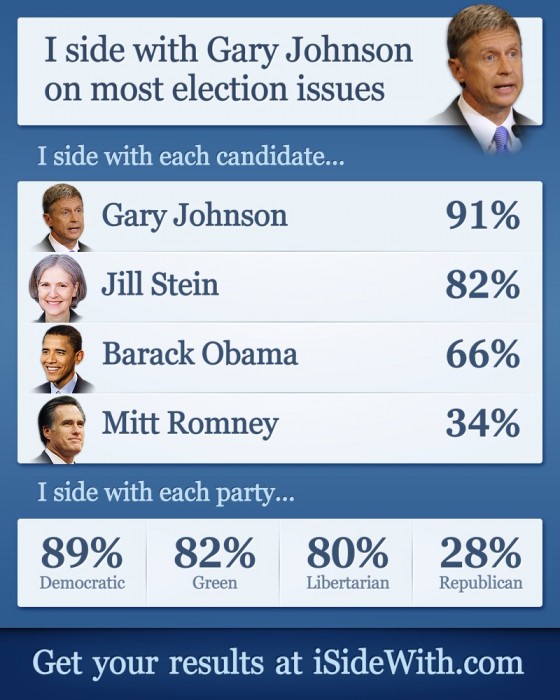
There are always a number of these sorts of quizzes floating around in election years. This is the first one I’ve taken this cycle.
I am not surprised by Gary Johnson at the top, or Mitt Romney at the bottom. Kinda surprised by how high Jill Stein ranked. Maybe I will spend more time looking at her than I’d planned. I’d previously considered this a Johnson/Obama race as far as my own vote was concerned. Romney was never in play for me. Not even close.
I’m also surprised though that even though Johnson is my best match of the candidates and their positions, in terms of the parties (I guess based on their platforms?) I match the Democrats much better than the Libertarians. Perhaps this is because officially the Democratic party platform is still against the kinds of human rights and civil liberties abuses Obama now embraces in the name of fighting terrorism. Meanwhile, officially the Libertarians endorse some stuff that is pretty divorced from reality, while Johnson is a bit more moderate. Dunno.
Of course, Washington State will go for Obama no matter how I vote unless things go very very wrong for Obama in the next couple of months. So my vote is basically just academic.
For anybody else wanting to take the quiz, it is here. Enjoy. Report back on your results. :-)
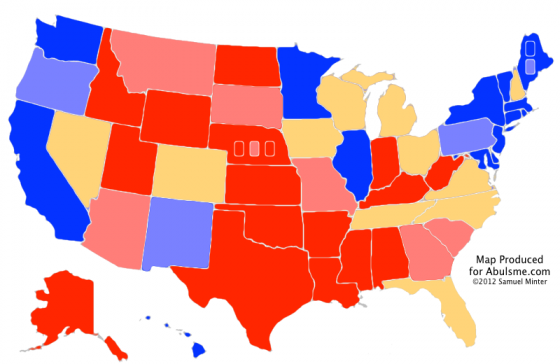
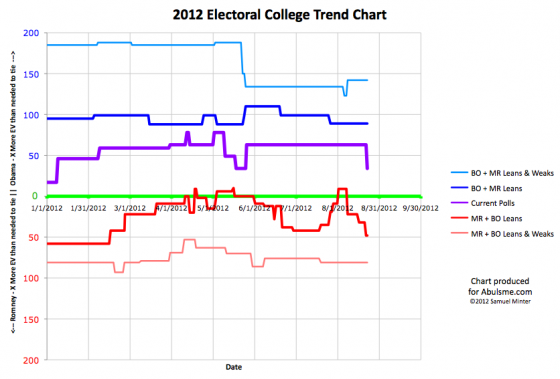
I mentioned yesterday that several states were right on the edge of tipping if things went Romney’s way. Right on cue, a couple new polls and the biggest one, Florida, flips over to Romney…
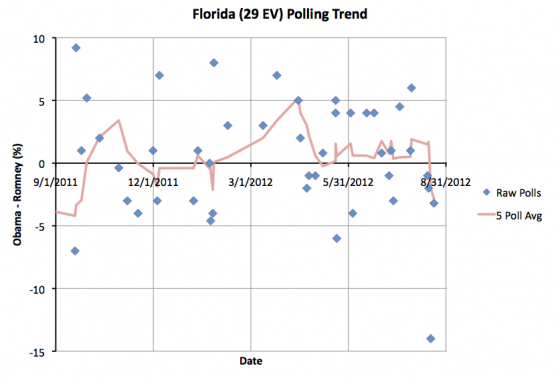
For the past few months Florida has been leaning toward Obama, but only by the slightest of margins. Now the five poll average shows a Romney lead in the state for the first time since May.
Now, I will point out that the poll that pushed the five poll average over the center line was one from Foster McCollum that some places are treating as an outlier and therefore are not including in their averages. It has Obama up by 14%. By comparison no other poll has shown a Romney lead of more than 5% since May, and the biggest lead Romney has shown in any Florida poll in the last YEAR is 7%. Nate Silver actually specifically discussed this poll and the problems with it and why some people are excluding it in a recent post.
For my models, if a poll turns up in any of my several sources, I use it. I do not do any specific outlier removal. I let the five poll average do what the five poll average does, and if you have an outlier, it will still be balanced by the other four polls in the average, and soon enough as new polls come in, it will age out of the average anyway. With this poll, Florida shows up in my average with a 2.8% Romney lead. If you excluded it, you would have an 0.2% Obama lead. Either way, the polling shows Florida is very very close and could go either way.
I do count it though, and this means the first change in the “Current” line in my model since May (the last time Florida flipped).
|
Romney |
Obama |
| Romney Best Case |
317 |
221 |
| Current Status |
235 |
303 |
| Obama Best Case |
180 |
358 |
This puts Romney back where he was in May in terms of the electoral college results if all the states vote according to current polling. That is, Obama wins 303 to 235. As I mentioned yesterday, in terms of his best case (where he wins all the close states and wins 317 to 221) this is the best position Romney has had since February.
Obama is still ahead in this race. But Romney has been gaining on him all month. Things look a lot closer now than they did a few weeks ago. And we’re about to head into convention week for the Republicans, so we should expect a further bounce toward Romney. (Although some analysts think it will be smaller than usual since so many people have already made up their minds.)
The things to watch will be if the bounce is wide spread enough and long lasting enough to actually put Romney in the lead for the electoral college for the first time ever. And if it does, can he keep any of those gains? The convention bounces are usually ephemeral and after the hubbub from both conventions die down, you end up pretty close to where you were before them.
Ohio (18 ev), Colorado (9 ev) and Iowa (6 ev) have Obama leads less than 2% at the moment. Will Romney pick off one of them next? If he is going to, the next couple of weeks are when you would expect it to happen first. So keep watching.
Note: Chart and map from the Abulsme.com 2012 Electoral College Prediction page. Both assume Obama vs Romney with no strong third party candidate and show polling as it currently exists. Things will change before election day. On the map red is Romney, blue is Obama, gold states are too close to call. Lines on the chart represent how many more electoral votes a candidate would have than is needed to tie under several different scenarios. Up is good for Obama, Down is good for Romney.
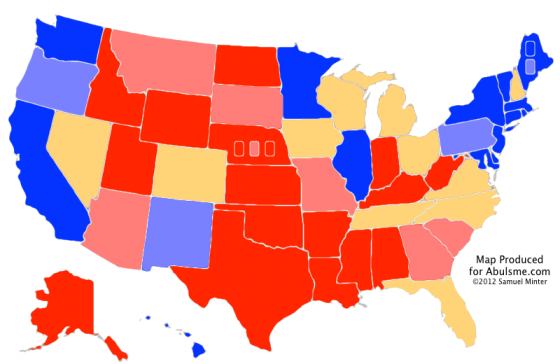
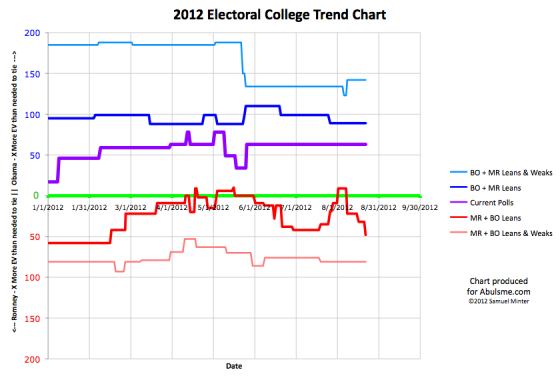
So, just as July was very bad for Romney, August has so far been very good for Romney. Today’s move is the state of Michigan, with 16 electoral votes:
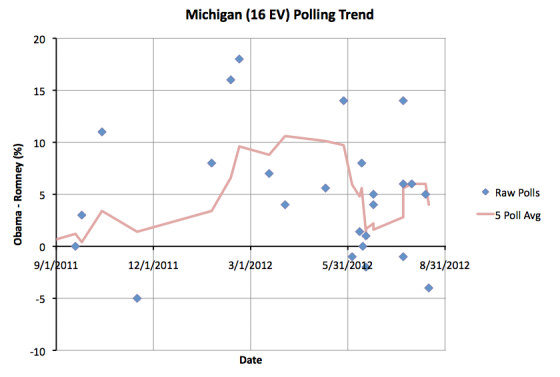
Over the course of the last year, Michigan has polled all over the place, ranging from Polls showing Romney ahead by 5%, to polls showing Obama ahead by 18%. A huge range. More recently the five poll average had an Obama lead of 6%. Today’s update pulls that down to 4%. Since that is below my 5% threshold, Michigan once again goes into the “could go either way” category. 4% is just a very slim lead that can disappear pretty easily with the back and forth of the news cycle. This of course improves Romney’s “Best Case” in my model:
|
Romney |
Obama |
| Romney Best Case |
317 |
221 |
| Current Status |
206 |
332 |
| Obama Best Case |
180 |
358 |
With this update, Romney’s “best case” (where he wins ALL the close states) is better than it has been since February. Over the past few weeks, he has diminished Obama’s lead in several critical states. The “current” line in my model, where each candidate wins all the states they are even slightly ahead in, has stubbornly stayed still at Obama 332 Romney 206 for almost three months now. But getting states close has to happen before states jump over the line.
There are now 9 states where Obama is ahead, but by less than a 5% margin… which can be considered very vulnerable. Of those Obama’s leads in Florida (29 ev), Ohio (18 ev), Virginia (13 ev), Colorado (9 ev) and Iowa (6 ev) are all actually less than *2%*. Those five states could really flip at almost the drop of a hat. They are right on the edge. That is 75 electoral votes right on the verge of going over to Romney’s side of the fence with a few positive news cycles for Romney. And guess what. Move those 75 votes to the other side and Romney wins 281 to 257.
Obama is still significantly ahead in the electoral college analysis at the moment. And Romney has never been ahead in this analysis. But the above serves to show just how quickly things can change. Over the last few weeks things have moved quite nicely in Romney’s direction and there are a lot of states that could easily move further.
This isn’t even close to over yet. The amount of time left is getting shorter all the time, but if Romney keeps things moving in this direction, this could get very interesting!
Note: Chart and map from the Abulsme.com 2012 Electoral College Prediction page. Both assume Obama vs Romney with no strong third party candidate and show polling as it currently exists. Things will change before election day. On the map red is Romney, blue is Obama, gold states are too close to call. Lines on the chart represent how many more electoral votes a candidate would have than is needed to tie under several different scenarios. Up is good for Obama, Down is good for Romney.
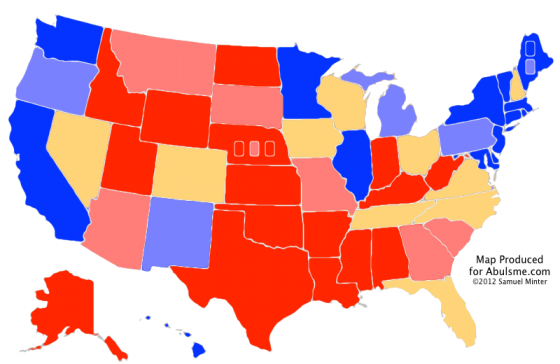
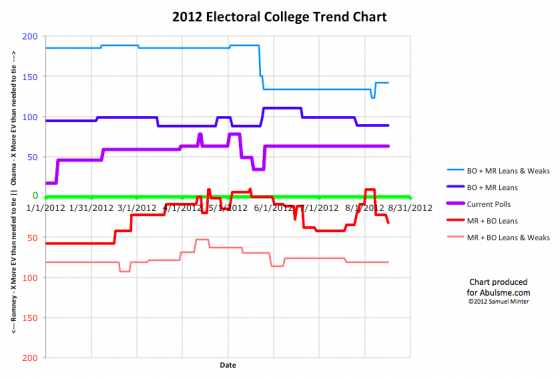
Chart and map from the Abulsme.com 2012 Electoral College Prediction page. Both assume Obama vs Romney with no strong third party candidate and show polling as it currently exists. Things will change before election day. On the map red is Romney, blue is Obama, gold states are too close to call. Lines on the chart represent how many more electoral votes a candidate would have than is needed to tie under several different scenarios. Up is good for Obama, Down is good for Romney.
This is the first status change in my models since Romney announced Paul Ryan as his running mate. Appropriately enough, it is Ryan’s home state of Wisconsin moving a bit in Romney’s direction:
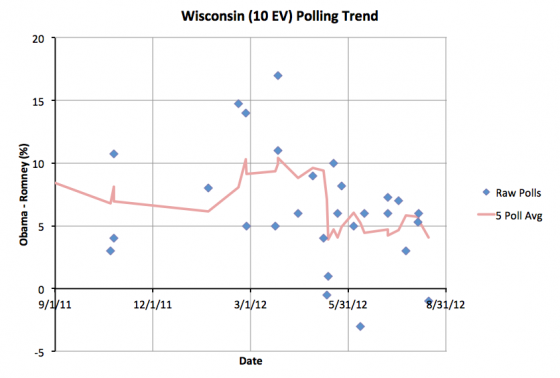
The five poll average in Wisconsin (10 ev) has been hovering right around the 5% Obama lead mark, which means over the past few months it has bounced back and forth between my “Lean Obama” and “Weak Obama” categories. With today’s update, it moves once again into the “Lean Obama” category, meaning I consider the state to be “in play” and Romney’s best case scenario now includes Romney winning here. The most recent poll (and the only one since the Veep announcement) actually shows Romney slightly ahead in Wisconsin. It is of course yet to be seen if the selection of Ryan will leave Wisconsin permanently in this competitive category, or even move the state into Romney’s column, or if this is just Wisconsin continuing to bounce around.
For now, Wisconsin is again classified as a swing state leaning toward Obama. This improves Romney’s “Best Case” in my models:
|
Romney |
Obama |
| Romney Best Case |
301 |
237 |
| Current Status |
206 |
332 |
| Obama Best Case |
180 |
358 |
This puts Romney in his best position in several weeks. He is not only better off than the “even his best case loses” situation he was in at the beginning of August, but enough states are now “close” that Florida isn’t even a must win state any more. Romney has a variety of different “paths to victory” as they say. If all the close states go his way, and even if he loses a couple, he can still win.
He does have to get a bunch of these close states though, and he still has work to do. Right now there are 10 states where the margin is less than 5% in my averages. At the moment, Obama is ahead in 8 of them. The next step in making this election close and competitive is to start moving some of the states that currently lean Obama over to his side of the fence. The biggies right now are of course Florida (29), Ohio (18), Virginia (13). These are not only big in terms of the electoral college, but Obama’s lead in all three is less than 2% right now, which makes them very vulnerable.
Is this the start of a Romney bounce from the VP selection? It is really hard to tell. “Bounces” usually last a week or two. State polling is still slow enough that even in the most frequently polled states, I am looking at the last month or so usually. A short term bounce may be missed entirely, or its effects could be exaggerated and appear to last longer than they would otherwise, so looking for those short term effects in this kind of model is probably futile. Things will be somewhat unsettled from now through the end of the conventions anyway.
After that though, polling frequency will probably increase significantly, the number of people paying attention to the race will increase, and it will start getting close enough to the election that maybe, perhaps, the state of the polling starts looking like an actual predictor of November rather than just a hypothetical “if the election was today”.
Fun stuff ahead.
|
|


