This is the website of Abulsme Noibatno Itramne (also known as Sam Minter).
Posts here are rare these days. For current stuff, follow me on Mastodon
|
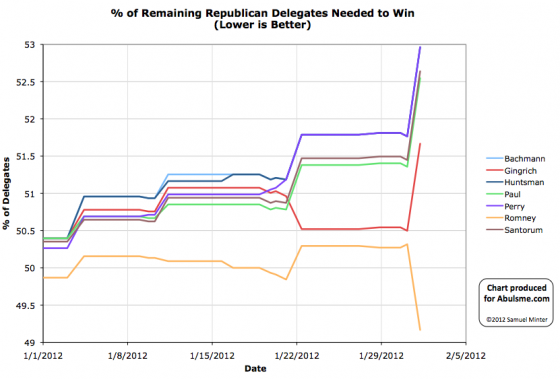
Chart from the Abulsme.com 2012 Republican Delegate Count Graphs page.
So Florida has played out exactly as it looked like it will for the last week or so. Gingrich’s brief spike in the polls after South Carolina subsided rapidly, and Romney won Florida handily. As a winner take all state (absent any contesting of the rules changing that in the future) the margin doesn’t matter though, Romney gets all 50 delegates from the state.
By our count this now gives Romney 82 delegates, or 65.1% of the delegates that have been determined so far. Gingrich is still in second, but way behind with 28 delegates, or 22.2% of the delegates.
From our preferred view above, you can see that this of course is very good for Romney, very bad for everybody else. He is now in a much better position than everybody else, and in the best position he has been in so far. He now only needs about 49.2% of the remaining delegates… compared to his record so far of 65.1% of the delegates. So he can actually do worse than he has been doing so far and still grab the nomination.
Every other candidate must significantly improve on their existing performances to catch up and win. For instance, Gingrich must win 51.7% of remaining delegates, which would be more than double his track record so far of 22.2%. Of course, winner take all states like Florida massively distort this sort of thing, but that is what we have with Florida, and this still shows the size of the mountain the other candidates would need to climb to get back into contention. Winning is not enough, they must start winning by very significant margins (not in popular vote, in delegates) in order to catch up. As we go on, this will get harder and harder.
Next up, the Nevada caucuses on Saturday… 28 delegates, proportional.
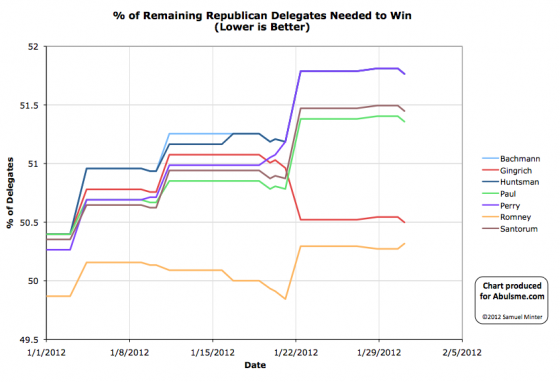
Chart from the Abulsme.com 2012 Republican Delegate Count Graphs page.
After a detailed examination of the rules, DCW determined that the super delegates from five states weren’t really as super as once thought, in that they will actually be bound by the elections in those states… so the declared opinions of those supers don’t matter any more. Net effect… 2 delegates that had previously been listed for Romney go away.
This of course is bad for Romney, good for everybody else (because at least in theory, those two delegates are now up for grabs). But really, it is a relatively small number of delegates, and doesn’t change the overall picture of the race on the eve of the Florida primary.
| In the latest Curmudgeon’s Corner…
Sam and Ivan talk about:
- Spam Fighting
- Newt and Romney South Carolina
- Newt and Romney Florida / General Election 2012
Just click to listen now:
[wpaudio url=”http://www.abulsme.com/CurmudgeonsCorner/cc20120122.mp3″ text=”Recorded 22 Jan 2012″]
or
 1-Click Subscribe in iTunes 1-Click Subscribe in iTunes
 View Podcast in iTunes View Podcast in iTunes
 View XML Feed View XML Feed
|
 |
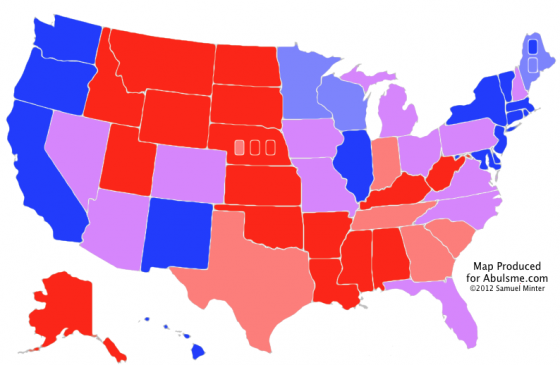
Map from the Abulsme.com 2012 Electoral College Prediction page.
Well, the time has come. I have put together my initial general election forecast. Now, since so far Romney has been the only one in the lead in my Republican Delegate Count Tracking this initial analysis is based on the assumption that this will be an Obama vs Romney race. If someone else, say, I don’t know, Gingrich, would take a lead in my delegate count at some point in the future, I’ll produce a new analysis based on that pairing. For now though, we assume a Romney nomination.
Bottom line at the moment… Obama is in a better position than Romney. If everybody won the states where my polling average indicates they are even slightly ahead, Obama wins by 315 to 223. But there are 12 states that at the moment should be considered too close to call. If Romney were to win all 12 of those states, he would win 327 to 211. If Obama were to win all 12 of those states, he would win 368 to 170. (For reference, 2008’s final result was Obama 365, McCain 173, so at the moment Obama’s best case is just slightly better than his 2008 result.)
For details on the methodology I am using, please see the full 2012 Electoral College Prediction page. It isn’t the most sophisticated analysis method out there, others such as HorsesAss.org are doing more complex things such as Monte Carlo simulations based on current polling, etc. As we get closer to November, there will be dozens of sites doing different sorts of modeling and predicting possible results in different ways. I hope mine provides a slightly different view which is useful or interesting to at least a few people.
The main item that is different with what I show than what I’ve seen other places is my method of showing the evolving race over time. In 2008, that chart ended up looking like this:
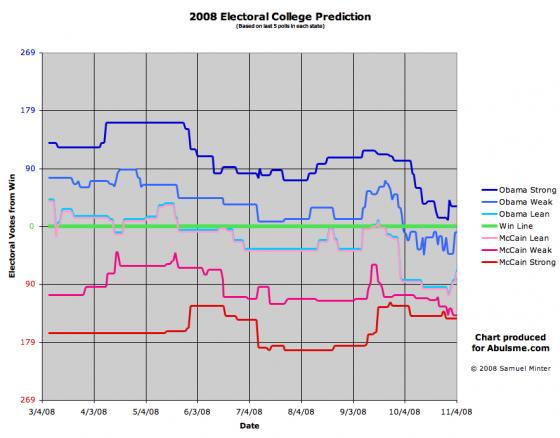
(More on the 2008 analysis can be found at the 2008 Electoral College Prediction page.)
In the 2008 chart above, the lower the lines were, the better off Obama was doing, the higher the lines, the better off McCain was. The nice thing here though is you can see the ebb and flow of the race over the course of the year. So you can tell McCain was doing well in the Spring, then sometime in May he was no longer the favorite to win, and with the exception of a few days right around the Republican convention, he was never ahead again. Then soon after the conventions were all over, McCain just collapsed and by the time we got to October, it was clear that it would take something remarkable happening for him to pull off a win.
Anyway, for 2012 I’ve redone some of the details of how this chart is constructed, hopefully improving readability and intuitiveness. We don’t have all that much data or action yet so far, things are just beginning after all, but here it is:
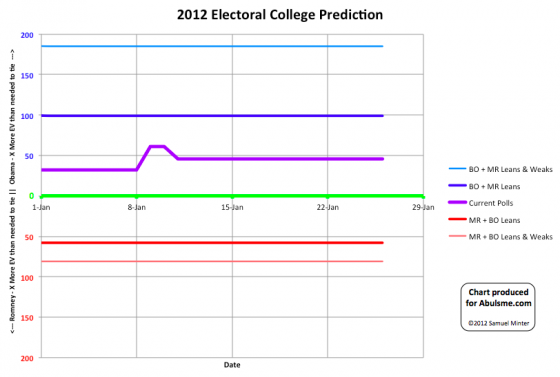
Chart from the Abulsme.com 2012 Electoral College Prediction page.
This time up is better for Obama, down is better for Romney.
The two wobbles on the center line so far are Florida flipping from Leaning Romney to Leaning Obama on January 9th, and North Carolina flipping from Leaning Obama to Leaning Romney on January 12th.
Since this is the first post of the year for this model, I’ll include here the full explanation of how to interpret this chart:
First of all, the current state of the race for each state (or congressional districts as well in the cases of Maine and Nebraska) is determined by looking at the average margin between the candidates in the last five polls in that area. In cases where five polls are not yet available, the final popular vote results in the 2004 and 2008 elections were used to “seed” the data.
States are then put into 3 categories.
- Lean: 0% ≤ Candidate Lead < 5%
- Weak: 5% ≤ Candidate Lead < 10%
- Strong: Candidate Lead ≥ 10%
All “lean” states are for all intents and purposes too close to call, but for the chart above, we separate them.
The chart is divided into two halves.
- Above the green line, the Democrat is winning with X more electoral votes than they need to tie. (So 269+X = their electoral vote total)
- Below the green line, the Republican is winning with X more electoral votes than they need to tie. (So 269+X = their electoral vote total)
We show five lines, outlining five different scenarios showing the range of possibilities given the current polling.
- Light Blue Line – The Democrat wins all states they are ahead in, but also flips the Republican’s Lean and Weak states.
- Dark Blue Line – The Democrat wins all states they are ahead in, but also flips the Republican’s Lean states.
- Purple Line – Each candidate wins the states they are ahead in, no states flip.
- Dark Red Line – The Republican wins all states they are ahead in, but also flips the Democrat’s Lean states.
- Light Red Line – The Republican wins all states they are ahead in, but also flips the Democrats Lean and Weak states.
We assume that states where a candidate is “Strong” have essentially no chance of flipping.
The light lines would represent a very unlikely sweep with a candiate massively exceeding what polling would indicate in a large number of states at the same time.
But “Lean” states are essentially all too close to call, in that a 5% lead is small enough that it can easily be affected by natural random variations in polls, or even excluding those sorts of effects, a 5% move in opinion is easily possible in just a few days given particularly effective campaigning by one candidate, or a particularly bad gaffe by the other, or simply by the effects of the news cycle. So essentially anything between the dark blue and dark red lines should be considered to be quite possible given the current state of polling, although of course results closer to the purple line (representing the actual current state of polling) are more likely than results close to the dark red or dark blue lines.
Edit 2012 May 30 15:53 UTC – Since this was posted, I was made aware of more older polls that should have resulted in New Hampshire starting off as a “Weak Romney” state instead of a “Lean Romney” state. The time series charts are corrected as of May 30. Further details of the New Hampshire correction are also located in that post.
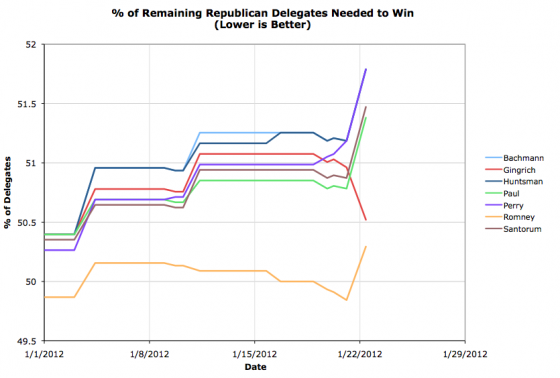
Chart from the Abulsme.com 2012 Republican Delegate Count Graphs page.
Pulling ahead in just the last few days before the South Carolina Primary, Gingrich won a commanding victory in South Carolina. Although the congressional district level results won’t be final for awhile now, it looks like Gingrich will end up with 23 of South Carolina’s 25 delegates. Romney gets the remaining 2 delegates, plus he picked up another superdelegate since our last update.
Fundamentally, looking at our “% of Remaining Delegates needed to win” chart gives the same story that is the big narrative tonight. This was a very bad day for Romney. Romney is still in the best position to win. He is still ahead in delegates. (33 Romney delegates to Gingrich’s 28 by our count which uses data from both The Green Papers and Democratic Convention Watch.) But now instead of being way off on his own, with a much better position than all of his competitors, who were getting worse off by the day, he is now joined by Gingrich, who has broken out of the pack of “not-Romneys” and is now nipping at Romney’s heels. Meanwhile, Paul and Santorum fall even further behind since they got no delegates at all out of South Carolina.
The next big contest is Florida of course, with 50 delegates at stake. Florida is a winner take all state. If Romney wins Florida, he pulls WAY ahead again, and pushes Gingrich back into the background. If Gingrich wins, then he suddenly will take a fairly significant lead himself, and we will need to start taking a much closer look at the rest of the calendar…
Since this was a big day, two other views as well… first the race as % of delegates captured so far…
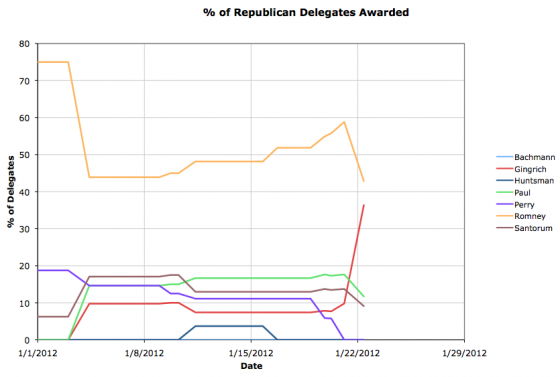
Romney had been over 50% for a little while. No longer.
And finally, the plain old “Total Delegates” chart…
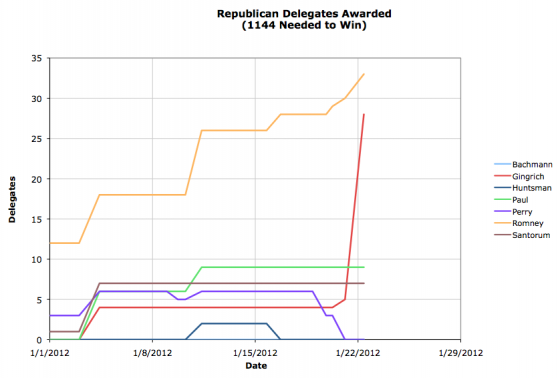
Gingrich’s good night is particularly striking in this last one, but I think it actually makes it look like a better night than it really was.
I think the first of these three charts is the most indicative of where the race really stands, but the other two are interesting views as well. But looking at % needed to win really gives you a sense of how close we are (or not) to wrapping things up. Numbers close to 50 as we have today still indicate a lot is possible. As we get candidates starting to head rapidly toward 100 (where they are mathematically eliminated) or starting to dive down toward zero (where they cinch the nomination) we will see very clearly the state of the race.
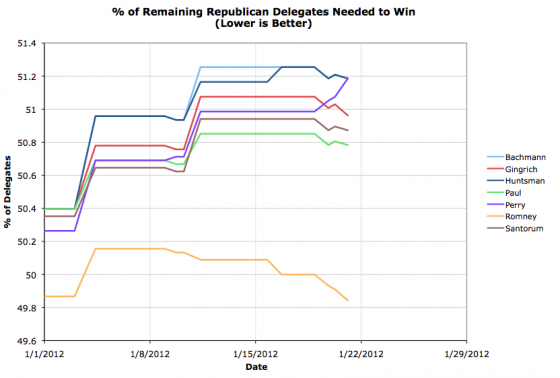
So, as we approach the voting in South Carolina, a few delegate shuffles. Perry’s 3 projected delegates from Iowa get put back into the undetermined category, Gingrich gains one super delegate, and Romney gains one superdelegate. All in all this improves everybody’s position except Rick Perry, although it is best for Romney. So here we are. We’ll see what South Carolina does to all this. In the mean time though, lets do a quick look using a different view:
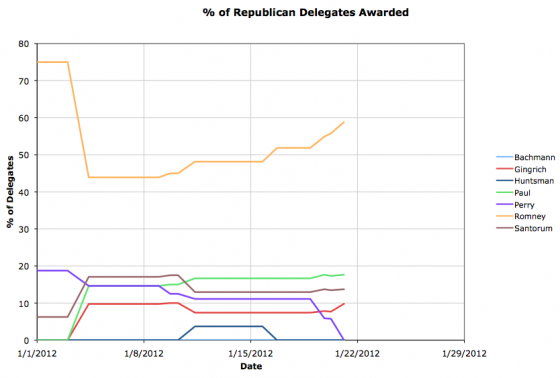
This is the percentage of delegates each candidate has so far. Our Top 4 are: 58.8% Romney, 17.6% Paul, 13.7% Santorum, 9.8% Gingrich. But I wanted to compare, by looking at where we were four years ago.
My most recent update post four years ago is here: Delegate Graphs with Preliminary Results from Nevada and South Carolina Republicans. Now, the primary schedule was a bit different, so there were already some results from South Carolina and Nevada, but where were we?
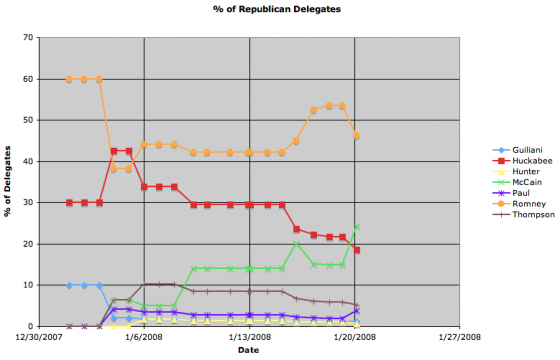
What were the Top 4 back then? 46.2% Romney, 24.4% McCain, 18.6% Huckabee, 5.1% Thompson.
That’s right, at this time in 2008, Romney was ahead in the delegate race. Romney. Not McCain. McCain had just had a big success in South Carolina, which was enough to pass Huckabee and start talk about him being the front runner and how Romney was vulnerable. McCain wouldn’t pass Romney in delegates until January 30th after Florida voted (and then he didn’t look back). So where we are on January 21st isn’t necessarily predictive of the final result.
The dynamics are of course very different this time around. I just mention all this to point out that it is indeed still early. If Gingrich DOES pull out a major victory in South Carolina, taking the lion’s share of the delegates there, then that DOES change the dynamics of the race quite a bit. Romney still has a variety of systematic advantage even in that scenario, but it could make things more interesting for awhile longer!
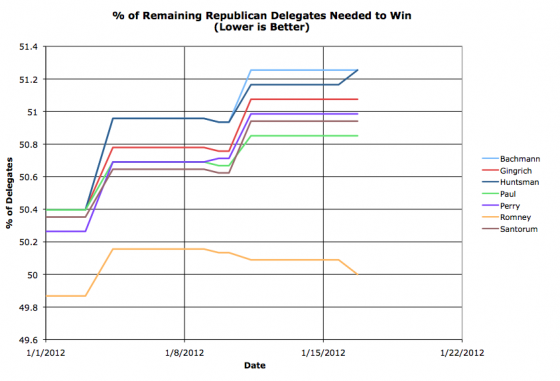
Nominally when a candidate drops out their delegates become free agents, but in practice if a candidate endorses another candidate, the delegates fall in line and vote for the person their candidate endorsed, at least for delegates from the primary and caucus process. My source for these delegates, The Green Papers, uses that presumption for their “soft count” (which is what I am using), so today we have Huntsman’s two delegates jumping over to Romney.
This also puts Romney back in the best position he has been in before voting started. He now has more than 50% of the delegates so far, which means he needs less than 50% of the remaining delegates to win. Another way to put that is that he doesn’t even have to match his performance so far to win. For the rest of the race he can do WORSE than he has done so far (including superdelegates!) and he will still win. The other candidates have to IMPROVE their performance in order to catch up and win. The amount they have to improve by isn’t completely out of the realm of contemplation yet, but it is getting higher.
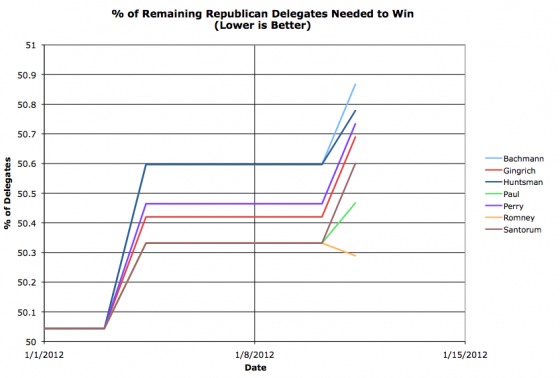
For the second time this election season we have delegate updates. This time of course from New Hampshire. As before, I am going to concentrate here on the graph above, which is the percent of the outstanding delegates the candidate needs to get in order to wrap up the nomination. For more common charts, like total delegates and the like, go to my full 2012 Republican Delegate Count Graphs page.
For this chart, remember that DOWN is better. When a candidate gets down to zero, they have wrapped up the nomination. If they go up past 100 then they have been mathematically eliminated from winning absent delegates changing their votes. Basically, you can look at this as measuring how close they are to winning. The lower the line, the closer they are to winning.
Bottom line here is that only one candidate actually improved their overall position based on the results in New Hampshire. That candidate is of course Romney. As you can see above, his percentage needed dropped slightly. This means the bar he needs to pass in all future contests was just LOWERED a bit, so his road to the nomination is easier. Everybody else in the race, even some others who increased the percentage of delegates they have, didn’t get ENOUGH… so their road to the nomination gets harder after this, not easier.
Of course this lines up nicely with the dominant narrative at this point. This was a big success for Romney, everybody else muddles along. The standard narrative is moving rapidly toward inevitability though. This is of course based on momentum and how spin following each contest effects the next elections, etc. From a pure delegate count point of view though, we just are not there yet. Only 1.6% of the available delegates have been awarded at this point… and that is only if you count provisional estimates of delegates from Iowa (they haven’t REALLY been allocated yet). The candidates are still close enough together in delegate count, and there are still so many delegates yet to allocate, that *if* the kind of volatility in support that happened during the pre-primary season were to continue, with either Romney collapsing, or another candidate having a “surge”, or if the dynamics start to shift as candidates drop out, there is still plenty of room for non-Romneys to make a move here.
Having said that, honestly, it does still look like Romney is going to quickly run away with this unless something happens to change the dynamics of the race VERY SOON. We just can’t actually say that from the numbers yet. Right now (estimates via The Green Papers) we have Romney with 13 delegates, followed by Paul 9, Santorum 6, Gingrich 4, Perry 3 and Huntsman 2. With 2249 more delegates yet to be determined. So a long way to go yet.
Given however that as of today for the first time, we actually have a delegate leader in the Republican campaign, I’ve started to put together my General Election Electoral College models based on state by state polling assuming we are going to end up with Obama vs Romney. Look for those to debut here before the end of the month.
It is annoying that the coverage is all concentrating on the raw initial preference vote in Iowa. Yes, there are no actual delegates to the national convention allocated tonight. But after the initial straw poll vote that is being reported on, the small number of people that actually stick around get to start voting for the delegates to the County conventions, which in turn will elect the delegates to the State convention, which will THEN elect the representatives to the national convention. This process won’t be complete in Iowa until June. But in other caucuses in other races, they try to use the selection of the county delegates to predict what the final mix of delegates will be that are eventually sent to the national convention. I’m really kind of annoyed that is not happening.
Because this initial vote DOES NOT MATTER in the delegate selection process. The voting for the delegates to the county convention is what actually matters for delegates, and IS NOT TIED to the initial straw poll vote. And most of the people leave after that first part it seems, so the actual delegates are determined by the really ardent and involved people who stay.
I’ve been picking up Alex and driving home, so I’ve been listening to streaming audio from CNN, not checking all the usual internet sources, so I don’t know what is being covered there, but in the parts I have heard, CNN hasn’t even mentioned the delegate process at all, and that just annoys me.
Of course, Iowa has 28 delegates out of 2286… 1.2%… Iowa really doesn’t matter very much at all in terms of delegates. And in previous cycles, by the time Iowa ACTUALLY gets around to allocating delegates in the summer, the winner is known, and the final delegate selections end up reflecting that reality rather than the results from January… (since none of the delegates to the county convention that are selected today are actuallY BOUND to continue to vote based on their preferences today).
So what ends up mattering out of Iowa is just the spin. Not who gets elected to the county conventions. Not even who wins the non-binding straw poll that decides no delegates. Just how people spin the results in terms of how the candidates did versus “expectations”.
All of which is very frustrating, because the only thing that SHOULD matter here is how the choice of delegates to the county conventions affects the chances of the candidates toward conventions to the national convention. Based on the preferences of the people selected for the county conventions you CAN do some projections of actual delegate counts. It is just nobody is even bothering to look at that part of the process. ARGH!
Things are rarely how they should be though, so we’re talking about the results of a non-binding straw poll instead of the process that actually allocates delegates instead. Sigh!
Oh well. Delegates will start coming in soon enough… :-)
In the mean time, with 88% reporting we have Santorum, Romney, Paul in that order, but very very close to each other. Which I guess is quite exciting in terms of being close and all…. But in the end, anything with Romney near the top ends up being good for Romney because nobody believes Paul can expand his support much beyond his core, and Santorum isn’t set up to compete much beyond Iowa… although a top 3 placement (let alone a win!) here may lead to a spike in fundraising and a bump elsewhere for Santorum… but…
Well, we will see I guess. I’ll stop fretting about the fact nobody is even trying to project national delegates based on county delegates and go with the flow and have fun with the tight three way battle in the non-binding straw poll. :-)
Edited 04:19 UTC to reflect 28 delegates for Iowa instead of 40.
| In the latest Curmudgeon’s Corner…
Sam and Ivan talk about:
- Review of 2011 Predictions
- 2011 Scorecard
- 2012 Election Predictions
Just click to listen now:
[wpaudio url=”http://www.abulsme.com/CurmudgeonsCorner/cc20120101.mp3″ text=”Recorded 1 Jan 2012″]
or
 1-Click Subscribe in iTunes 1-Click Subscribe in iTunes
 View Podcast in iTunes View Podcast in iTunes
 View XML Feed View XML Feed
|
 |
|
|


