This is the website of Abulsme Noibatno Itramne (also known as Sam Minter).
Posts here are rare these days. For current stuff, follow me on Mastodon
|
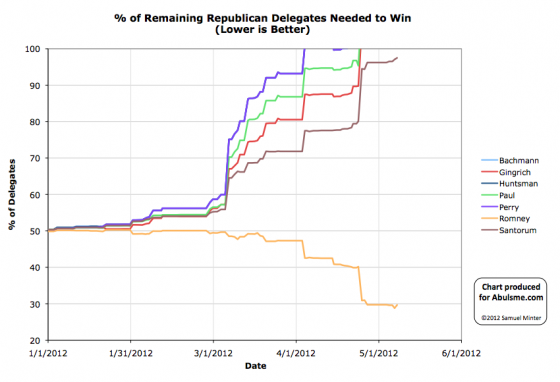
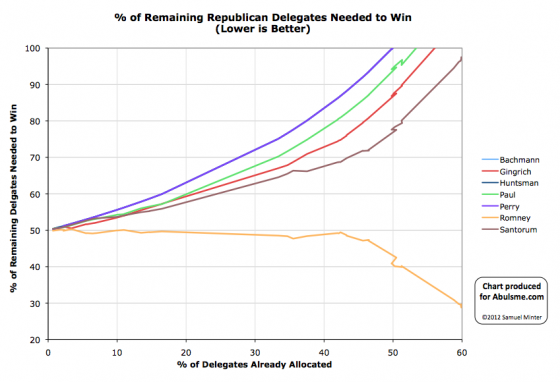
Charts from the Abulsme.com 2012 Republican Delegate Count Graphs page. When a candidate gets down to 0%, they have clinched the nomination. If they get above 100%, they have been mathematically eliminated. The first chart is by date, the second is by “% of Delegates Already Allocated”. These numbers include estimates of the eventual results of multi-stage caucus processes which will be refined as the later stages occur.
As I mentioned yesterday, Ron Paul had a big weekend in Maine. Green Papers has now updated their Maine Soft Count to reflect this. The previous estimate for Maine was: Romney 10, Paul 8, Santorum 4, Gingrich 1, TBD 1. Paul completely dominated the process at the District Caucuses and State Convention though. So now we have Paul 21, Romney 2, TBD 1.
That gives a net change for the day of Paul +13, Gingrich -1, Santorum -4, Romney -8
Paul is clearly the big winner for the day. Romney is clearly the big loser.
Of course, Romney is so far ahead at this point it barely matters.
In terms of “% of remaining delegates needed to win”:
- Romney: 28.8% -> 29.7%
- Santorum: 97.1% -> 97.5%
And Paul? Well, down from 114.4% to 113.0%. Still way above 100%. Not in contention here.
Of course, for Paul this isn’t about winning the nomination. He is getting down in the dirt in the state processes. He is winning a number of delegates, and Maine marks the second state (along with Minnesota) where he now has the plurality of delegates in Green Paper’s soft count (and he is tied in Iowa as well). In addition, he is collecting delegates in other states that while officially bound on the first ballot for Romney, are actually Paul supporters. Even though they can’t vote for Paul on the first ballot, these folks could cause procedural trouble at the convention if Paul wants them too.
Completely aside from Convention delegates though, Paul is using the process here to build an organization and to start electing “his people” to positions in the local and state party structure. In states like Maine, Minnesota and Iowa, Paul supporters are in the process of taking over the state Republican Parties. This will not matter in 2012, but it means they will have a bigger role in defining how the process will work in 2016 and 2020. Ron Paul is probably on his last presidential run, but the structure he leaves behind will be ready for Rand Paul (or some other Libertarian leaning candidate) next time around.
Winning the nomination was never what Paul was about. Working to put the machine in place to gradually, over many years, bend the Republican Party in his direction… that’s Ron Paul’s game. I don’t know if in the long run it will succeed, but that is what is going on here, not an attempt to keep fighting and win the nomination long after it was clear that would never happen.
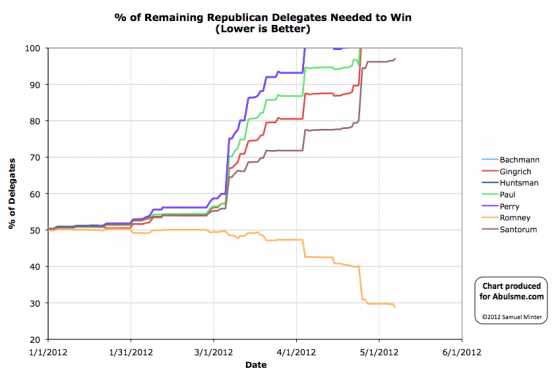
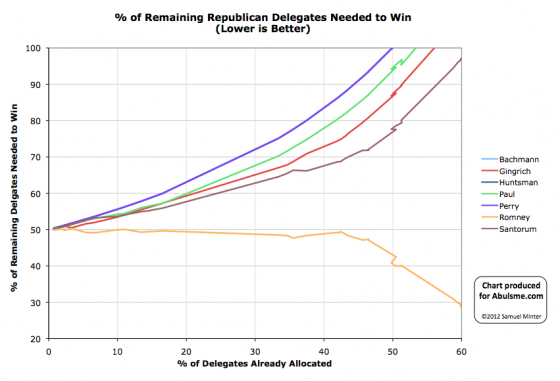
Charts from the Abulsme.com 2012 Republican Delegate Count Graphs page. When a candidate gets down to 0%, they have clinched the nomination. If they get above 100%, they have been mathematically eliminated. The first chart is by date, the second is by “% of Delegates Already Allocated”. These numbers include estimates of the eventual results of multi-stage caucus processes which will be refined as the later stages occur.
You may have heard reports of a big Ron Paul win in Nevada this weekend. Ron Paul supporters win 22 of the 25 delegate spots in Nevada and all that. Well, yes. True. However, in Nevada the delegates are still bound on the first ballot at the convention to vote proportionately to the caucus results, and the delegates can be removed and replaced if they attempt to do something different. So the slate of delegates elected in Nevada doesn’t actually change the delegate counts. Something else does however. According to Green Papers the delegates will be awarded proportionally between the candidates still actively in the race, so by suspending their campaigns Santorum and Gingrich lose their delegates and those delegates get reallocated. So the previous estimated allocation in Nevada had been: Romney 14, Gingrich 6, Paul 5, Santorum 3. This now becomes: Romney 20, Paul 8. So net from Nevada for today: Romney +6, Paul +3, Santorum -3, Gingrich -6.
Meanwhile, Romney picks up two more supers, one from Alabama and one from Arkansas.
So for the day: Romney +8, Paul +3, Santorum -3, Gingrich -6. So of course Romney continues to walk toward the nomination, despite some delegate gains for Paul as well.
Wait, but what about Maine? Paul won there over the weekend too, right? Yes. It looks that way. But Green Papers hasn’t updated their “soft count” for Maine yet. I’m sure they will soon. When they do, we’ll update here too.
In any case, for now, in terms of “% of remaining needed to win”:
- Romney: 29.6% -> 28.8%
- Santorum: 96.5% -> 97.1%
Despite winning some delegates, Paul’s “% of remaining needed to win” remains significantly higher than 100% at 114.4%. The delegates he is accumulating right now are not anywhere near enough to catch up and win… or even to block Romney in combination with Santorum and Gingrich delegates. Sorry. They may let him cause the convention not to go quite the way the Romney folks would like due to some unscripted deviations from the plan, but it won’t be anywhere near what would be needed to actually derail Romney.
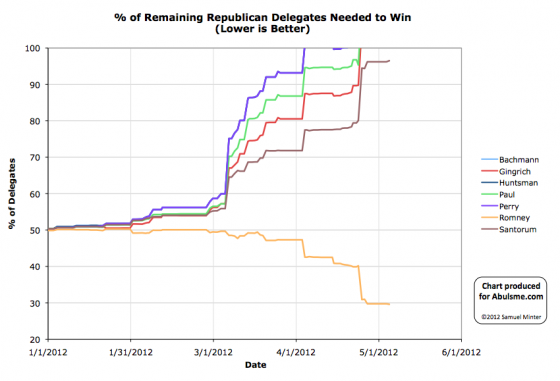
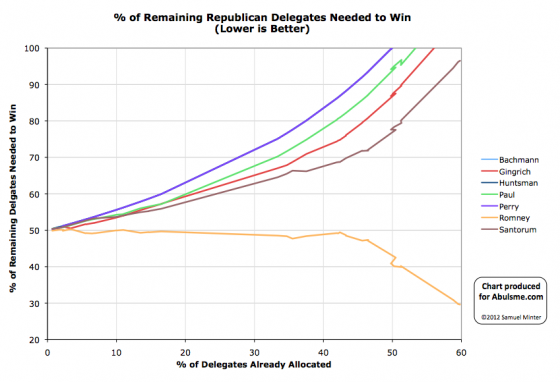
Charts from the Abulsme.com 2012 Republican Delegate Count Graphs page. When a candidate gets down to 0%, they have clinched the nomination. If they get above 100%, they have been mathematically eliminated. The first chart is by date, the second is by “% of Delegates Already Allocated”. These numbers include estimates of the eventual results of multi-stage caucus processes which will be refined as the later stages occur.
If you remember, in Ohio Santorum did not file all the right paperwork to have actual human delegates designated to fill the slots he might win in some parts of the state. There were four delegate positions that Santorum won, but wasn’t going to be able to claim because of that. Well, it looks like the Romney folks decided to be nice and not challenge Santorum’s ability to retroactively fill those four delegate slots. So Santorum will get those four delegates after all. So Santorum +4 in Ohio.
Meanwhile, DCW adjusts their Superdelegate Count. One Alabama super switches from Santorum to Romney. And then Romney gains two more previously undeclared supers, one from Alabama and one from South Dakota.
Net for the day, Romney +3, Santorum +3. At 50%, this is of course well over the 29.7% of the delegates Romney needs to be tracking to in order to clinch the nomination.
In terms of “% of remaining needed to win”:
- Romney: 29.7% -> 29.6%
- Santorum: 96.2% -> 96.5%
Next real contests on Tuesday.
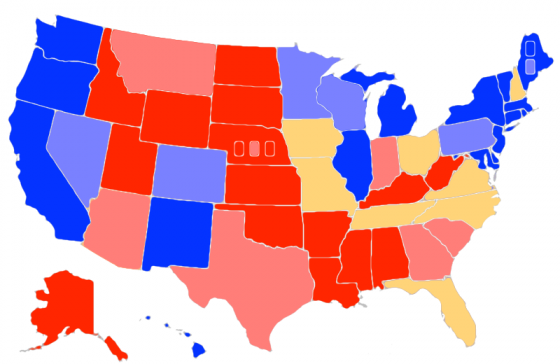
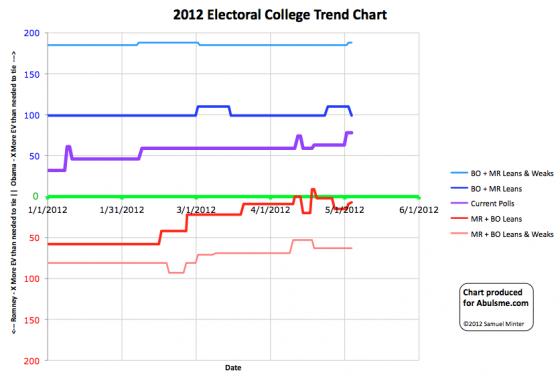
Chart and map from the Abulsme.com 2012 Electoral College Prediction page. Both assume Obama vs Romney with no strong third party candidate. Both show polling as it currently exists. Things will change before election day. On the map red is Romney, blue is Obama, gold states are too close to call. Lines on the chart represent how many more electoral votes a candidate would have than is needed to tie under several different scenarios. Up is good for Obama, Down is good for Romney.
Today is an exciting day. THREE states change categories.
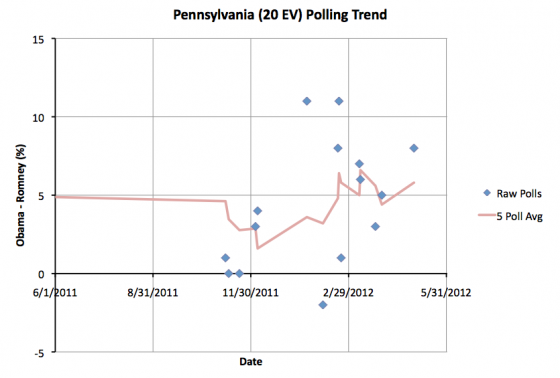
First up, Obama’s lead in Pennsylvania moves over 5%, so we pull it out of swing state status again. We’d listed Pennsylvania as a swing state since April 14th. The five poll average now has Obama up by 5.8%. This is still pretty close to the boundary, so a poll or two in Romney’s direction could pull Pennsylvania back, but for now we no longer consider Romney winning PA in our “Romney Best Case” scenario.
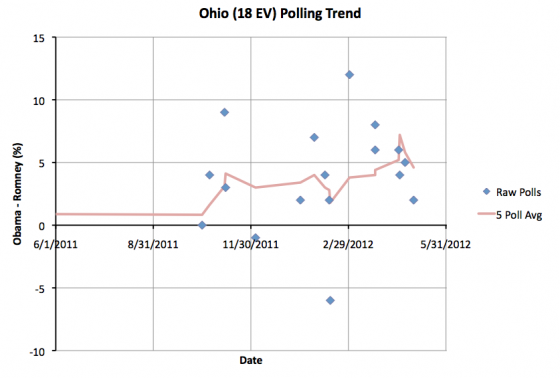
Second, Ohio gets tighter. Obama’s lead drops to 4.6%, which means I consider it a swing state again, and Romney’s best case scenario now includes Ohio. Ohio has usually been considered a swing state, and our five poll average only showed a greater than 5% lead for Obama from Apr 20 until today… two weeks. So this is a return to Ohio’s “normal” status. Ohio (18 ev) moving back toward Romney balances the Pennsylvania (20 ev) move, so the overall loss to Romney’s best case is only 2 electoral votes.
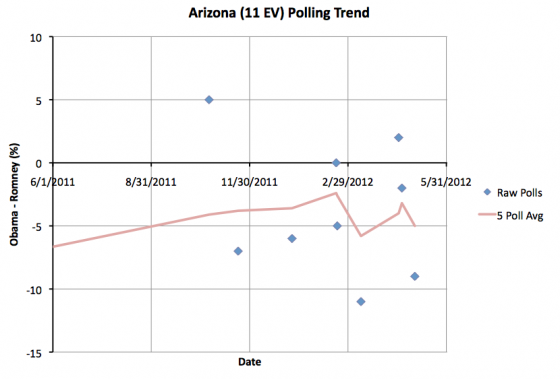
Third, Arizona moves back toward Romney. There has been talk of Arizona being a red state that Obama may be able to pick off and win. For the moment though, that looks less likely. According to my definition, I consider states to be swing states if the lead in the five poll average is LESS than 5.0%. At the moment the five poll average in Arizona is EXACTLY a 5.0% Romney lead, so the state moves back into “Lean Romney”. So I take winning Arizona off the table for Obama. At least for the moment. One poll could bring it back.
Between all three of these changes, the net affect is to narrow the range of possibilities between our Obama best case and Romney best case scenarios. Obama’s best case is worse by 11 electoral votes, and Romney’s best case is worse by 2 electoral votes.
|
Romney |
Obama |
| Romney Best Case |
276 |
262 |
| Current Status |
191 |
347 |
| Obama Best Case |
170 |
368 |
Romney’s best case remains very narrow. In order to win the presidency, he needs to win all of the states where he is currently ahead, including Tennessee (11 ev) and Missouri (10 ev) where polls currently show his lead is slim, then he MUST win Florida (27 ev), Ohio (18 ev), North Carolina (15 ev) and Virginia (13 ev), all of which are states where Obama is currently ahead by a narrow margin. Then he needs to win either Iowa (6 ev) or New Hampshire (4 ev) both of which are also leaning Obama at the moment.
Edit 2012 May 4 18:07 UTC – Corrected map, I had forgotten to color Ohio gold.
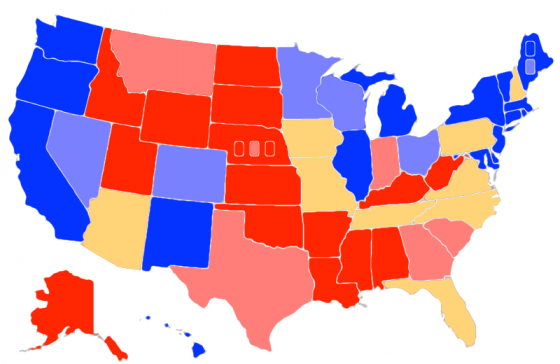
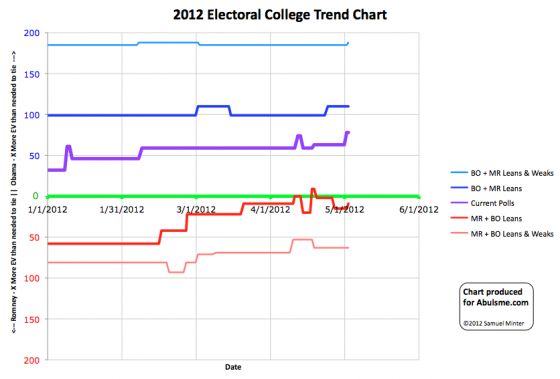
Chart and map from the Abulsme.com 2012 Electoral College Prediction page. Both assume Obama vs Romney with no strong third party candidate. Both show polling as it currently exists. Things will change before election day. On the map red is Romney, blue is Obama, gold states are too close to call. Lines on the chart represent how many more electoral votes a candidate would have than is needed to tie under several different scenarios. Up is good for Obama, Down is good for Romney.
There are two states changing category today. In order by number of electoral votes:
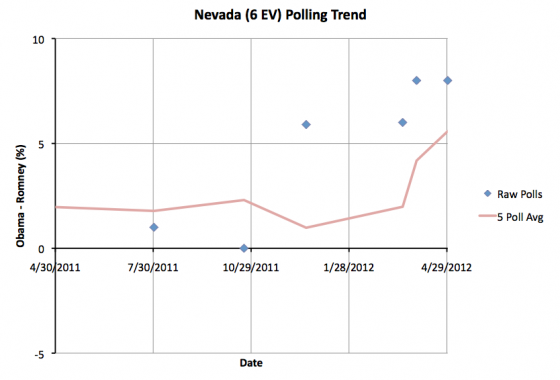
Nevada moves from a “Lean Obama” swing state into “Weak Obama” territory as Obama’s lead in the five poll average goes above 5% to 5.6%. This is still close enough to 5% that a poll or two in Romney’s direction could easily move this back into swing state territory. For the moment though, this means I no longer consider this one of the states Romney could win in his “best case” scenario. So that best case scenario gets slightly worse for Romney, now with Romney winning by just 278 to 260.
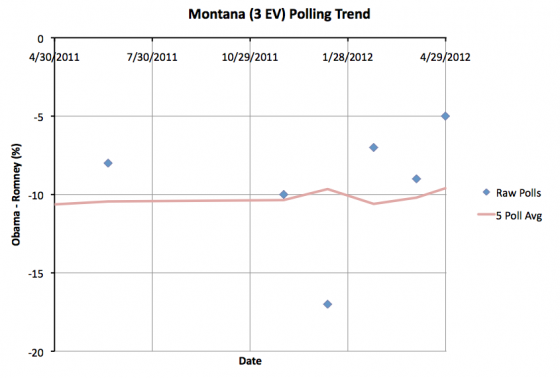
Next, Montana moves from “Strong Romney” to “Weak Romney” as Romney’s lead in the five poll average drops below 10% to a 9.6% lead. Now, make no mistake, a 9.6% lead is still very substantial. Montana is a long way from being a swing state. But with a lead under 10% and a trend moving in Obama’s direction, Romney may want to deploy some resources to defend the state even if Obama’s odds of actually flipping the state are very slim (and they are). Now, Montana is only 3 electoral votes… so maybe Romney won’t bother. But with all of Romney’s paths to victory currently being very narrow ones, every electoral vote counts, so Montana will probably get some attention. Because Montana was not and is not a swing state, this does not however change anything in our summary.
|
Romney |
Obama |
| Romney Best Case |
278 |
260 |
| Current Status |
191 |
347 |
| Obama Best Case |
159 |
379 |
With this new status Romney’s path to victory is holding all of his current Strong and Weak states, then from the swing states winning all of: Florida (29 ev), Pennsylvania (20 ev), North Carolina (15 ev), Virginia (13 ev), Arizona (11 ev), Tennessee (11 ev) and Missouri (10 ev). If he lost ANY of those states, he would lose the election overall. Of the current swing states, he can only afford to lose Iowa (6 ev) or New Hampshire (4 ev)… but not both.
If this was the polling in late October, the chances of Romney pulling off a victory would be pretty slim. (Not zero, a Romney win would still be possible, the odds would just be very strongly against it since it would require a near sweep of the swing states, including many where he is behind.)
It is of course not late October though. Romney has plenty of time to campaign and plenty of time to move critical states toward him.
Edit 2012 May 4 14:05 – Adding in my boilerplate intro paragraph, which I had forgotten.
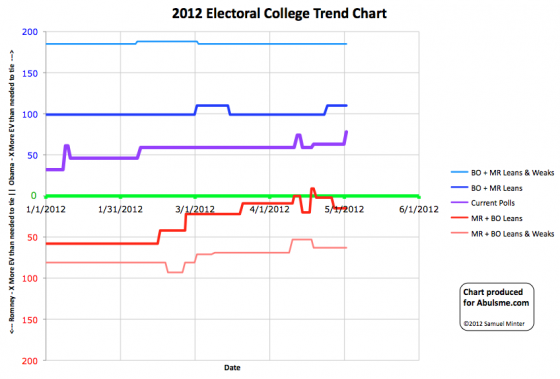
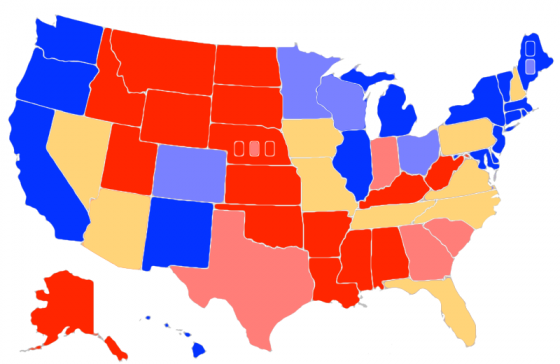
Chart and map from the Abulsme.com 2012 Electoral College Prediction page. Both assume Obama vs Romney with no strong third party candidate. Both show polling as it currently exists. Things will change before election day. On the map red is Romney, blue is Obama, gold states are too close to call. Lines on the chart represent how many more electoral votes a candidate would have than is needed to tie under several different scenarios. Up is good for Obama, Down is good for Romney.
One change today in my categorization of states. North Carolina:
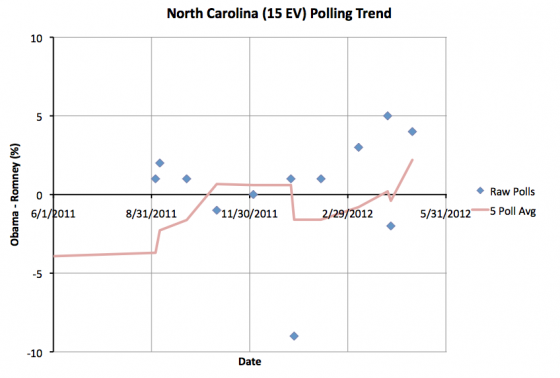
The last five polls go back to February, but now no longer include what now appears to be an outlier poll from Civitas in January that showed Romney up by 9%, so the five poll average pops upward and now sits at a 2.2% Obama lead. This leads me to classify North Carolina as “Leans Obama” again. But that lead is less than 5%, so really too close to call, and North Carolina stays a swing state in our model. As such, this only changes the “Current” line in our summary:
|
Romney |
Obama |
| Romney Best Case |
284 |
254 |
| Current Status |
191 |
347 |
| Obama Best Case |
159 |
379 |

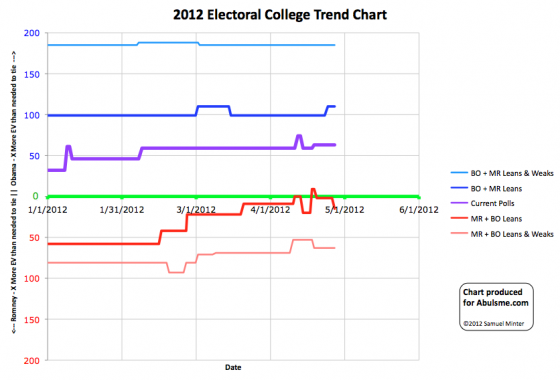
Chart and map from the Abulsme.com 2012 Electoral College Prediction page. Both assume Obama vs Romney with no strong third party candidate. Both show polling as it currently exists. Things will change before election day. On the map red is Romney, blue is Obama, gold states are too close to call. Lines on the chart represent how many more electoral votes a candidate would have than is needed to tie under several different scenarios. Up is good for Obama, Down is good for Romney.
One state changing categories today. Virginia.
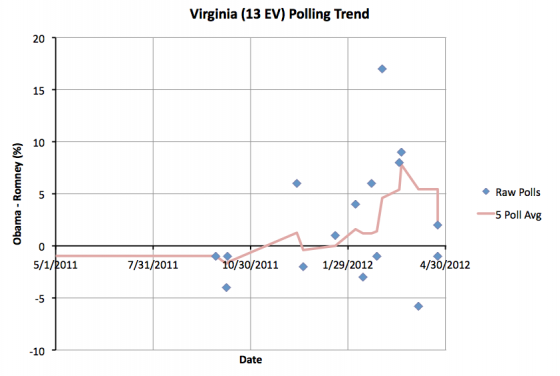
As you can see, The 5 poll average once again drops below 5%, moving the state from “Weak Obama” to “Lean Obama” and making Virginia once again one of the states we consider to be a swing state. The big effect here is the March 2nd Marist poll which showed Obama up by 17 in Virginia rolling off the 5 poll average. That poll was clearly an outlier. Even without it, we see a trend toward Obama around that time, but it wouldn’t have been large enough to move the average over a 5% lead without that one poll. In addition, the more recent polls have been moving in Romney’s direction. In any case, as of now the new 5 poll average has Obama up in Virginia by 2.4%. Clearly in the swing state category.
This change improves Romney’s best case scenario (where we give him all the swing states):
|
Romney |
Obama |
| Romney Best Case |
284 |
254 |
| Current Status |
206 |
332 |
| Obama Best Case |
159 |
379 |
Since Santorum dropped out on April 10th, there have been 11 changes to state categories. In the case of Florida (29 ev) and North Carolina (15 ev), they changed categories, but already changed back to where they were… so no net change. Ohio (18 ev), Arizona (11 ev), Colorado (9 ev) and New Hampshire (4 ev) moved toward Obama. Pennsylvania (20 ev), Virginia (13 ev) and Wisconsin (10 ev) moved toward Romney. The main net effect is slightly more electoral votes in the swing state category, so a bit larger range between Obama’s best case and Romney’s best case.
Comparing to my last update before Santorum dropped out…
- Romney has improved his best case from 278 electoral votes to 284 electoral votes
- Obama has improved his best case from 368 electoral votes to 379 electoral votes.
- The “everybody gets every state they are ahead in even slightly” result changes from Obama winning 328 to 210 to Obama winning 332 to 206.
All in all, the main result here is the race opening up since the last small doubts of Romney being the nominee were put to rest. The polls are tightening and more states are up for grabs. Obama still has a big advantage in the electoral college… for the moment. It has only been 17 days since Santorum dropped out. My expectation is that this race becomes closer as events play out over the next few months.
Edit 2012 May 2 13:10 UTC – Adjusted horizontal scale on Virginia Graph
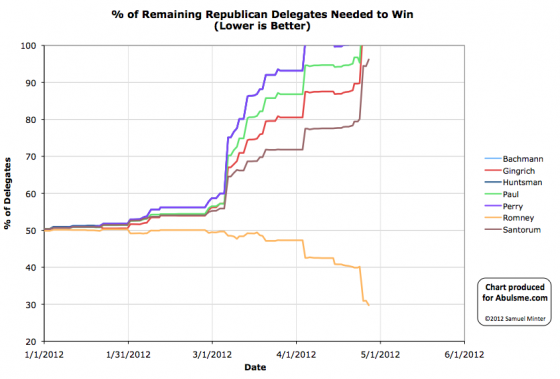
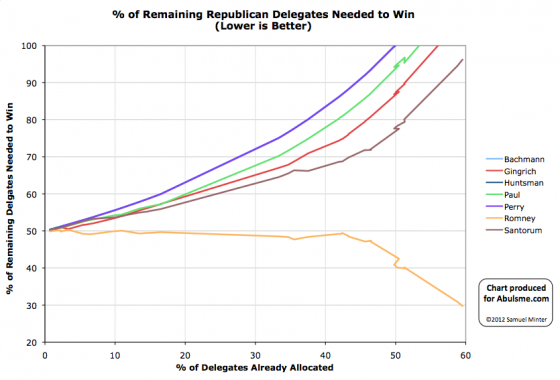
Charts from the Abulsme.com 2012 Republican Delegate Count Graphs page. When a candidate gets down to 0%, they have clinched the nomination. If they get above 100%, they have been mathematically eliminated. The first chart is by date, the second is by “% of Delegates Already Allocated”. These numbers include estimates of the eventual results of multi-stage caucus processes which will be refined as the later stages occur.
First of all, I just updated Wednesday’s post to add a correction. I had made the mistake of doubting Green Papers. I thought they had missed a delegate in their count. In fact, I had misinterpreted their statement about the change. I read their new total as a delta from the election, leading me to add an extra non-existant delegate to Romney’s total in Pennsylvania. My bad. Not theirs. Worse, my first draft of Wednesday’s post actually had it right, but I switched it to the wrong answer right before posting. Bleh. Today’s updates build off the corrected numbers for Wednesday rather than the original incorrect numbers I posted. (OK, it was only off by one delegate, which is tiny in the big scheme, but still, I’m annoyed at myself. :-) ) Anyway…
Three states with updates today, all via Green Papers as usual:
- Pennsylvania: Continued updates as more sources get indication on the preferences of the delegates elected in Pennsylvania. The previous Pennsylvania totals, after my correction mentioned above, had been… Romney 11, Paul 5, Gingrich 4, Santorum 3, 49 TBD. They are now Romney 27, Paul 5, Gingrich 3, Santorum 3, 34 TBD. Net for the day… Romney +16, Gingrich -1.
- Colorado: 2 delegates previously listed as uncommitted move to the Paul column. Net for the day, Paul +2. New total for the state Romney 14, Santorum 6, Paul 2, 14 TBD.
- Virgin Islands: 1 previously uncommitted delegate moves to the Romney column. So Romney +1
So total for the day: Romney +17, Paul +2, Gingrich -1
In terms of “% of remaining delegates needed to win”:
- Romney: 31.0% -> 29.7%
- Santorum: 94.4% -> 96.2%
More updates from Pennsylvania and other locations as they come in. Next batch of actual contests are North Carolina, Indiana and West Virginia on May 8th. I’m guessing Romney will get the 29.7% of delegates he needs there. Yawn.
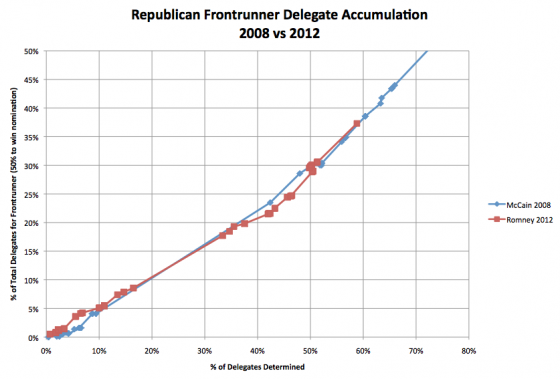
Not much to say here. The small gap between Romney’s rate of accumulating delegates compared to McCain’s in 2008 has completely closed. It is absolutely clear that any differences in perception on how fast Romney was “closing the deal” vs McCain were 100% due to the elongated calendar. When you look at things by % of delegates accumulated vs % of delegates allocated, the two years track each other very closely. In the early days of the campaign (before about 20% of the delegates) Romney was actually a bit ahead of McCain’s pace. From there though 50% or so, Romney was slightly behind McCain’s pace. The key word being slightly. And now they once again very closely match.
So that whole narrative about Romney not matching McCain’s performance in 2008… just completely not true in terms of the delegate races. It just seemed that way because everything happened in a comparatively compressed timeframe in 2008.
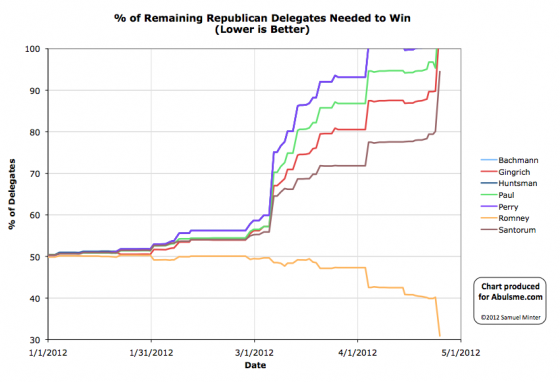
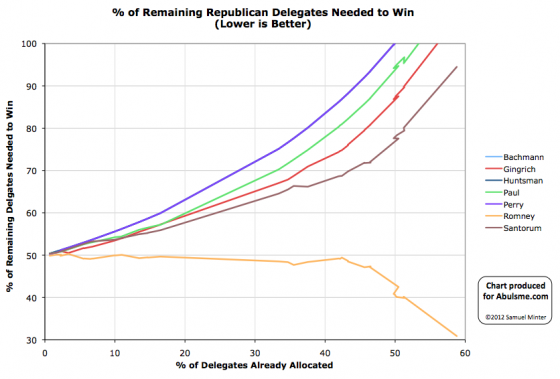
Charts from the Abulsme.com 2012 Republican Delegate Count Graphs page. When a candidate gets down to 0%, they have clinched the nomination. If they get above 100%, they have been mathematically eliminated. The first chart is by date, the second is by “% of Delegates Already Allocated”. These numbers include estimates of the eventual results of multi-stage caucus processes which will be refined as the later stages occur.
First big primary day in awhile, and of course Romney dominates.
- New York: Romney gets all 92 delegates from today. Total in NY now Romney 94, Gingrich 1
- Pennsylvania: This is the only tricky one of the day. Delegates were elected by name, not by presidential preference. So they are all officially uncommitted, but in general these delegates do support someone, it just takes more work to figure out who. Green Papers’ initial estimate from the primary is Romney +11, Paul +5, Gingrich +4, Santorum +3, and 39 uncommitted or unknown. That is obviously a lot of uncommitted/unknown, so there will probably be future updates as the preferences of those delegates become known. Also 10 at-large delegates won’t be chosen until June and two superdelegates have yet to publicly express a preference. The total in PA is now Romney 12, Paul 5, Gingrich 4, Santorum 3, TBD 48. (GP has Romney 11, TBD 49, but I think they forgot the one Romney superdelegate.)
- Connecticut: Romney wins all 25 delegates from the primary. New CT total: Romney 26, TBD 2
- Rhode Island: Romney gets 12 delegates from the primary, Paul gets 4. New RI Total: Romney 15, Paul 4
- Delaware: Romney gets all 17 delegates from the primary. No delegates had been allocated previously and none are left, so total is just Romney 17
So, for the day… Romney +157, Paul +9, Gingrich +4, Santorum +3. Romney gets 90.8% of the delegates today. Way more than the 40.2% he needed to stay on track to get to 1144.
And with this, Ron Paul and Newt Gingrich are both mathematically eliminated. More specifically, if they were now to get 100% of the remaining delegates they would still not get to 1144. In order to get to 1144, they would actually need to take delegates away from the other candidates, either through final results in caucus states being better for them than earlier estimates, or through actual defections. Both are possible. However, neither will happen in large enough numbers to change anything, absent something catastrophic that causes Romney to actually drop out. Uh, which is highly unlikely.
For the remaining two candidates, in terms of “% of remaining delegates needed to win”:
- Romney: 40.2% -> 30.9%
- Santorum: 80.1% -> 94.5%
So, theoretically Santorum could still catch up and win by getting 95% of the remaining delegates. Needless to say that won’t happen. His already long odds were made worse by suspending his campaign.
Meanwhile, neither Gingrich or Paul have suspended their campaigns. There are indications Gingrich might do so soon despite previous vows to stay in until Tampa. Paul has shown no signs of stopping.
The 31% of the remaining delegates Romney needs to wrap this up should be very easy for him to get. But we still have to wait for the calendar. So the march goes on…
Update 2012 Apr 27 12:34 UTC:
I was incorrect about the Pennsylvania count above and had misread Green Paper’s statement. In fact the new total in Pennsylvania was indeed Romney 11, not Romney 12. There were 10 new Romey delegates added to the count, not 11. They did not forget the one superdelegate. I just got twisted around thinking the 11 was a delta from the election instead of a new total, which would have left one delegate out. But it was indeed the new new total.
This makes the total for this day Romney +156, Paul +9, Gingrich +4, Santorum +3.
That gives Romney 90.7% of the delegates for the day instead of 90.8%.
This also changes Romney’s “% needed to win” to 31.0% instead of 30.9%. Santorum’s becomes 94.4% instead of 94.5%.
These changes are too small to be visible on the graph above, but will be reflected on future updates.
|
|


