While there are still speeches yet to come, and a few more things my happen at the Republican National Convention, the actual nomination is now complete. The Republicans officially have a nominee. So time to review the final results of the delegate race.
| Stage | Bachma. | Gingri. | Huntsm. | Paul | Perry | Romney | Santor. | Roemer | NV/U |
|---|---|---|---|---|---|---|---|---|---|
| Peak | 2 | 159 | 2 | 173 | 6 | 1571 | 268 | 0 | |
| Final Est | 1 | 142 | 0 | 173 | 0 | 1555 | 247 | 0 | 168 |
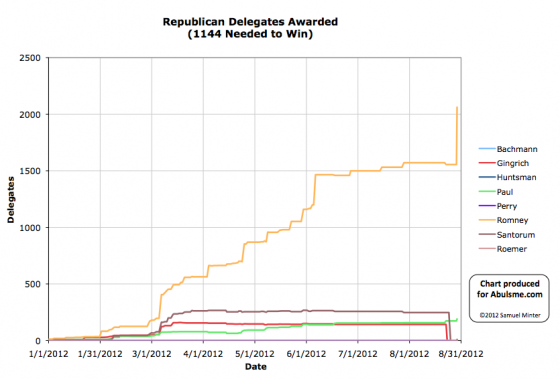
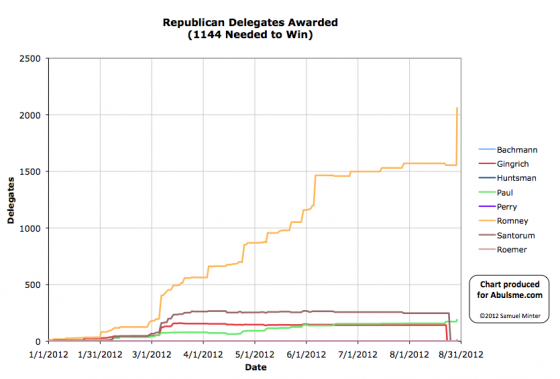
| Roll Call | 1 | 0 | 1 | 190 | 0 | 2061 | 9 | 1 | 23 |
| Official | 0 | 0 | 0 | 0 | 0 | 2061 | 0 | 0 | 255 |
Peak represents the highest delegate estimate the candidate had during the primary season (not counting the final convention results).
The final estimates reflect the best estimates used here as of the “end” of the primary season. Specifically these is the estimate on August 22nd 2012, right before Gingrich and Santorum released their delegates. These released delegates were then free to vote for whoever they wanted in the Roll Call.
The roll call represents the count of the votes verbally given by the states at the Roll Call at the convention on August 28th 2012. (There were five votes in Pennsylvania that some reported as going to Paul Ryan, others have said the speaker said “Paul, Ron”. I believe these were intended for Ron Paul, so have counted them as such.)
The official count represents the vote as recorded by the convention. Romney was the only candidate who was officially nominated and seconded at the convention, so therefore was the only candidate who could officially receive votes and have them registered. Officially any votes for anybody else were equivalent to abstentions.
Lots more details on the final results of the full process can be found on the Results of the 2012 Republican Party presidential primaries page on Wikipedia, Green Papers (including totals), and DCW.
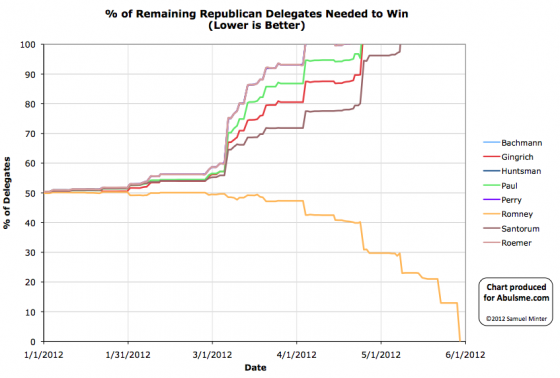
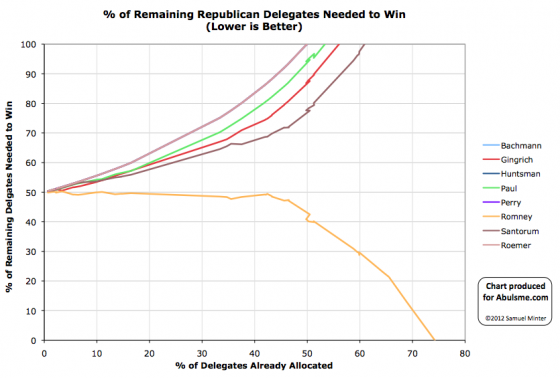
Note: Charts from the Abulsme.com 2012 Republican Delegate Count Graphs page. The first and second charts represent the % of remaining delegates the candidates needed in order to reach 1144 and win the nomination. Going above 100% represented being mathematically eliminated, dropping to 0% represented “clinching” the nomination. The first chart shows this by date, while the second shows this by % of the delegates determined so far. The third chart is the % of delegates the candidate has collected. The fourth is the actual number of delegates. These numbers include estimates of the eventual results of multi-stage caucus processes as those estimates were refined over time. The final data point represents the roll call count, not the official results which only counted votes for Romney.
[Edit 2012 Aug 29 14:59 to add two more charts and revise the final note.]
[Edit 2012 Aug 29 15:42 to add links to sources for more info.]


