| In the latest Curmudgeon’s Corner…
Sam and Ivan talk about:
Just click to listen now: [wpaudio url=”http://www.abulsme.com/CurmudgeonsCorner/cc20120219.mp3″ text=”Recorded 19 Feb 2012″] or |
 |
So… Iowa… that was exciting, wasn’t it? Romney wins by 8 votes over Santorum who surged ahead of Paul at the last minute. Romney’s total was also exactly 6 votes less than he did in the state in 2008. Fun. Anyway, that voting is just a non-binding preference poll. The real action was not covered at all basically, which was the election of delegates to the county conventions, which will in turn elect delegates to the state convention, which will in turn elect the actual delegates to the Republican National Convention. I have seen no reporting on the actual people elected as county delegates or what their presidential preferences are. Of course, even if there was such reporting, it is non-binding. But educated estimates can be made. I’m going by the estimates at thegreenpapers.com. They explain their methodology on their site. In any case, based on the Iowa results tonight, they estimate that the following delegates will eventually be won once the full process completes in June.
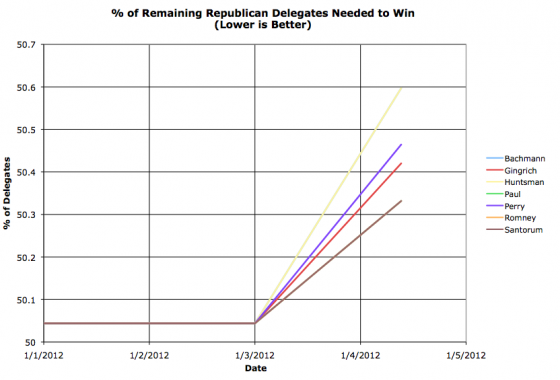
This is of course subject to change, as generally by the time we get to June, the delegates will be chosen based on the state of the race in June (most likely fully decided) rather than the results of the balloting that happened way back in January. But it is the best estimate at the moment. Based on this, we generate the first meaningful update to this season’s graph. Remember, this is the percentage of remaining delegates each candidate needs to win, so LOWER is better on this chart. Since nobody actually took a majority, everybody actually goes UP today, so winning has actually gotten HARDER for everybody… but the people who did the best go up the least and are the best off. The Brown line represents the three leaders, Romney/Santorum/Paul who at this point each need 50.33% of the remaining delegates to win. Then Gingrich in red needing 50.42%, Perry in purple needing 50.46%. Bringing up the rear on the yellow line we have Bachmann and Huntsman needing 50.60% of the remaining vote to catch up and win. We have guestimated 1.09% of the delegates available tonight. 25 delegates out of 2286 total. And of course we haven’t ACTUALLY awarded ANY delegates yet. So this is all really just about starting to build momentum. The numbers are still tiny compared with what is to come. But the process has begun! Next up… New Hampshire with another 12 delegates next week. Woo! Romney is currently way ahead of the pack in the polls there, but still at less than a majority, but he’ll most likely pull away from Paul and Santorum there. And then there is South Carolina… then Florida… and then… and then… hopefully this will stay interesting for a decent bit of time, but you’ll be able to quickly tell as the race narrows. Once a candidate’s % Needed number starts dropping significantly below the % of the delegates they actually have so far you know they are building the kind of lead would take a major collapse to stop. (At the moment Romney/Santorum/Paul have 24.00% of the delegates each, but need 50.33% to win, so the three leads are nowhere near that point yet.)
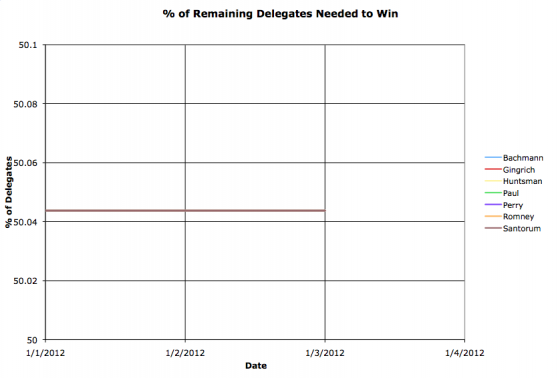
With mere hours left until the Iowa caucuses begin, it is time for election graphs! As with the last cycle, I will be producing updated graphs as the primary season goes on. I will post blog entries when there are significant updates, but the wiki page with all the details will always be on the AbulWiki at 2012 Presidential Delegate Graphs. You will find delegate counts everywhere as the days progress (assuming the Republican race doesn’t resolve itself nearly instantly) but the added value I think I have on my charts as opposed to elsewhere is that I will be concentrating on the percentage of remaining delegates needed to win outright. Last time around looking at the race this way rather than simply at delegate counts or percentage of delegates allocated so far let you see fairly clearly that Clinton’s chances against Obama had become essentially zero long before the general media finally admitted it. They hung on to the horserace story long past the point that the math made any Clinton catch up scenario reliant on incredible miracles. In any case, as of the best information I have at the moment, there will be 2286 delegates to the Republican National Convention. That means 1143 will give you a tie, but you will need 1144 for an outright win. So at the moment, prior to any delegates being awarded, each of the 7 major candidates still in the race need 50.044% percent of the outstanding delegates to win the Republican nomination. And the race is on! (Note 1: Since there is no significant challenger to Obama on the Democratic side, I’m not going to produce the graphs showing him marching inexorably to the nomination… if the no competition situation on the Democratic side changes unexpectedly, I’ll of course start to map out the race on that side too.) (Note 2: You may remember that last time around I did general election prediction charts based on the electoral college and state by state polling. These will be coming soon as well. Gulp. That was a lot of work last time around. :-) )
|
||||||||||||||

