This is the website of Abulsme Noibatno Itramne (also known as Sam Minter). Posts here are rare these days. For current stuff, follow me on Mastodon

Categories

Calendar

January 2025
S M T W T F S
 1234
567891011
12131415161718
19202122232425
262728293031  

Congressional Velocity (September 2013 Update)

It has been a bit over 3 months since I did my last “Congressional Velocity” comparison between the 113th congress and the 112th (and 111th) back in June. So time to do it again.

Specifically though, I was prompted by reading an article by Ezra Klein about the current congressional standoffs headlined “John Boehner’s Congress is a train wreck“. It seems like it probably is. I have no quibbles about that, but Klein also included this bit:

The data tells the same story. So far, the 113th Congress has passed 36 public laws. For comparison, the 112th Congress — the least productive Congress since we began keeping records — passed 283 public laws. At this rate, the 113th Congress is on track to be, by far, the least productive Congress on record.

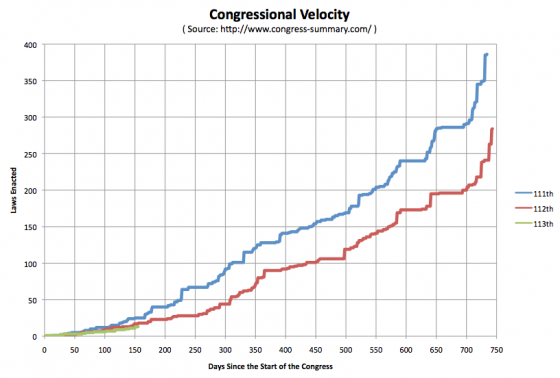
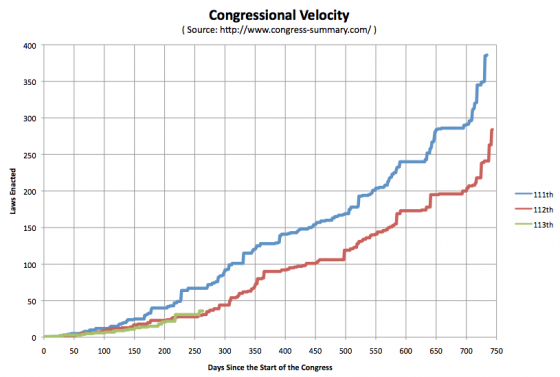
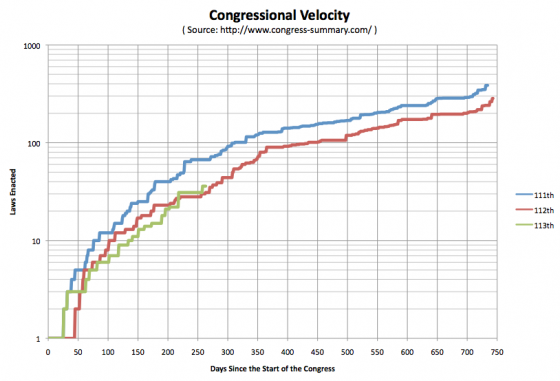
And here I quibble. Not in the way Boehner does, saying this isn’t a good metric. But just to point out that actually, at this very moment, the 113th is actually AHEAD of where the 112th was at the comparable time. Lets look at the charts:

Screen Shot 2013-09-23 at 05.10.38712

Screen Shot 2013-09-23 at 05.17.54913

The 113th WAS on pace to be slower than the 112th… until August 9th, when the president signed 9 bills into law, and the 113th pulled ahead. The 113th has kept that “lead” since then.

Unless there were some laws signed in the last few days that aren’t posted on the White House website or my usual source at congress-summary.com yet, as of September 22nd, the 113th Congress is responsible for 36 public laws, while at the same point in 2011, the 112th had only managed 31.

Now, they may well fall behind again, they aren’t THAT far ahead after all. Certainly neither the 113th or 112th are anywhere near where the 111th was (67 by this point). But for the moment, “At this rate, the 113th Congress is on track to be, by far, the least productive Congress on record.” isn’t actually quite right. The 112th was slightly worse at this point in the cycle.

At least on this particular metric.

[Minor corrections and wording changes 06:30 UTC.]

Congressional Velocity (June 2013 Update)

In our annual predictions show for 2013 one of the items Ivan and I disagreed on was if the 113th congress would enact laws at a higher or lower velocity than the 112th. (Enact of course meaning passed by both houses of Congress and signed by the President.)

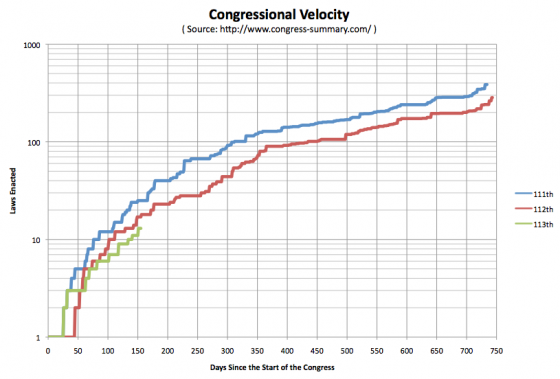
So I have started to track that. Here are the charts so far (one with a linear scale, one with a log scale to better show the early detail):

Screen Shot 2013-06-07 at 13.58.36482

Screen Shot 2013-06-07 at 13.59.00760

Minus any new laws recently signed that might not have made it to my source at congress-summary.com yet, as of 155 days into each of the three Congresses (that would be June 7th of the first year in all three cases) we have the 111th having 25 laws enacted, the 112th having 17 laws enacted, and the 113th having 13 laws enacted.

It is interesting to note the somewhat similar patterns in the shapes of the curves, indicating that although the velocity may be different, there seems to be a nice pattern to how Congress ramps up, when it takes breaks, when it speeds up and does more, etc. Bursts around holidays and in the lame duck period, lulls during the summer, bigger lull in the run up to elections, etc. (Of course, to really examine this, you’d need to look at more than 3 congresses, the similarities may not bear out with robust scrutiny.)

So far I am correct in my prediction that the 113th would enact fewer laws than the 112th. But there is still plenty of time before the end of the year for this to change and for Ivan to be proven right instead.

At the moment I am not making any statement on if that is a good or a bad thing. :-)

100 Years of Context

With all the talk of demographic trends favoring the democrats I thought I would just pull some really long term past data and see what the trends look like.

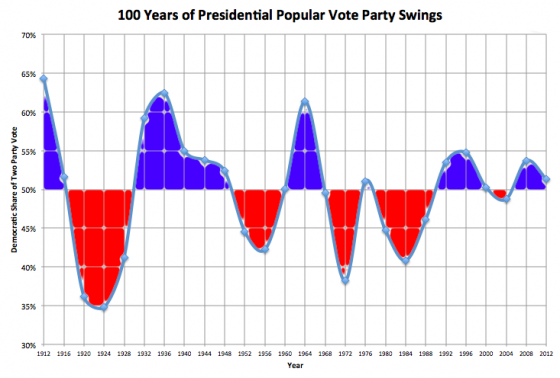
The chart above is the Democratic percentage of the Republican/Democratic popular vote. That is, it leaves out third parties, even though they were significant in some of these years. And even though I generally prefer looking at the electoral college in Presidential elections, for this purpose popular vote seemed better.

The one thing that immediately stands out to me is actually not a trend toward Democrats, but a “dampening” effect. The numbers were so much more volatile prior to 1976.

I’ll skip the big 1912 to 1924 swing because 1912 was an oddball election… the Republicans actually came in third behind the Democrats and Progressives.

But looking further on for examples, we went from Calvin Coolidge (R) blowing out John Davis (D) in 1924 by a 65.2% to 34.8% margin, to Franklin Roosevelt (D) crushing Alfred Landon (R) by a 62.5% to 37.5% margin only 12 years later. That is a LOT of people flipping from Republican to Democrat. Now, admittedly, there was a little thing called the Great Depression that probably caused that swing. But still, it is a HUGE number of people moving from one party to the other compared to what seems possible today.

A slightly more recent big swing… In 1964 Johnson (D) beat Goldwater (R) 61.3% to 38.7%. Only 8 years later in 1972, Nixon (R) beat McGovern (D) 61.8% to 38.2%. Again, there was a major event, the Vietnam War, that could explain this, but this still represents a HUGE number of people switching parties. Not just demographic trends, but people actively switching their support.

In addition to big swings, margins in general tended to be bigger.

From 1912 to 1984, 13 of 19 elections… over 2/3 of the elections… were won by margins greater than 10%. The last time that happened was Reagan’s 1984 win over Mondale. We have now gone 7 elections in a row where the elections were one by less than a 10% margin.

Of those 7 elections since Reagan, the margin was less than 3% three times. From Woodrow Wilson in 1912 to Ronald Reagan in 1984, there were also only three elections… out of 19 elections… with a margin under 3%. (That would be 1960, 1968 and 1976.) Elections this close used to be really rare. They aren’t the “norm” now, 1988, 1992, 1996, and 2008 were all won by more than 7%, but under 3% is certainly no longer rare.

Now what about that trend toward the Democrats? Now, looking at the full 100 years, the oscillation between the parties and the reduction in volatility is the biggest thing you notice, but you could argue that the politics and issues and how the parties were aligned was dramatically different prior to the 1970s. So, if you look selectively just at 1972 onward, you do see a trend toward the Democrats.

In the 70’s and 80’s you had big Republican wins and the only Democratic win was a squeaker.

In the 90’s and 00’s you had smaller Democratic wins, with the only Republican wins being a popular vote loss in 2000 which was won in the electoral college, and a narrow win in 2004.

If you change your starting point though, and look just since the 1990’s, the trend is (slightly) back toward the Republicans. Obama’s two wins were by smaller margins than Clinton’s wins.

The demographic trends DO seem to be against the Republicans at the moment given how party preferences have been breaking down by ethnic group. But…

The important thing to remember however is that parties change over time. The Republicans of 2012 are nothing like the Republicans of 1988. And the Republicans of 1988 didn’t look much like the Republicans of 1964.

How much any demographic trends affect future presidential races will depend a lot on the internal dynamics of both parties, and who they nominate, and if the parties start shifting around as they do periodically. If the Republicans figure out how to embrace rather than alienate the non-white groups that are growing rapidly, then they will be able to blunt or reverse any demographic trends.

Or we could have a major event like the Great Depression or the Vietnam war that returns us to the days of huge landslides for whichever party is NOT blamed for the bad event, with huge swings between the parties in short periods of times.

We’ve been in a period of relatively close elections, with relatively little volatility between elections. That seems to be unusual looking back at the last 100 years. It could be the new “normal” that lasts another 50 years. But it just as easily could be an anomaly, and we’ll return to “normal” soon.

As usual, past performance is not indicative of future results, but it is fun to look back at the longer term history for some context.
Curmudgeon’s Corner: The Nutjob Vote

In the latest Curmudgeon’s Corner…

Sam and Ivan talk about:

  • HP Gives Up
  • Google Moto
  • Republican Race

Just click to listen now:

[wpaudio url=”http://www.abulsme.com/CurmudgeonsCorner/CC20110821.mp3″ text=”Recorded 21 Aug 2011″]

or

1-Click Subscribe in iTunes

View Podcast in iTunes

View XML Feed

In the Realm

In the latest Curmudgeon’s Corner… 

Sam and Ivan talk about:

  • Presidential Power
  • IBM / RIM
  • New York Post
  • Real Estate Market / Inflation

Just click to listen now:

[wpaudio url=”http://www.abulsme.com/CurmudgeonsCorner/CC20110619.mp3″ text=”Recorded 19 Jun 2011″]

or

1-Click Subscribe in iTunes

View Podcast in iTunes

View XML Feed

No Bleeding Eyes

In the latest Curmudgeon’s Corner… 

Sam and Ivan talk about:

  • Taxes
  • Federal Budget
  • Libya

Just click to listen now:

[wpaudio url=”http://www.abulsme.com/CurmudgeonsCorner/CC20110417.mp3″ text=”Recorded 17 Apr 2011″]

or

1-Click Subscribe in iTunes

View Podcast in iTunes

View XML Feed

The Last Resort

In the latest Curmudgeon’s Corner… 

Sam and Ivan talk about:

  • Feedback
  • Libya
  • Presidential Candidates
  • New Media Models

Just click to listen now:

[wpaudio url=”http://www.abulsme.com/CurmudgeonsCorner/CC20110403.mp3″ text=”Recorded 3 Apr 2011″]

or

1-Click Subscribe in iTunes

View Podcast in iTunes

View XML Feed