This is the website of Abulsme Noibatno Itramne (also known as Sam Minter).
Posts here are rare these days. For current stuff, follow me on Mastodon
|
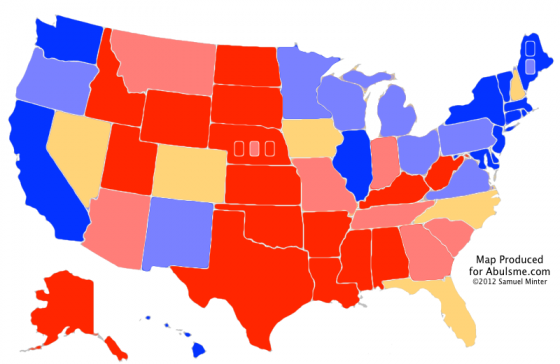
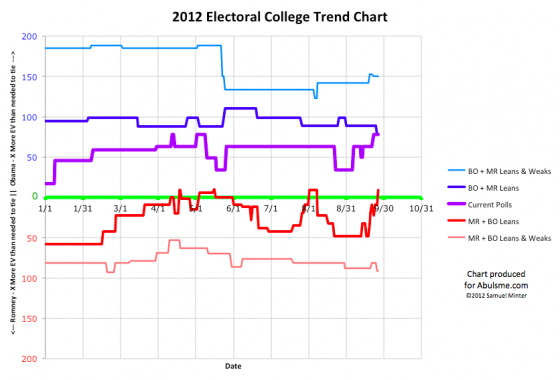
Only one state changes category today, but it is an important one, as Obama’s lead in Ohio hits 5%:
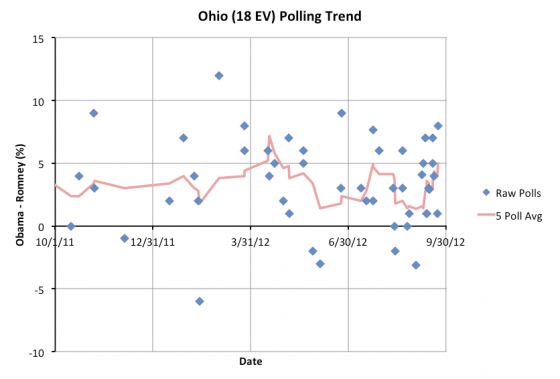
With the additions today, the five poll average in Ohio is an Obama lead of EXACTLY 5.0%. I define the “Weak Obama” category as 5% and above though, so this is enough to move the state to the new category. It is right on the edge though. The next day of polls could easily reverse this change. The trend in the last couple weeks has been the opposite, but this could change at any time. For the moment though, it looks like Ohio is moving away from Romney. Obama’s lead is now big enough that my models no longer include the possibility of Romney winning Ohio.
This leaves Romney in a very bad spot:
|
Romney |
Obama |
| Romney Best Case |
260 |
278 |
| Current Status |
191 |
347 |
| Obama Best Case |
191 |
347 |
So, even if Romney wins EVERY CLOSE STATE (all of which he is currently behind in), he would still lose to Obama 260 to 278.
This is of course “if the election was held today”… and the election is not being held today. But it is still worth repeating:
Romney can win every state that is even remotely close, and it is still not enough. HE STILL LOSES.
This is the 4th time this year that Romney’s “best case” has been this bad. In each of the previous cases, Romney has subsequently pulled back some of the states where Obama is ahead by more than 5% and made them somewhat competitive again. He hasn’t actually managed to pull enough of them over the line to his side to ever be in the lead in the electoral college, but he has at least managed to make enough states close that he could win if he swept those close states.
So now of course the question is: Can he do it again? Can Romney fight back and make some more states close again? Pennsylvania (20), Ohio (18), Michigan (16), Virginia (13), Minnesota (10), Wisconsin (10), Oregon (7), New Mexico (5) and Maine’s 2nd Congressional District (1) are the areas where Obama’s lead is between 5% and 10%. Some of those are probably permanently out of reach. But perhaps Romney can make some of them into a battle again with a massive advertising blitz? Perhaps with the help of a few big stumbles by Obama?
I don’t think it can happen without big stumbles by Obama. Romney stopping his tendency to put his foot in his mouth and starting to run a disciplined and competent campaign wouldn’t be enough. He needs Obama to screw up.
And even then, can he get past making a few more states close to actually starting to take the lead in some of these states? Let alone enough of them to win the Presidency?
It seems unlikely. The scenarios that result in Romney catching up and winning seem more and more far fetched by the day. To be clear, a Romney win is NOT impossible. It could happen. It is just getting less and less likely as time goes on. Obama’s lead is increasing, and Romney is running out of time to catch up.
Romney supporters seem to be pushing two main lines of thoughts on how Romney can still win:
First off, we still have the debates. Sometimes the debates can drive big changes they say. But everything I’ve been reading over the past couple months with regard to research on this subject says that debates very rarely move the polls any significant amount. Certainly not by a big enough amount to make up this kind of deficit. (Tales of a major reversal of fortune in the Carter/Reagan race after the final debate have been very effectively debunked by several people. It is basically an urban legend driven by looking at one set of polls while ignoring all the others.) Could Obama come out, have a nervous breakdown, start walking in circles and clucking like a chicken on live national television and thereby completely blow his lead? Well, yes, something of that magnitude could do it. But assuming a basically competent debate performance by Obama, even if Romney “wins” debates, it is hard to see them giving Romney the boost he would need to win.
Second of all, more and more you hear the argument that the polls must be wrong. That there is a systematic pro-Democratic bias in the polls, and Romney is really doing much better than the polls would indicate, and because Republicans are more motivated, they will have higher turnout and therefore win. The only thing to say here is that as long as you are looking at poll averages and not any particular pollster, the house effects leaning one direction or another basically get averaged out. Also, for the most part even the pollsters that have a partisan alignment are actually motivated to structure their polls to produce results that match the actual outcomes in the end. Even a highly partisan pollster would try to correct a systematic bias in their results if they found one, because it translates into lower predictive value for their polls, which makes them less valuable. Finally, there is just the historical record. People who have convinced themselves that the polls just must be wrong have tended to be disappointed much more often than they’ve ended up being right.
So how lopsided does this matchup need to look at this stage in the game to start just saying outright that absent an event of cosmic proportions the race is over and Obama will certainly win? We are very very close. It is tempting to just say so right now. But I will hold off a little bit.
But if Romney’s best case gets ANY worse… or if there is no major move in Romney’s direction starting in the next week or two… then it will be very difficult to construct Romney win scenarios with a straight face…
…OK, really, it is already very difficult to construct those scenarios. Can he make it closer than it looks today? Sure. Can he move things enough to actually win? That is looking pretty far fetched at the moment. I’ll hold off saying “it is over” for a couple weeks to give Romney a chance to figure out the miracle he needs. Maybe he’ll be able to find and execute on said miracle. Maybe.
Note: Chart and map from the Abulsme.com 2012 Electoral College Prediction page. Both assume Obama vs Romney with no strong third party candidate and show polling as it currently exists. Things will change before election day. On the map red is Romney, blue is Obama, gold states are too close to call. Lines on the chart represent how many more electoral votes a candidate would have than is needed to tie under several different scenarios. Up is good for Obama, Down is good for Romney.
(Edit 2012 Sep 27 15:28 to add final note.)
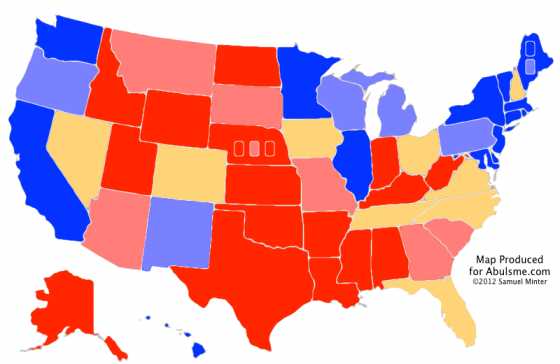
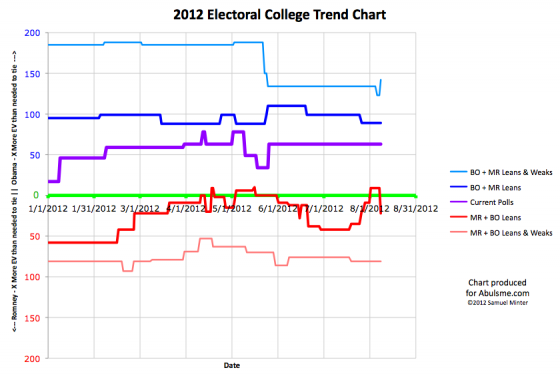
Chart and map from the Abulsme.com 2012 Electoral College Prediction page. Both assume Obama vs Romney with no strong third party candidate and show polling as it currently exists. Things will change before election day. On the map red is Romney, blue is Obama, gold states are too close to call. Lines on the chart represent how many more electoral votes a candidate would have than is needed to tie under several different scenarios. Up is good for Obama, Down is good for Romney.
Four states change categories today. In all four cases, the races look a little closer than they did. The impact is different in these cases, so lets look at each one. In order from the smallest number of electoral votes to the greatest…
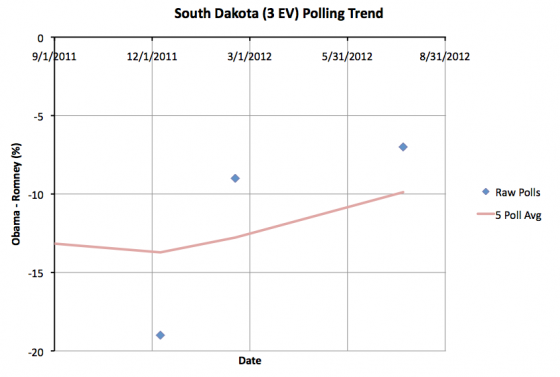
South Dakota (3 ev): South Dakota has been very sparsely polled. The poll added today is only the 3rd one in the last year and only the 4th since the 2008 election. With this update the 5 poll average (which includes the 2008 election to fill out the average) drops to a Romney lead of 9.9%. This is less than the 10% threshold I use, so I move the state from “Strong Romney” to “Weak Romney”. But obviously South Dakota is nowhere close to being a competitive state. It would take a move of epic proportions to actually make South Dakota a competitive state. But the three polls this year do seem to show that Romney’s lead is a bit less than it once was.
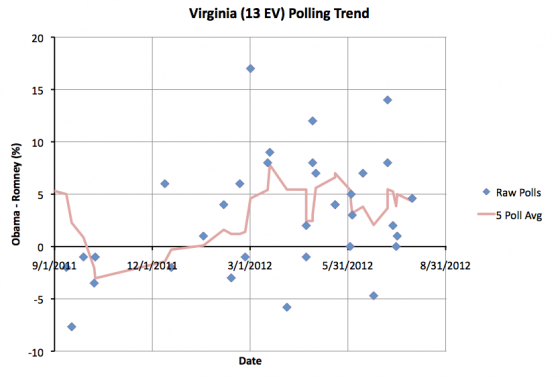
Virginia (13 ev): Obama’s lead in the five poll average had touched 5%, moving it out of the close state category, but it didn’t last. The latest poll added to the average brings Obama’s lead back down to 4.3%. This means Virginia is once again one of the states I consider close enough that it could easily go either way depending on the events of the campaign. This will improve Romney’s “Best Case” in my models. Virginia has been close for most of the last year so it is not surprising to see it here again.
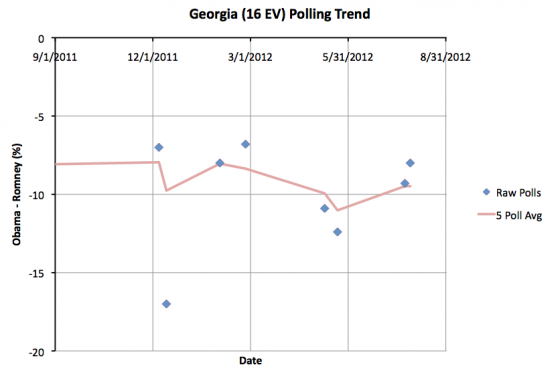
Georgia (16 ev): With two new polls added today, Romney’s lead in Georgia drops to 9.5%. Since this is below 10%, we move the state to “Weak Romney”. As with South Dakota, this is still a pretty substantial lead, and absent a major Romney collapse, it is unlikely to see Georgia actually become a competitive close state. But it is once again in the category where perhaps Romney shouldn’t take it completely for granted. Well, OK, he mostly can. But his margins do look a little bit less than they did before.
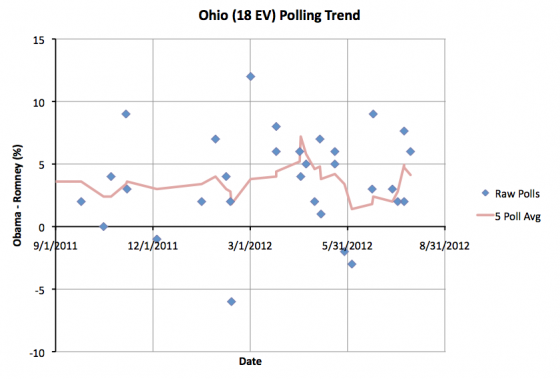
Ohio (18 ev): Along with Virginia, this is the other one that “matters” to the model. In my August 1st update the 5 poll average in Ohio jumped to 5.5%, moving it out of my swing state category. In today’s update we add a new poll… actually one that ended back on July 24th, prior to the last poll included in my last update, but which I just found (via Darryl at HorsesAss) so it counts for today*… and that new poll pulls Obama’s lead back down to 4.1%. So after the brief interlude as a blue state, Ohio is once again where it has been most of the year… with an Obama advantage, but not a huge one. So it is easy to imagine scenarios where Romney pulls it back over onto his side of the fence.
When you add up the changes in these four states, what do you get?
Well, South Dakota and Georgia really don’t change anything. For those two states, it isn’t about who will win, it is just about how much Romney will win by… which really doesn’t matter.
Virginia and Ohio on the other hand… they matter, and they are pretty big states. With both of these states on the table again, Romney’s best case improves considerably:
|
Romney |
Obama |
| Romney Best Case |
291 |
247 |
| Current Status |
206 |
332 |
| Obama Best Case |
180 |
358 |
With this new configuration, Florida (29 ev) is a must win state. Romney can’t win without it. He could lose any one of Ohio (18 ev), North Carolina (15 ev), Virginia (13 ev) or Tennessee (11 ev), but only one of them. Colorado (9 ev), Iowa (6 ev), Nevada (6 ev) and New Hampshire are more flexible. There are a number of different “paths to victory” here now.
Now, most of these states (all but North Carolina and Tennessee) are ones where Obama has the lead at the moment, even if it is a small lead. To actually win, Romney has to actually start pulling ahead in some of these states rather than just reducing Obama’s lead.
That may be next. With a VP announcement “any time now” and the Republican Convention just around the corner, movement toward Romney should probably be expected. The questions will be: “How much movement?” and “Does it last?”.
(Spoilers: Convention bounces usually last about a week before things revert to where they were before, and VP choices only rarely end up making a difference.)
* If there is anybody who cares about the details and wonders why I didn’t do a retroactive adjustment of the historical graphs because I included an older poll that changed things, here is a long geeky explanation of my process: Basically, if you judge by the “end date” of the polls, polls come in out of order all the time. It takes pollsters a few days to compile and release their data, then sometimes it take a bit before it shows up on one of the three sources I use to collect poll data. If a new poll is within the “Last 5”, then I just treat it as current new data, regardless of the end date on the poll and if it is really the most recent to end. In this case, the poll wasn’t the newest, but it was the second newest. The last two polls had just gotten to me in reverse order, which happens pretty frequently. It is a little unusual that by the time I included it, the poll end date was about two weeks old, but it was still the second most recent poll. So it just got folded into the average normally. If I become aware of polls that are older than the Last 5, and those polls would have changed the category of any states, then I’ll fold a correction into my next update. Also while I’m giving esoteric details… The historical electoral college trend lines are based on the date new polls are included in my model (except when polls older than the most recent 5 are added), while the state polling trend chart uses the end date of the polls, which means they don’t always match exactly. So, for instance, the peak over 5% in Ohio has indeed disappeared with this new poll, instead now only peaking at 4.9%. The end dates of the polls are also used to determine just which polls are in the “Last 5” to begin with. In the case of multiple polls with the same end date, the tie breaker is the time they were added to my model.
Edit: 2012 Aug 8 08:15 to add that last parenthetical.
Edit: 2012 Aug 8 16:31 to add * note.
Edit: 2012 Aug 8 17:50 to correct one detail on the * note.
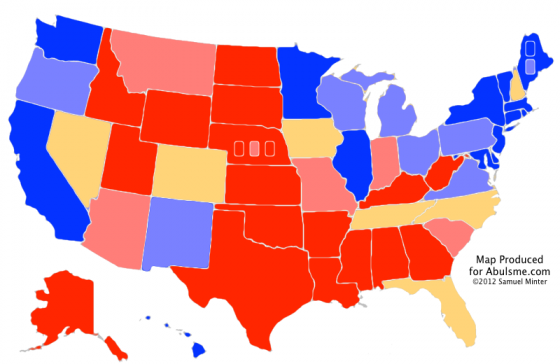
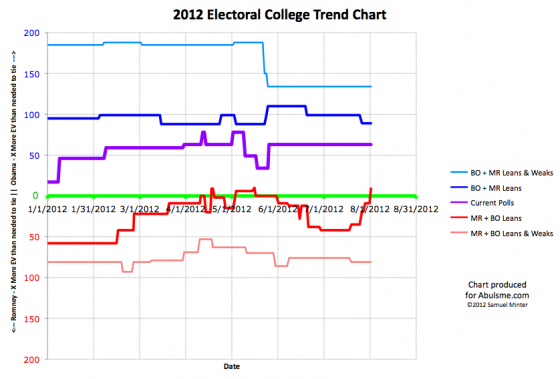
Chart and map from the Abulsme.com 2012 Electoral College Prediction page. Both assume Obama vs Romney with no strong third party candidate and show polling as it currently exists. Things will change before election day. On the map red is Romney, blue is Obama, gold states are too close to call. Lines on the chart represent how many more electoral votes a candidate would have than is needed to tie under several different scenarios. Up is good for Obama, Down is good for Romney.
One state moves today. A big state, an important state.
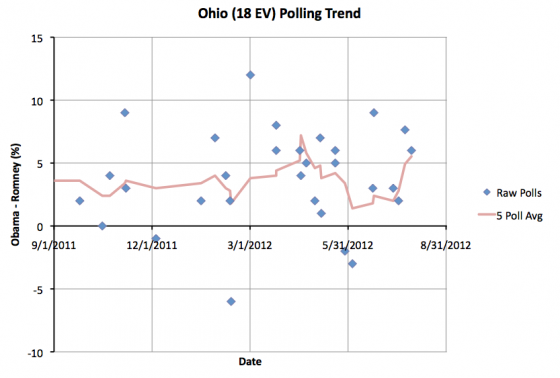
Ohio has 18 electoral votes. In the last year, Romney has never been ahead in the 5 poll average in Ohio, although there have been a smattering of individual polls showing him in the lead (the last one in June). But for most of the last year the polls have shown Ohio with only a narrow Obama lead… a less than 5% lead that put it within reach for Romney. The right things happen, good campaigning, bad news cycle for Obama, whatever, and you could see it pulling over the line to Romney.
The last few polls have been quite favorable to Obama though, and Obama’s lead in Ohio now climbs to 5.5%. So I paint the state light blue, and remove it from the list of close states that I include in Romney’s “Best Case”. Ohio may not stay here. The next poll could pull this back in Romney’s direction. But for the moment, Ohio looks like a blue state.
So where does this put us?
|
Romney |
Obama |
| Romney Best Case |
260 |
278 |
| Current Status |
206 |
332 |
| Obama Best Case |
180 |
358 |
Yup, that is right. For the third time since I’ve been tracking*, if Romney wins all the states he is clearly ahead in, plus all the close states, including the ones Obama is ahead in… he still loses. Put another way, Obama can afford to lose every single state that is “close” in the polls, and he will still win 278 to 260.
In a quick comparison to 2008, McCain didn’t get to this bad a position in the polls until October, Romney has been there three times so far in my model. Now… each time he has subsequently improved his position… he hasn’t stayed in this kind of dire strait for too long. But rather than those being permanent moves to make the race more competitive, both times the gains Romney made have eventually eroded away, and we end up back here with his best case being to lose.
Yes, yes. We have three months to go. We have conventions coming up. Most “normal” people won’t start paying attention until the fall. Indeed. All this is true. It is not yet time to call a winner. Not by any means. But… Romney has a lot of work to do if he wants to win this. His current position just doesn’t look good at all.
(Or, as we’ve said on the podcast, Obama has to screw up badly, that will also do the trick.)
* The second time did not appear on my charts when it happened. My charts back then showed Romney with a slight lead in his best case, but this lead disappeared when I later added a Virginia poll I’d missed originally.
Edit 2012 Aug 1 15:40 to add the last parenthetical and the note about the second time Romney’s best case was to lose.
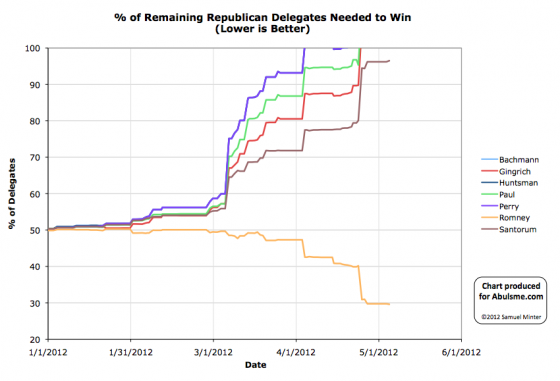
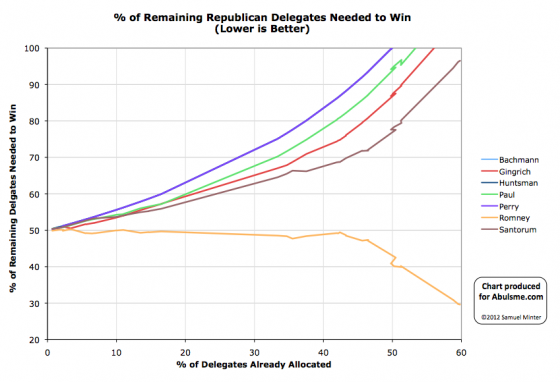
Charts from the Abulsme.com 2012 Republican Delegate Count Graphs page. When a candidate gets down to 0%, they have clinched the nomination. If they get above 100%, they have been mathematically eliminated. The first chart is by date, the second is by “% of Delegates Already Allocated”. These numbers include estimates of the eventual results of multi-stage caucus processes which will be refined as the later stages occur.
If you remember, in Ohio Santorum did not file all the right paperwork to have actual human delegates designated to fill the slots he might win in some parts of the state. There were four delegate positions that Santorum won, but wasn’t going to be able to claim because of that. Well, it looks like the Romney folks decided to be nice and not challenge Santorum’s ability to retroactively fill those four delegate slots. So Santorum will get those four delegates after all. So Santorum +4 in Ohio.
Meanwhile, DCW adjusts their Superdelegate Count. One Alabama super switches from Santorum to Romney. And then Romney gains two more previously undeclared supers, one from Alabama and one from South Dakota.
Net for the day, Romney +3, Santorum +3. At 50%, this is of course well over the 29.7% of the delegates Romney needs to be tracking to in order to clinch the nomination.
In terms of “% of remaining needed to win”:
- Romney: 29.7% -> 29.6%
- Santorum: 96.2% -> 96.5%
Next real contests on Tuesday.
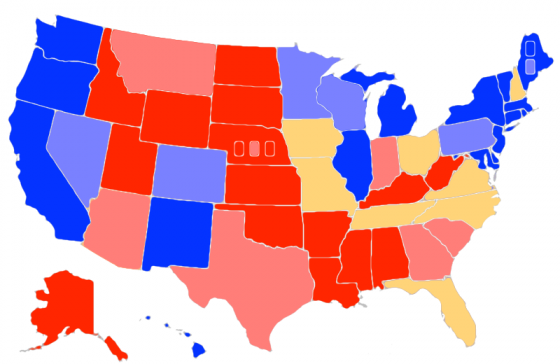
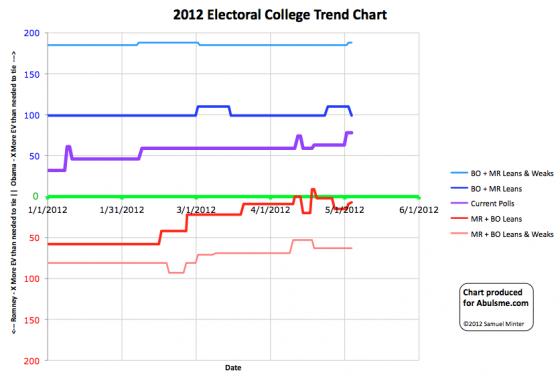
Chart and map from the Abulsme.com 2012 Electoral College Prediction page. Both assume Obama vs Romney with no strong third party candidate. Both show polling as it currently exists. Things will change before election day. On the map red is Romney, blue is Obama, gold states are too close to call. Lines on the chart represent how many more electoral votes a candidate would have than is needed to tie under several different scenarios. Up is good for Obama, Down is good for Romney.
Today is an exciting day. THREE states change categories.
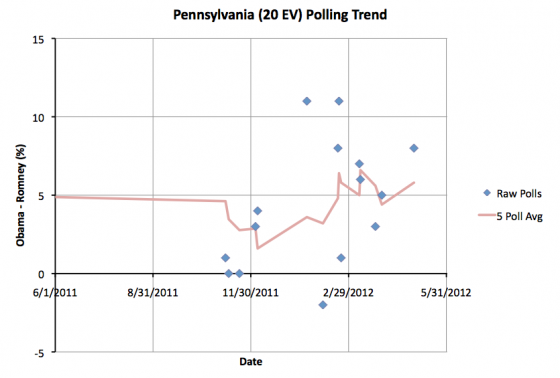
First up, Obama’s lead in Pennsylvania moves over 5%, so we pull it out of swing state status again. We’d listed Pennsylvania as a swing state since April 14th. The five poll average now has Obama up by 5.8%. This is still pretty close to the boundary, so a poll or two in Romney’s direction could pull Pennsylvania back, but for now we no longer consider Romney winning PA in our “Romney Best Case” scenario.
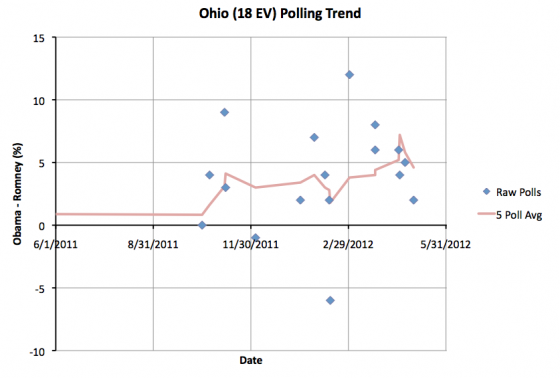
Second, Ohio gets tighter. Obama’s lead drops to 4.6%, which means I consider it a swing state again, and Romney’s best case scenario now includes Ohio. Ohio has usually been considered a swing state, and our five poll average only showed a greater than 5% lead for Obama from Apr 20 until today… two weeks. So this is a return to Ohio’s “normal” status. Ohio (18 ev) moving back toward Romney balances the Pennsylvania (20 ev) move, so the overall loss to Romney’s best case is only 2 electoral votes.
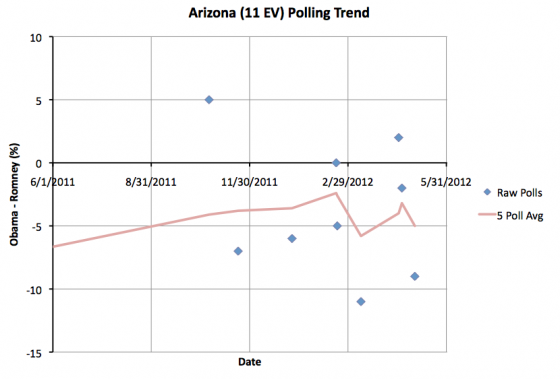
Third, Arizona moves back toward Romney. There has been talk of Arizona being a red state that Obama may be able to pick off and win. For the moment though, that looks less likely. According to my definition, I consider states to be swing states if the lead in the five poll average is LESS than 5.0%. At the moment the five poll average in Arizona is EXACTLY a 5.0% Romney lead, so the state moves back into “Lean Romney”. So I take winning Arizona off the table for Obama. At least for the moment. One poll could bring it back.
Between all three of these changes, the net affect is to narrow the range of possibilities between our Obama best case and Romney best case scenarios. Obama’s best case is worse by 11 electoral votes, and Romney’s best case is worse by 2 electoral votes.
|
Romney |
Obama |
| Romney Best Case |
276 |
262 |
| Current Status |
191 |
347 |
| Obama Best Case |
170 |
368 |
Romney’s best case remains very narrow. In order to win the presidency, he needs to win all of the states where he is currently ahead, including Tennessee (11 ev) and Missouri (10 ev) where polls currently show his lead is slim, then he MUST win Florida (27 ev), Ohio (18 ev), North Carolina (15 ev) and Virginia (13 ev), all of which are states where Obama is currently ahead by a narrow margin. Then he needs to win either Iowa (6 ev) or New Hampshire (4 ev) both of which are also leaning Obama at the moment.
Edit 2012 May 4 18:07 UTC – Corrected map, I had forgotten to color Ohio gold.
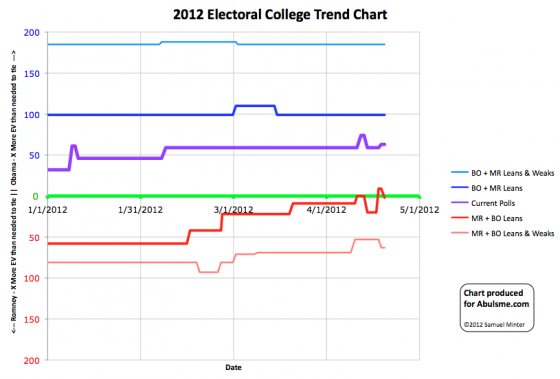
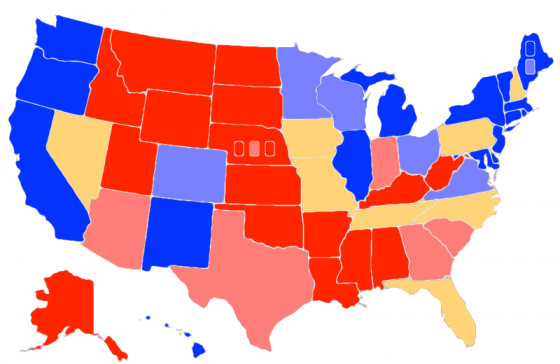
Chart and map from the Abulsme.com 2012 Electoral College Prediction page. Both assume Obama vs Romney with no strong third party candidate. Both show polling as it currently exists. Things will change before election day. Lines on the chart represent how many more electoral votes a candidate would have than is needed to tie under several different scenarios. Up is good for Obama, Down is good for Romney. On the map Red is Romney, Blue is Obama, Gold States are too close to call.
Two changes today based on new polls added to my master spreadsheet. And they both change the inventory of swing states, so important changes at that! Here are the details:
Florida (29 electoral votes): Just two days ago the five poll average moved Obama’s lead in Florida to over 5% (5.2%) and thus moved the state out of swing state status and into the “Weak Obama” category. Well, that didn’t last very long. Today’s update puts Obama’s 5-poll lead at 4.0%, so the state goes back into the “Lean Obama” category and is once again classified as a swing state for our model. Florida is big at 29 electoral votes, so makes a big difference in the electoral math.
Ohio (18 electoral votes): Meanwhile, Obama’s lead in Ohio goes above 5% to 5.2% in the five poll average. This removes Ohio from the swing state pool and moves it into the “Weak Obama” group. This means Obama has a decent lead at the moment, but not so big that it wouldn’t be worth Romney’s time to try to attack that lead and pull Ohio back to being a close contest. Ohio is one of those states that everyone expects to be close, so don’t be surprised if, like Florida, Ohio doesn’t stay in this status too long.
All and all since Florida is “worth more” than Ohio, today’s moves are good for Romney. And in fact, this once again makes it so if Romney wins all the swing states, he wins the election…
|
Romney |
Obama |
| Romney Best Case |
271 |
267 |
| Current Status |
206 |
332 |
| Obama Best Case |
170 |
368 |
While some states have moved in both directions, if we look at all the changes in April so far, Obama is still in a better position than he was at the beginning of the month. We still haven’t had enough state polls to detect the recent move in Romney’s direction over the last week and a half. If Romney hold his position in the national polls, expect more states to move in Romney’s direction over the next few weeks.
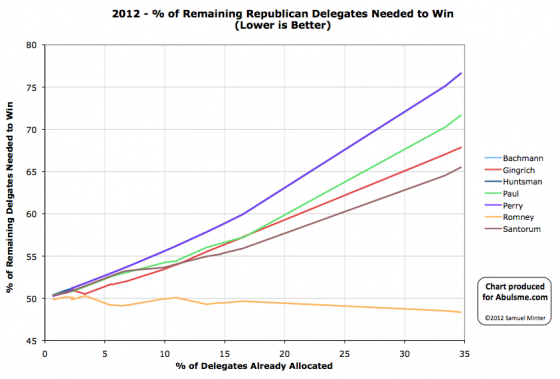
Chart from the Abulsme.com 2012 Republican Delegate Count Graphs page. When a candidate gets down to 0%, they have cinched the nomination. If they get up past 100%, they have been mathematically eliminated. Rather than the date on the x-axis, we show the “% of Delegates Already Allocated” as this better represents the progress through the race. Note that these numbers include estimates of the eventual results of multi-stage caucus processes which will be refined as the later stages occur.
So it appears that the last 34 delegates from Super Tuesday, a handful each from Georgia, Ohio and Tennessee, have been determined. 17 more to Romney, 8 more to Gingrich and 5 more to Santorum. But wait, that is only 30! Well, according to Green Papers, 4 of the 63 delegates that were up for grabs in Ohio end up officially “Uncommitted”, which (I think) means we won’t actually know which way they may go until we know which actual human beings end up being those delegates and those people say publicly who they plan on supporting (which they may or may not actually do before the convention).
All in all, today’s results are once again a win for Romney. He got 56.7% of today’s delegates, which was way more than the 48.5% he needed to continue to move closer to the nomination rather than further way. His “% of remaining needed to win” drops now to 48.4%. For the other candidates, the effect on the other side is more dramatic. Santorum is still in 2nd place, but his “% of remaining needed to win” moves up from 64.5% to 65.5%. Romney may not yet be rapidly moving toward cinching the nomination, but the non-Romneys are rapidly moving toward being mathematically eliminated.
Looking at the non-Romney’s for a minute, the next few states are expected to favor them. Perhaps Santorum will win some. Perhaps Gingrich will win some. But to actually be on a pace to win, Santorum has to not just win a state, but win by a huge margin, getting more than 65.5% of the delegates. For Gingrich it is even worse, he would need to win getting 67.8% of the delegates. (For completeness, Paul would need to get more than 71.7%.)
Even with Romney expected to not be strong in these states, with four candidates in the race, you don’t expect anybody to be able to pull that kind of level except in winner take all (or winner take almost-all) states. Of the next few coming up… in Kansas, Guam, Northern Marianas, Virgin Islands, Alabama, Mississippi, Hawaii and American Samoa there are as usual complicated delegate rules (and the territories might only select uncommitted delegates), but none of them are straight up winner takes all. (Some allow for certain situations that could lead there though.) Bottom line, 65.5% (or more) is a pretty big ask and seems unlikely.
Which means that even if Santorum or Gingrich win some states (as expected) in terms of delegates they will almost certainly still both be heading closer to mathematical elimination rather than closer to the nomination. The big thing to look at will once again be looking at how well the non-Romney’s collectively block Romney from getting the 48.4% of the delegates he needs to be closing in on the nomination himself. With strong performance by the non-Romney’s in the next few contests, they may well be able to achieve this, even if they don’t actually help themselves individually.
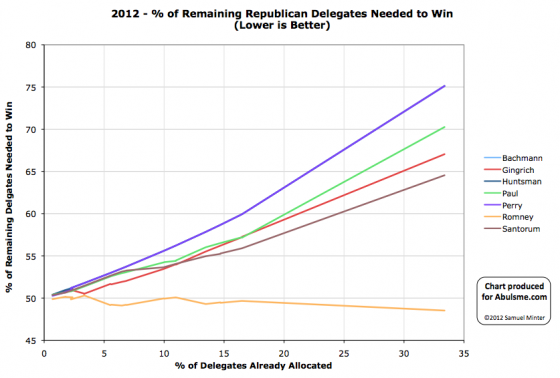
Chart from the Abulsme.com 2012 Republican Delegate Count Graphs page. When a candidate gets down to 0%, they have cinched the nomination. If they get up past 100%, they have been mathematically eliminated. Rather than the date on the x-axis, we show the “% of Delegates Already Allocated” as this better represents the progress through the race. Note that these numbers include estimates of the eventual results of multi-stage caucus processes which will be refined as the later stages occur.
So, Super Tuesday happened. As of this update, Green Papers has “called” 385 of the 419 delegates available from the Super Tuesday contests. There are 34 delegates that haven’t been determined yet that will result in updates later, but of the ones we do know, the estimates for Super Tuesday contests are: Romney 208, Santorum 84, Gingrich 72, Paul 21. Romney also picked up a Superdelegate, bringing the total for the day to Romney 209, Santorum 84, Gingrich 72, Paul 21.
Compared to the Sabato Crystal Ball projections which we used to game out Super Tuesday over the weekend, Romney performed better than expectations, as did Gingrich. Santorum and Paul underperformed compared to those predictions. In any case, where does this put us…
Bottom line, Romney is the big winner today, and this may be the start of him actually pulling away and heading toward the nomination, but he is still not out of the woods in terms of the danger of being blocked from 1144. Lets look at the details.
The situation for Santorum, Gingrich and Paul is essentially what I mapped out in the gaming Super Tuesday post. To paraphrase what I said there, it is now absolutely undeniably clear (although the trend was obvious even before today) that none of these three guys are on a path to the nomination. Of the three, Santorum is doing the best, but with today’s numbers, to be on a path to win, he would need to now get 64.5% of the remaining delegates, compared to the 21.1% he has gotten so far. For this to even come into the realm of possibility, Gingrich and Paul would both have to stop getting delegates, Santorum would have to pick up all of their support, AND something would need to happen to cause support for Romney to plummet. This is a very unlikely sequence of events. It isn’t going to happen.
Oh, I guess I should also note that Gingrich pulled back ahead of Paul for 3rd place.
The remaining question is: “Are the non-Romney’s collectively still in a position to potentially block Romney from getting to 1144?” If after today, Romney was under 50% of the total delegates, and his “% of remaining needed to win” was heading upward or flat, this is a possibility that would be looking like it was still very much in play. But Romney exceeded the 49.7% of delegates he needed in order to be on track toward 1144, and did it by a decent margin. Of the delegates in today’s total, he picked up 209 of 386, or 54.1%. This reduced his “% of remaining needed to win” from 49.7% to 48.5%. That means to block, the non-Romney’s collectively need to be getting 51.5% of the delegates, compared to the 46.9% they have managed so far. So they have to do better than they have been so far, and by a non-trivial margin. And they have do do this even though it is obvious none of them can win outright. It has to be about stopping Romney.
Now, the rest of March has a bunch of states that are supposed to be relatively good for the non-Romneys. So the non-Romney’s managing to get 51.5% in the next few state is very much within the realm of possibility. After that we hit more Romney friendly states in April. The thing to watch for in the upcoming states is not who wins the popular vote, or even the delegate count. The question will be: “Is Romney continuing to get enough delegates to avoid being blocked?” Right now, that magic number is 48.2%. As long as he is getting 48.2% of the delegates (or more) then he is marching his way toward the nomination. If he gets less than that, then blocking will remain possible a little bit longer. If the rest of March really is friendly to the non-Romneys, we may see that Romney’s “% needed to win” starts heading back up a bit before Romney hits friendly states again and starts fully pulling away. As long as we see that happening, blocking Romney is still a possibility. And indeed, if Romney is damaged by the contests in March and his April states start looking not so good after all, then blocking starts looking more real again.
But Romney’s “% of remaining needed to win” is the smallest it has been so far, and none of the other candidates have realistic shots at winning, only a shot at blocking that relies on them continuing to win delegates even though it is obvious they can’t win, so Romney is in a pretty good position right now. Watch that line though. Until it starts heading downward decisively, Romney hasn’t got it wrapped up just yet.
So what is next? Well, first, the last 34 delegates from Super Tuesday (they are from Georgia, Ohio and Tennessee). Then on Sunday we have Kansas (40), Guam (9), Northern Marianas (9), Virgin Islands (9). Then Tuesday we have Alabama (50), Mississippi (40), Hawaii (20), American Samoa (9). And then it goes on and on…
[tube]P6pBUNbSrF4[/tube]
I think the most intense part was right about when this video starts.
The whole thing only lasted two minutes or so.
Video uploading to YouTube now. It was pretty intense for a few minutes.
|
|


