This is the website of Abulsme Noibatno Itramne (also known as Sam Minter).
Posts here are rare these days. For current stuff, follow me on Mastodon
|
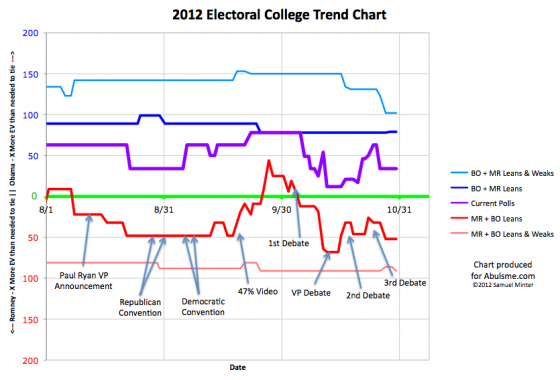
Minor change on the edges as New Mexico once again drops below a 10% Obama lead:
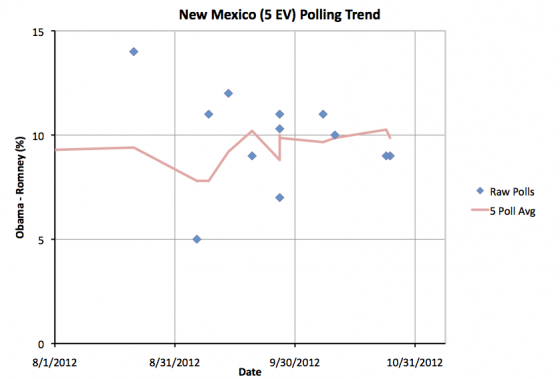
A few days ago Obama’s lead in the five poll average in New Mexico moved slightly above 10%, today a new poll pulls it back down to just below 10%. Either way, Obama will win New Mexico. So lets quickly move on so we can get to the good new stuff. First of all, new map and summary:
|
Romney |
Obama |
| Romney Best Case |
321 |
217 |
| Current Status |
235 |
303 |
| Obama Best Case |
190 |
348 |
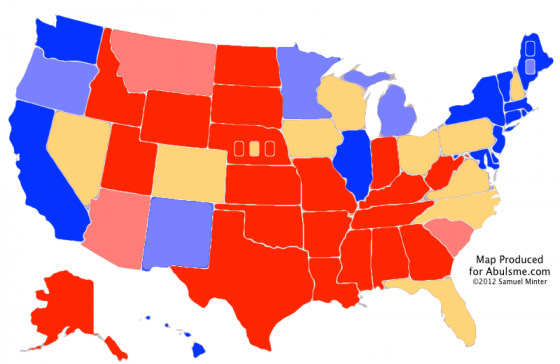
While New Mexico is colored lighter blue on the map, the summary is unchanged from yesterday, since New Mexico wasn’t moving in or out of “swing state” status.
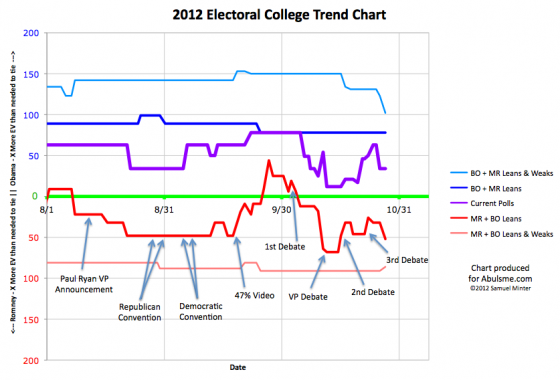
Since we still have a contest where Romney could win if he swept all the swing states, lets again look internally at how the polls stack up within the swing states, but rather than me listing the current margins in each of the swing states as I have done before, we’ll cut to the chase, and look at the “spiffy graph” I promised on Saturday. Graph first, then explaination:
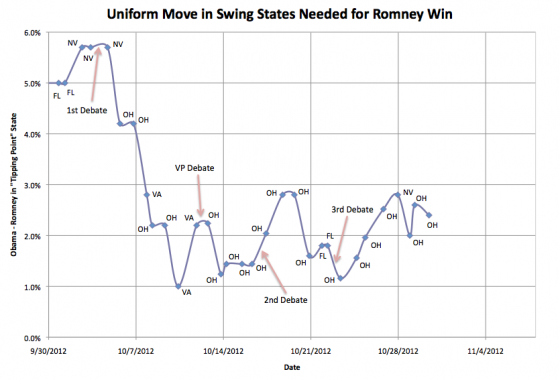
OK, in my recent posts I’ve listed the swing states, listed their margins, and then mentioned which states Romney would need to win if he took them “in order” by how well he is doing in the state. When you do this, one state would put Romney over the top. I then looked at the margin in that “Tipping Point” state. In other words, if Romney improved his margin by the same percentage across the board in all states (or at least all the swing states) how much better would he need to be doing in order to actually win enough of those states to win the electoral college?
I base these margins off my five poll average rather than something more sophisticated, but the general concept of this is similar to Sam Wang’s “meta-margin” at the Princeton Election Consortium. It shows another way of looking at the race, and one which gives a closer look at who is ahead and by how much than simply looking at the three model lines I usually present. With the three lines I normally present you can tell who is ahead and that it is relatively close, but it is hard to get a sense of exactly how FAR ahead the candidate in the lead is when it is “close”.
So anyway, what does this show? Well, basically the same trends we see in Romney’s Best case line and the current line. Namely, the first part of October Obama was in free fall, but that stopped around the time of the VP debate, and since then there has been a pretty noisy signal, but with a slight trend toward Obama. If you are generous to Romney, you can say that the trend has been flat since the VP debate, but any argument that there has been continuing Romney momentum is clearly false.
The “tipping point state” has almost always been Ohio, with a few days here and there when polling moved states slightly out of their normal order. But be it Ohio, or occasionally Florida, Virginia or Nevada, Obama’s lead in the tipping point state has been staying in a fairly consistent band between 1% and 3% for the past three weeks.
Obama is no longer in the comfortable territory he was in before the 1st debate, where Romney would have to move the tipping point states by more than 5% to win… a state I described before as Romney’s best case being to lose. But he has a buffer there, and, so far at least, the key tipping point states are not showing the moment Romney would need in order to win.
Now, if something were to happen to induce a move as large as the decline Obama had at the beginning of October, then yes, that would potentially still be enough to flip the race. As I type these words though, there are 7 days and 55 minutes until the first polls close on election day. There is very little time left for a last minute change large enough to flip this to Romney.
It could happen, it is just becoming a bigger and bigger stretch with every day that goes by that does not move things dramatically in Romney’s direction.
Meanwhile of course, even while NO electoral college model that I’ve seen has put Romney ahead at ANY time in the past year, all the aggregators of national polls have shown Romney ahead for almost all of the last three weeks, and that lead continues today. If nothing happens to shake things up in the next seven days, the prospect of an electoral college / popular vote split seems to get more likely by the day.
Note: Chart and map from the Abulsme.com 2012 Electoral College Prediction page. Both assume Obama vs Romney with no strong third party candidate and show polling as it currently exists. Things will change before election day. On the map red is Romney, blue is Obama, gold states are too close to call. Lines on the chart represent how many more electoral votes a candidate would have than is needed to tie under several different scenarios. Up is good for Obama, Down is good for Romney.
Edit 2012 Oct 30 22:43 UTC to fix some wording issues.
Edit 2012 Oct 30 23:19 UTC to fix typo.
One change today, and as the headline implied, it is Nebraska’s 2nd congressional district. Nebraska is one of two states (the other is Maine) that does not award electoral votes with a winner take all formula. Instead, you get two electoral votes for winning the state as a whole, and then one electoral vote for winning each congressional district. In 2008, McCain won the state, but Obama got one electoral vote for winning Nebraska’s 2nd district, which is the district containing the city of Omaha. Nebraska as a whole, and Nebraska’s 1st and 3rd congressional districts are all very safely Romney. But the 2nd?
Polling in Nebraska’s 2nd has been extremely sparse. I have only five data points in my spreadsheet since the 2008 election… and that is only because I include both values when a poll includes results for both registered and likely voters. (Yeah, yeah, that is probably methodologically unsound, I’ll reconsider in 2016.) So really, only 4 polls since 2008. And only three of them were in the last 12 months. So we don’t have a great picture. But lets look at what we do have:
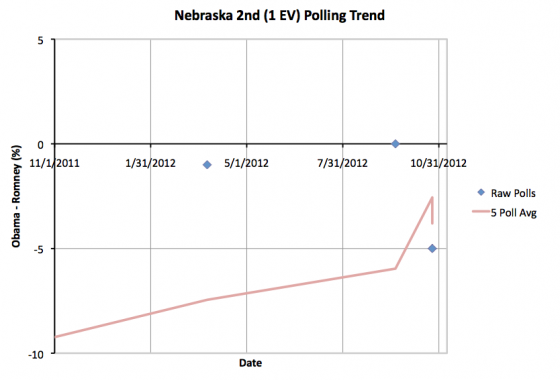
I’m showing the whole last year rather than just the last three months due to the paucity of polling.
Until today, the five poll average still included the “seeds” from the 2004 and 2008 elections. In 2004 Kerry lost Nebraska to Bush by a full 22%, so that significantly depressed the average. If you did my five poll average only counting the results of the new poll for likely voters, the average would now be a Romney lead of 2.6%. Using my normal rules for the five poll average, you get a 3.8% Romney lead. There are other ways you could compute an average for NE-2 depending on how you want to weight current polls vs older polls, etc. But given that the polls we have seen this year show a 1% Romney lead (in March), a tie (in September), and a 5% lead (now, looking at either Registered or Likely voters) it seems fair to lump NE-2 in with the states where Romney is ahead, but by less than 5%.
So Romney is ahead in NE-2, but it is close. With my five poll average officially at a 3.8% Romney lead, that does mean though that while close, Florida and North Carolina are both considerably closer. Any situation that includes NE-2 going for Obama is likely to actually be an Obama blowout. Well, with how sparse the polling is, maybe it really isn’t fair to say that. There just isn’t enough data to really place NE-2 well on the spectrum. We have only the vaguest idea what is really going on there. So absent more polls here in the final days, we’ll list NE-2 as the “most likely surprise” in this election. It represents the “closest” electoral vote that hasn’t been polled heavily this year.
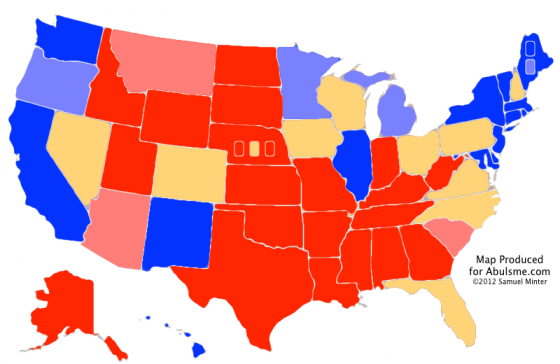
Anyway, this gives us a slightly different map and summary:
|
Romney |
Obama |
| Romney Best Case |
321 |
217 |
| Current Status |
235 |
303 |
| Obama Best Case |
190 |
348 |
So Obama’s best case improves by 1 electoral vote to a 348 to 190 win. That is a nice win, although still substantially short of his 365 to 173 in 2008.
Obama’s best case IS possible, just like Romney’s best case is. It seems like either of those though would require something actually happening in the remaining days of the campaign to move things in that direction, rather than just a continuation of normal campaigning.
Maybe Hurricane Sandy? Dunno. We’ll see.
Anyway, looking at the close areas again, just to see where we are:
- Nebraska 2nd (1): 3.8% Romney lead
- North Carolina (15): 2.4% Romney lead
- Florida (29): 0.8% Romney lead
- Virginia (13): 0.4% Obama lead
- New Hampshire (4): 1.0% Obama lead
- Iowa (6): 1.2% Obama lead
- Ohio (18): 2.0% Obama lead
- Colorado (9): 2.8% Obama lead
- Nevada (6): 2.8% Obama lead
- Wisconsin (10): 3.8% Obama lead
- Pennsylvania (20): 4.6% Obama lead
Romney gains a little bit in Ohio, so that state once again is the “tipping point state”. So the percentage Romney has to move every state in order to win is down to 2.0% (from 2.8% yesterday).
I mentioned yesterday that I might produce a “spiffy graph” showing the trend in this number… specifically the margin in the tipping point state over time… which can otherwise be thought of as the amount of “uniform movement” across all the close states that would have to happen to flip the winner. Well… I’ve been working on it… it requires pulling some historical data I didn’t explicitly keep track of at the time… but it isn’t quite done yet, and I am rapidly approaching the 00:00 UTC deadline I give myself for the daily updates. So maybe I’ll have that in the NEXT update. Sorry about that kids.
In the mean time, suffice it to say that the state of the race remains that Obama has a small but consistent lead in the critical states. If nothing changes, he will most likely win. But Romney remains within striking distance if something happens to move things his direction, or to a degree just if he has a really lucky day with turnout factors on election day.
But it is still looking like an Obama win in the electoral college.
(With the possibility of a split between that and the popular vote seemingly growing daily.)
Note: Chart and map from the Abulsme.com 2012 Electoral College Prediction page. Both assume Obama vs Romney with no strong third party candidate and show polling as it currently exists. Things will change before election day. On the map red is Romney, blue is Obama, gold states are too close to call. Lines on the chart represent how many more electoral votes a candidate would have than is needed to tie under several different scenarios. Up is good for Obama, Down is good for Romney.
Four states change status today, three moving toward Romney, one moving toward Obama. On the surface this looks very good for Romney. We’ll look into why that might not be the case in a bit, but first lets look at the four states that move today:
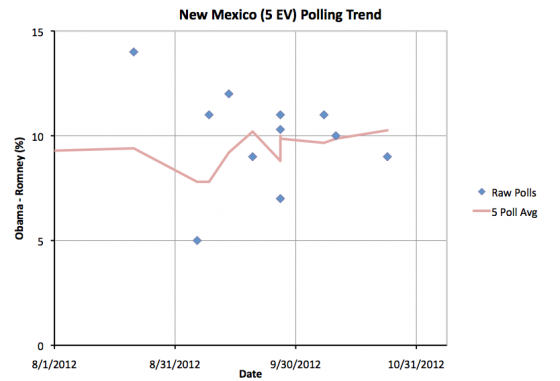
Very little to say about New Mexico. Obama’s lead increases slightly and is now over 10%. Obama will win New Mexico.
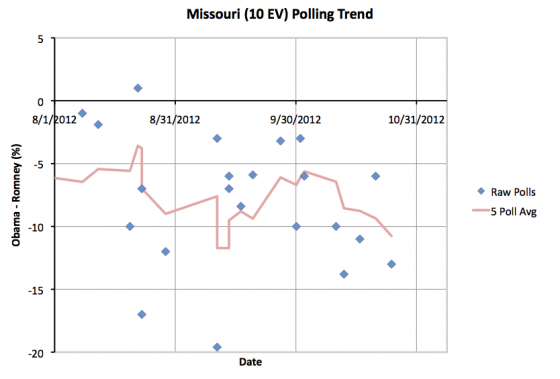
Not much to see in Missouri either. Romney’s lead increases slightly and is now over 10%. Romney will win Missouri.
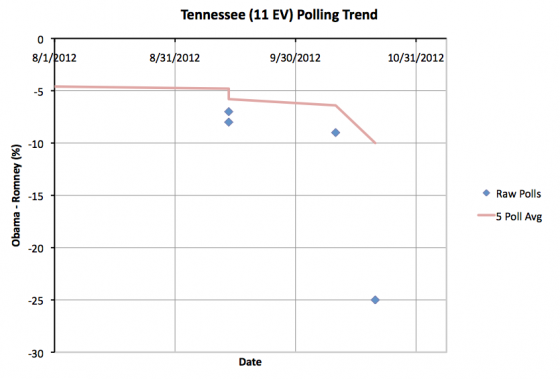
Tennessee is a bit odder. The new poll showing a 25% Romney lead in Tennessee looks like an outlier. No other poll in the state from the last year shows a Romney lead greater than 9%. Without this poll the five poll average has a Romney lead of 6.4%. With this, the Romney lead jumps to 10.0%, which moves Tennessee to the “Strong Romney” category. This may not be deserved, but I don’t make judgements about outliers, I just let the average sort it out. Either way, Tennessee’s not in contention this year. Romney will win Tennessee.
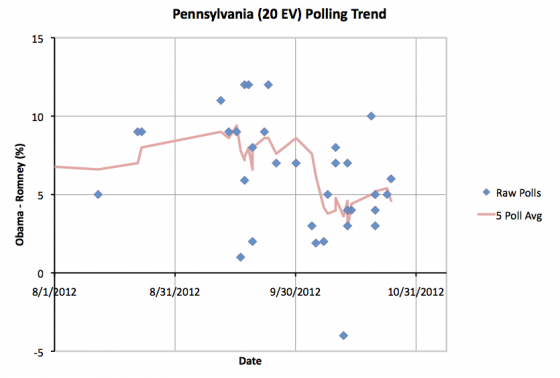
Pennsylvania shows Obama’s lead dropping under 5% again as an outlier showing Obama leading by 10% drops off. Again, we just let the average deal with outliers here, and that is what has happened. Pennsylvania returns to “Lean Obama” which probably better represents the true state of the race in Pennsylvania at the moment. Having said that, it is at the high end, Obama’s lead in the five poll average is now 4.6%. This is a pretty substantial lead. Any scenario that has Romney winning Pennsylvania would already have him wining the presidency handily.
OK, so this gives us this new map and summary:
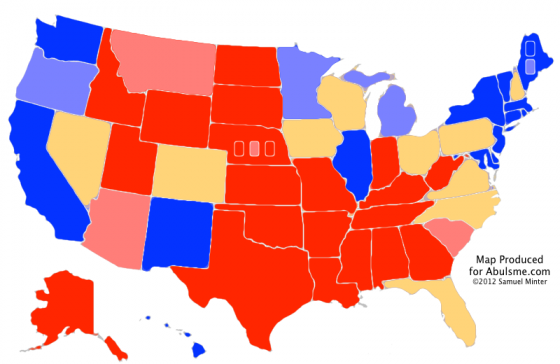
|
Romney |
Obama |
| Romney Best Case |
321 |
217 |
| Current Status |
235 |
303 |
| Obama Best Case |
191 |
347 |
As before though, since depending which way the close states go you could have either candidate winning, we need to look at the individual states:
- North Carolina (15 ev): 2.4% Romney lead – 4/5 polls after last debate
- Florida (29 ev): 0.8% Romney lead – 5/5 polls after last debate
- Virginia (13 ev): TIE – 5/5 polls after last debate
- Iowa (6 ev): 1.2% Obama lead – 2/5 polls after last debate
- New Hampshire (4 ev): 2.2% Obama lead – 2/5 polls after last debate
- Colorado (9 ev): 2.8% Obama lead – 5/5 polls after last debate
- Nevada (6 ev): 2.8% Obama lead – 5/5 polls after last debate
- Ohio (18 ev): 3.1% Obama lead – 5/5 polls after last debate
- Wisconsin (10 ev): 3.8% Obama lead – 3/5 polls after last debate
- Pennsylvania (20 ev): 4.6% Obama lead – 2/5 polls after last debate
Something interesting here, but I am running out of time to go into detail. Ohio is no longer the tipping point state! If you start adding these states up in order of how far away they are from Romney, you see that Romney’s clearest path to victory is now holding North Carolina and Florida, then pulling ahead and winning Virginia, Iowa, New Hampshire, Colorado and Nevada. If he does that, he wins 273 to 265.
So as of today, if he moves every state more than 2.8% toward him, Romney wins. But yesterday that percentage was 2.5%. Wednesday it was 1.6%. Tuesday it was 1.2%
I may make a spiffy graph of this with the next update, but for now just looking at those numbers, you can see that despite moving some states closer to him, Romney’s path to victory is slipping away. The states he needs to pull ahead in are instead slowly pulling away.
Note: Chart and map from the Abulsme.com 2012 Electoral College Prediction page. Both assume Obama vs Romney with no strong third party candidate and show polling as it currently exists. Things will change before election day. On the map red is Romney, blue is Obama, gold states are too close to call. Lines on the chart represent how many more electoral votes a candidate would have than is needed to tie under several different scenarios. Up is good for Obama, Down is good for Romney.
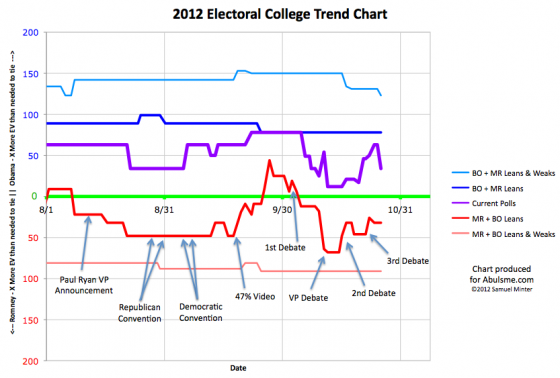
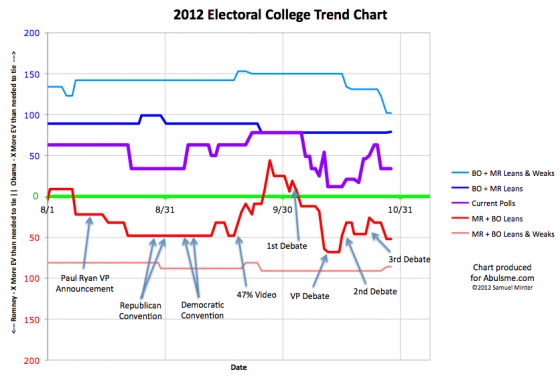
Three states change category today, but before I get to those, let me highlight changes to the chart showing the trend over time. I’ve zoomed in to show only the time period since August and have annotated some of the notable events of the campaign in these last few months. So a few thoughts on what you can see here…
First of all, you can easily see that the two events that seem to have the most visible impact are the 47% video and the 1st debate. But it is also clear that Obama’s peak was quite a bit before the first debate. I searched for specific news events around the date of that peak, but I didn’t find anything particularly memorable. So one interpretation is simply that folks who had moved based on the 47% video started to bake that in and think maybe the whole thing was overblown, so movement back toward Romney began.
Second, it is pretty clear that Romney peaked between the VP debate and the 2nd presidential debate. Obama began to recover slightly before the 2nd debate. The overall trend has been toward Obama since then. (Even with today’s movement toward Romney on the “Current” line.) Romney’s October peak was beyond his beginning of September high, and therefore higher than I thought it would be. But at this point Romney has still NEVER taken the lead in my analysis. The “Current Poll” line has always shown an Obama lead. Romney has never been ahead in this race. Never.
Third, for all but a few short periods of time, Romney’s best case, if he were to win all the swing states, includes winning. Romney can indeed win. It is not out of the realm of reasonable possibility. It is close enough that either campaign events that move things in the last week and a half or just Romney over-performing the polls by a few percent on election day could result in a Romney win.
But Obama’s lead is real and persistent, and has been in place all year. If we just have a ho hum continuation of the campaign as it has been straight through election day, then Obama wins. Something has to happen to push Romney into the lead.
Obama has to make a big mistake, or Romney has to do something outstanding that is unexpected, or some news event has to make Obama look bad on the eve of the election. Something. With the status quo, Obama wins the electoral college. (As we mentioned Wednesday, the popular vote is another story.)
OK, now lets review the states changing categories today:
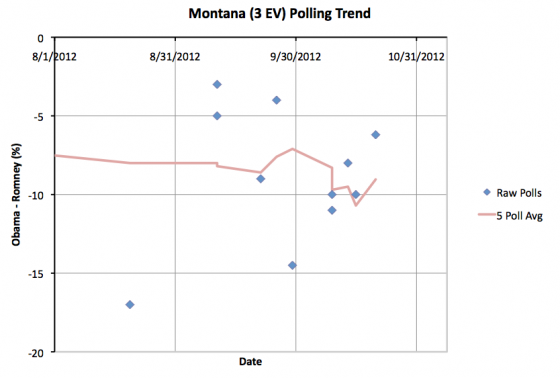
Not much to say here. The five poll average had briefly topped 10% in Montana. Now it drops below that line again. This puts Montana back into the category it has “normally” been in. Romney has a 9.0% lead in Montana. Romney will win Montana. This state is not in contention.
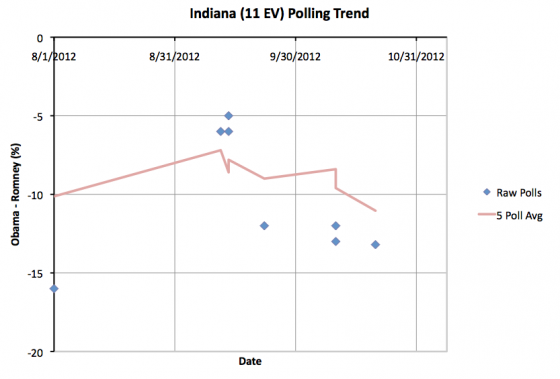
Same kind of thing here. Romney’s lead in the five poll average goes over 10% in Indiana. This is a big move compared to 2008, when Obama won the state by 1.0%, but Indiana has never been close in 2012. It is just an even bigger lead for Romney now. Romney is ahead by 11.0% in Indiana. Romney will win Indiana. Indiana is not in contention.
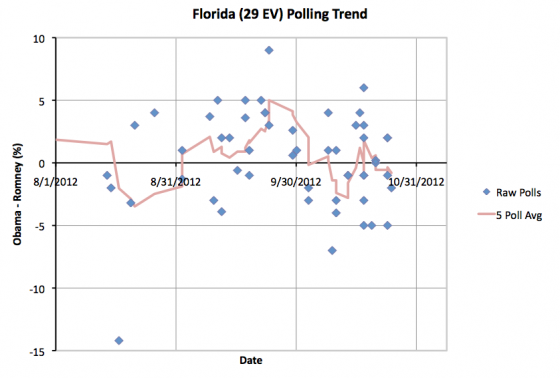
Unlike the others, Florida actually is moving from one candidate’s column to the others. And it is a big state. So this is significant, right?
No.
Prior to today’s update the five poll average had Obama up by 0.6%. With today’s new data, the five poll average has Romney up by 0.8%. These numbers both reflect the same thing… Florida is too close to call.
Florida has moved back and forth across the line many times this year. There has been no significant movement in either direction to indicate that Florida is moving definitively toward one candidate or another.
It is close. We’ll know which way Florida goes on election day.
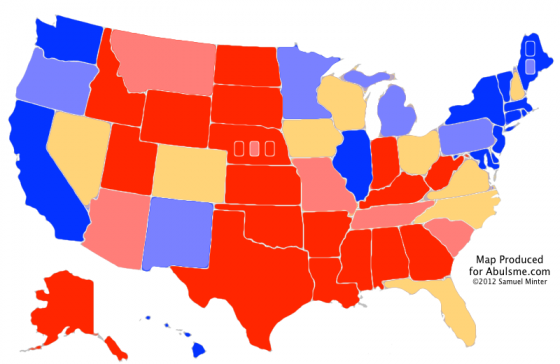
So, this gives us a new map and summary:
|
Romney |
Obama |
| Romney Best Case |
301 |
237 |
| Current Status |
235 |
303 |
| Obama Best Case |
191 |
347 |
Once again, since the best cases include both candidates winning, we need to look at the specifics of the close states:
- North Carolina (15): 2.4% Romney lead – 2/5 polls after last debate
- Florida (29): 0.8% Romney lead – 5/5 polls after last debate
- Virginia (13): 0.2% Obama lead – 5/5 polls after last debate
- Iowa (6): 1.2% Obama lead – 2/5 polls after last debate
- New Hampshire (4): 2.2% Obama lead – 2/5 polls after last debate
- Nevada (6): 2.4% Obama lead – 5/5 polls after last debate
- Ohio (18): 2.5% Obama lead – 4/5 polls after last debate
- Colorado (9): 2.6% Obama lead – 5/5 polls after last debate
- Wisconsin (10): 3.2% Obama lead – 2/5 polls after last debate
Once again Romney starts at 191 electoral votes with no close states. Add in North Carolina and Florida where he is ahead and he is up to 235. That leaves him 34 electoral votes short.
Going in order by how easy it should be for Romney to pull ahead, add in Virginia, Iowa, New Hampshire and Nevada… all of which Romney is behind in at the moment… and you get to 264. Still five electoral votes short.
And that brings us once again to Ohio. To win Romney has to get most of the states mentioned previously, but then also win Ohio. (If he wins Ohio, he could afford to lose some combinations of Virginia, Iowa and New Hampshire, but generally speaking if Romney wins Ohio, he will probably win those other states too.) Obama’s lead in Ohio has been increasing. On Tuesday Obama’s lead in Ohio was 1.2%. It is now up to 2.5%. Will that hold? Who knows.
But as we get closer to the election, 2.5% starts to morph from looking like a small number, to looking like a large number. In the last year Romney has NEVER been ahead in the five poll average in Ohio. It has usually been close. But Romney has never been ahead. Never. Ohio is indeed looking like a firewall.
A uniform move in the polls of any more than 2.5% toward Romney across the close states would give Romney the election. But Romney is running out of time, and most people have made up their minds.
This is once again looking like a steep uphill climb for Romney. Not impossible. It could happen.
But it is not looking good for Romney.
Note: Chart and map from the Abulsme.com 2012 Electoral College Prediction page. Both assume Obama vs Romney with no strong third party candidate and show polling as it currently exists. Things will change before election day. On the map red is Romney, blue is Obama, gold states are too close to call. Lines on the chart represent how many more electoral votes a candidate would have than is needed to tie under several different scenarios. Up is good for Obama, Down is good for Romney.
[Edited 2012 Oct 26 23:58 to correct chart of Florida polls over time. While my text was correct, I inadvertently included a chart missing some recent polls. Fixed. I also slightly adjusted some of the arrows on the electoral college trend chart.]
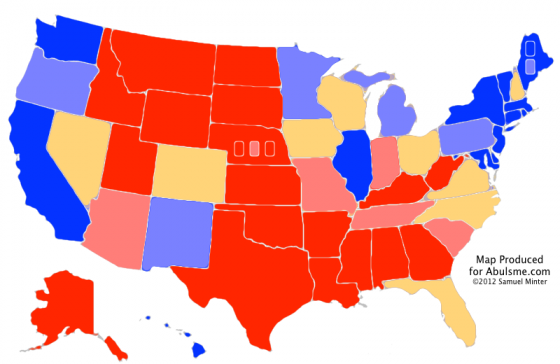
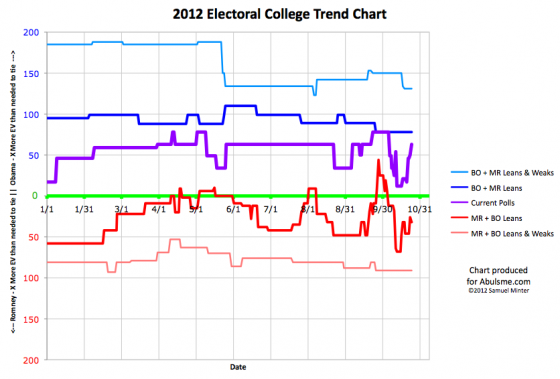
Two states change categories today. One moves toward Obama, the other moves toward Romney. Lets take a look:
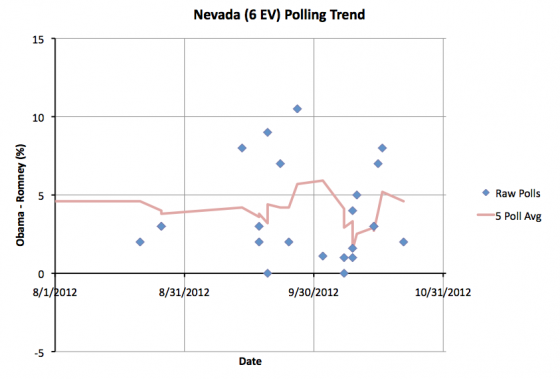
Last Friday the five poll average moved to a 5.2% Obama lead in Nevada. With today’s update, it drops back down to 4.6%. With that I put Nevada back in the list of “Lean Obama” close states. In the last year, Romney has NEVER held a lead in Nevada in the five poll average. Winning Nevada would be a stretch for him. But it is once again somewhat close. There ARE situations you could imagine, even with less than two weeks to go, that would erase Obama’s advantage in Nevada. As we get closer though, a 4.6% lead looks a lot bigger than it might have a month ago.
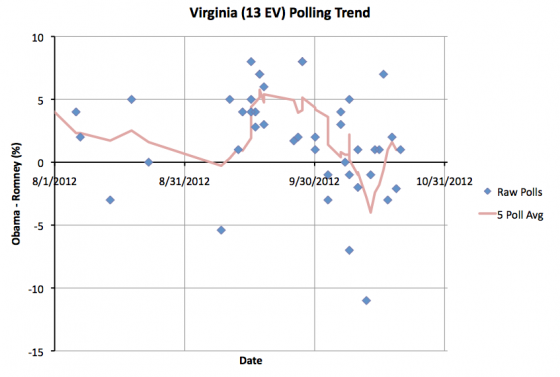
After a brief dip into Romney territory in the middle of October, Virginia returns to where it has been for most of the last year… a small Obama lead. As of now, the five poll average has Obama with a 1.0% lead in Virginia. This moves Virginia back to Obama’s column. The lead is narrow, this could change, but the movement lately has been toward Obama.
If you look specifically at the state charts such as the two above, this is actually the picture in most of the states that are in contention. You see an Obama decline starting about a week before the first debate, which accelerates into more of an implosion after the first debate. That decline hits bottom sometime between the VP debate and the second presidential debate, and then Obama has been trending upward ever since, but is still quite a long way from his highs at the end of September.
Now where does this put our summary?
|
Romney |
Obama |
| Romney Best Case |
301 |
237 |
| Current Status |
206 |
332 |
| Obama Best Case |
191 |
347 |
That is right. Our old friend is back. Obama winning by 332 to 206. This is where the “Current” line has been more often than any other position. If you look at the chart showing the history of the race for the entire year you can see that the most time has been spent here, and while there have been occasional movements in both directions away, time after time things have just reverted to 332 to 206. This just seems to be where this race “wants” to be. This seems to be the “mean” that the race always reverts back to after one event or another moves it away.
This looks like a pretty strong position for Obama, right? Romney is only ahead in ONE of the close states at the moment. He has to move several back over to his side to win. This does not look great for Romney.
Well, no, this isn’t great for Romney. His situation is considerably worse than it was right before the second debate. He clearly peaked and is now declining again… at least in terms of the electoral college. There have been some people saying that they are seeing Romney momentum right now. Uh, no.
But… it is still close. Time to look again at the individual close states:
- North Carolina (15 ev) – 2.0% Romney lead – 0/5 polls after last debate
- Florida (29 ev) – 0.6% Obama lead – 0/5 polls after last debate
- Virginia (13 ev) – 1.0% Obama lead – 0/5 polls after last debate
- New Hampshire (4 ev) – 1.0% Obama lead – 1/5 polls after last debate
- Colorado (9 ev) – 1.2% Obama lead – 0/5 polls after last debate
- Ohio (18 ev) – 1.6% Obama lead – 1/5 polls after last debate
- Iowa (6 ev) – 2.2% Obama lead – 0/5 polls after last debate
- Wisconsin (10 ev) – 3.5% Obama lead – 0/5 polls after last debate
- Nevada (6 ev) – 4.6% Obama lead – 0/5 polls after last debate
We still have Romney with 191 electoral votes without any close states. Add in the one close state he is ahead in, North Carolina, and you get to 206 electoral votes. That is 63 electoral votes short. In yesterday’s update if you moved all states toward Romney by more than 1.2%, you would have a Romney win. The tipping point was Ohio. The tipping point is still Ohio.
The easiest way for Romney to win is to hold North Carolina, then pull Florida, Virginia, New Hampshire, Colorado… and Ohio… to his side of the fence. This is looking like a much harder job than it was before. More states are slipping away from Romney… but they are still close… they are not out of reach.
Not as close as they were though. Obama’s lead in Ohio is increasing. It is now 1.6%. But 1.6% is still tiny. You can easily imagine events that would cause a 1.7% or 2.0% move in the polls across all the close states. If Obama pulls ahead by a bit more in Ohio, then maybe we can say he starts to look like a clear winner. But at the moment, it is still close.
Obama is ahead. If the election was held today, he would be the favorite by a decent margin. As of today, FiveThirtyEight has Obama at a 68.1% chance of winning. I’ve seen higher estimates elsewhere, up to 93.4%. My gut says it is somewhere in between. Maybe 80%.
But there is another interesting possibility percolating that I’ll mention before I close. For the last two weeks or so, most of the places doing poll averaging of national polls have shown Romney ahead. I don’t believe ANY of the sites that I track that are doing analysis of the electoral college have shown Romney ahead at any point. Obama has always been ahead.
If this situation persists through election day, we may have a repeat of 2000, but with the parties reversed and the key state being Ohio instead of Florida. Romney wins the popular vote, but Obama wins the electoral college and therefore the presidency.
This kind of situation happens when you have something like Romney building up increasingly large margins in states he was going to win anyway, like Texas. These additional gains make no difference to the electoral college, but they do matter to the electoral vote.
I would find this extremely entertaining for no reason more than being able to watch all kinds of people in both parties suddenly have a completely opposite opinion on the value of the electoral college than they espoused 12 years previously.
This is still not necessarily an expected outcome… FiveThirtyEight puts the odds of the scenario above at 6.5%. (For completeness, they give 1.8% odds to the reverse scenario where Romney wins the electoral college and Obama wins the popular vote.) 6.5% isn’t exactly super likely, but it is nothing to sneeze at. If there was a 6.5% chance of a hurricane hitting your city, you would be starting to make preparations.
Meanwhile though, other analysts put these odds much higher… specifically, Sam Wang puts the chances of this at 25%.
I normally say you can basically ignore the popular vote except as an early indicator to moves in the states… but this is a situation where watching the popular vote is worth it. If we continue to see a popular vote / electoral vote split it will make for a very interesting election night.
Note: Chart and map from the Abulsme.com 2012 Electoral College Prediction page. Both assume Obama vs Romney with no strong third party candidate and show polling as it currently exists. Things will change before election day. On the map red is Romney, blue is Obama, gold states are too close to call. Lines on the chart represent how many more electoral votes a candidate would have than is needed to tie under several different scenarios. Up is good for Obama, Down is good for Romney.
Edit 2012 Oct 24 18:53 UTC to fix a few wording issues.
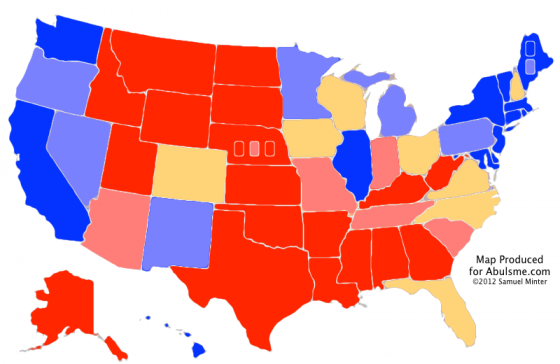
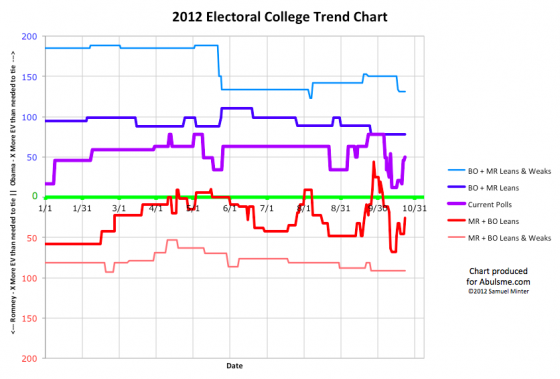
Two states changing categories today, both moving toward Obama. Both Romney’s “Best Case” line and the “Current” line reflecting the current lead in the polls, have now moved significantly back toward Obama since Romney’s peak around October 12th. These gains are still somewhat tenuous for Obama, which we’ll get into in a bit. For the moment though, lets look at the individual states:
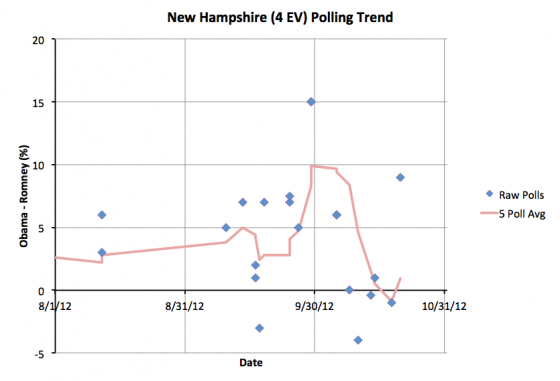
First up New Hampshire. Just three days ago Romney pulled into a slight lead in my five point average in New Hampshire. The very next poll pulls the average back over to Obama’s side of the fence. Having said that, the new poll, showing a 9% Obama lead, looks like it might end up as an outlier. We’ll need more polls to determine if there is real movement, or just noise. Even with that point Obama only has a 0.9% lead. So New Hampshire is still very close. A little on one side of the line versus a little on the other side of the line really doesn’t change all that much.
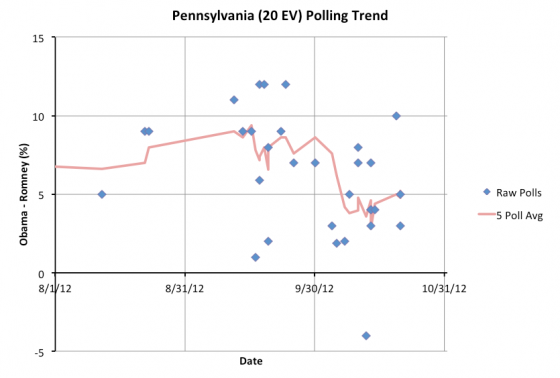
In Pennsylvania a couple of days ago what seemed like an outlier in Romney’s favor aged out of the five poll average. Today it was replaced by what looks like an outlier in Obama’s favor. This is enough to bring Obama’s lead to 5.2% in Pennsylvania. That is enough for me to move Pennsylvania to “Weak Obama” and take out of Romney’s best case scenario. As with New Hampshire’s move, this move is influenced by a poll that smells a little like an outlier. So don’t be surprised if Pennsylvania slips back under the 5% mark as more polls come in.
So where does this put the summary:
|
Romney |
Obama |
| Romney Best Case |
295 |
243 |
| Current Status |
219 |
319 |
| Obama Best Case |
191 |
347 |
This looks pretty good for Obama, right? He’s building his lead back in, and slowly but surely undoing the damage from that first debate? Just looking at the charts, it looks like on the “current” line, Obama is about half way back to his peak at the end of September. On the “Romney’s best case” Obama’s gained back about a third of his losses. In terms of these numbers, Obama is better off than the spot at the end of August where I had once called a Romney peak.
At that point in time I mentioned that even at that Romney peak, Obama was in a very solid position. Romney would have to flip a whole bunch of states where Obama was ahead in order to win. It was a tall order. Since we’re right there again, so Obama is pretty solid, right?
Right? Well on the surface. But looking at that alone hides a bit. The key is that a lot of the states that are on Obama’s side of the winning line are just BARELY there. So lets look again at all of the close states:
- North Carolina (15 ev): 2.0% Romney lead
- Virginia (13 ev): 0.2% Romney lead
- Florida (29 ev): 0.4% Obama lead
- New Hampshire (4 ev): 0.9% Obama lead
- Ohio (18 ev): 1.2% Obama lead
- Colorado (9 ev): 1.2% Obama lead
- Iowa (6 ev): 2.2% Obama lead
- Wisconsin (10 ev): 3.8% Obama lead
My line is always that anything under a 5% lead can easily disappear with essentially no notice. Of the 8 states with margins under 5%, five are actually closer than 2%. Three are closer than 1%! These are a bunch of really close states that really could flip back and forth.
With all the states he is ahead in, Obama wins 319 to 219. That is 50 electoral votes more than he needs to win! But if you just get a 1.3% uniform move in the polls across the close states, then Florida (29 ev), New Hampshire (4 ev), Ohio (18 ev) and Colorado (9 ev) all flip to Romney. That is 60 electoral votes. With that 2% move, Romney wins 279 to 259.
1.3% is not a big move. Obama has the lead. But barely. A stupid statement at a critical time. A random mistake that comes off badly. Some national or international news that just doesn’t reflect well. Changes in enthusiasm that causes Democrats to turn out less than Republicans. Any of those could move things by 1.3%. 1.3% is nothing. 1.3% can evaporate almost instantly if the right things happen.
The movements since the second debate have been mainly in Obama’s direction. Consensus seems to be that Obama also “won” the third debate. After the disaster in the first debate the Obama campaign seems to have hit their stride again. Things seem to be moving in their direction. If that continues for the next two weeks through election day, Obama should end up with a pretty comfortable victory. If things hold steady, or if Romney has a few good news cycles, then we may indeed end up waiting up late on election night to resolve a tight election in Ohio that will determine the outcome of the election.
Note: I finished my daily scan of polls a little over 10 hours prior to making this post, so new polls announced since then will be reflected in tomorrow’s update rather than today’s. I normally try to make the blog post right after finishing the scan on days where states change categories, but this time I just needed to get a little sleep in between. Sorry about that. :-)
Note: Chart and map from the Abulsme.com 2012 Electoral College Prediction page. Both assume Obama vs Romney with no strong third party candidate and show polling as it currently exists. Things will change before election day. On the map red is Romney, blue is Obama, gold states are too close to call. Lines on the chart represent how many more electoral votes a candidate would have than is needed to tie under several different scenarios. Up is good for Obama, Down is good for Romney.
[Edited 2012 Oct 23 22:12 to add final note, fix a wording error, and correct a mistake where I had 2.0% in a place that should have said 1.3%.]
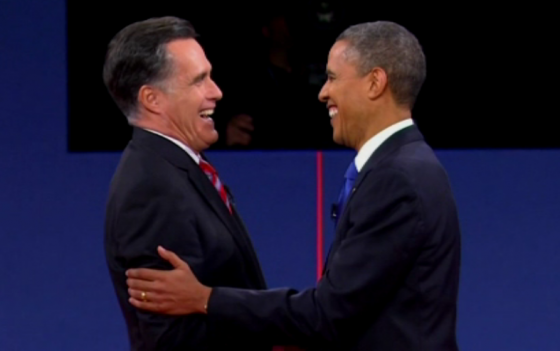
I got stuck in twitter jail about 20 minutes before the end of the debate, and was frustrated by being blocked from more live commentary. Sigh. Oh well.
So a quick bottom line here.
The first half was pretty even, but for the second half Obama won every exchange and got stronger and stronger as the night progressed. Meanwhile, Romney didn’t respond to attacks. He just let them stick and looked upset.
I think on balance Obama won, and by the end was winning pretty strongly, but it wasn’t a blowout like Romney had in the first debate.
In the end though, I’m not sure it will make a huge difference.
Thing is though, Romney needed it to make a difference. The race is very close right now, but Obama is still slightly ahead. Romney needed a big win tonight. Big enough to move polls in his direction. I don’t think he got it. This will either be neutral, or be a positive for Obama.
Perhaps I’m wrong. I was wrong when I said Romney had peaked at the beginning of September, what with not having anticipated a wholesale Obama melt down at the first debate. So we’ll just have to wait and see how things move as we start getting post-debate state polls.
The first general election polls close 14 days, 19 hours and 55 minutes from now.
That will go by really fast…
Oh, final note. I like how unlike the other two debates both candidates and their families hung out on the stage and mingled and talked to other for several minutes after the debate. Romney introducing Obama to his grandkids and such was just cute.
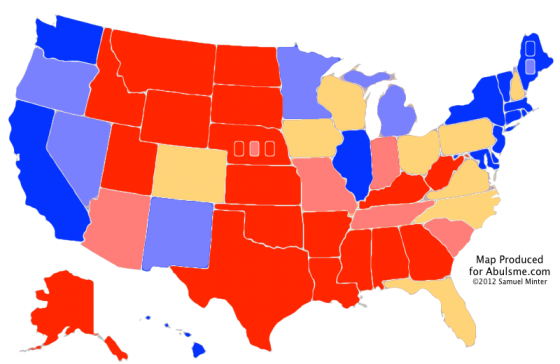
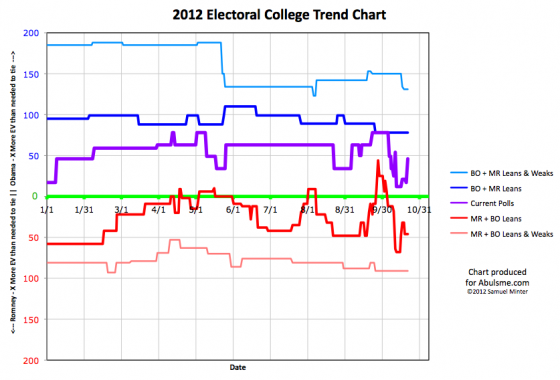
One change today. It is Florida. It is big. It moves from Leaning Romney to Leaning Obama… but… there are a lot of reasons this move doesn’t represent anything that is actually significant. At least not yet. So lets get into into it:
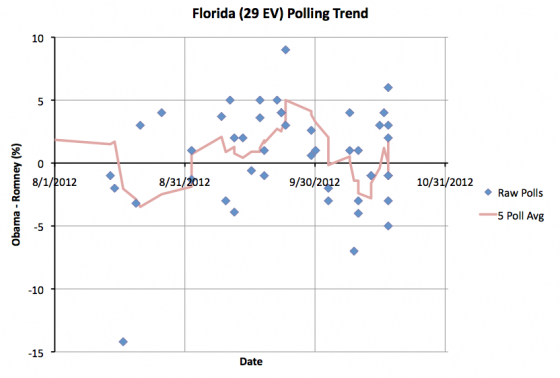
So, according to my five poll average, Florida moves from an 0.2% Romney lead where it was yesterday, to a 1.8% Obama lead today.
But… there is plenty of oddness here. First off, I do a “last five poll” average, with “last five” based on the end dates of the polls in question. Well, the most recent end date we have for polls is Thursday October 18th. But we are reaching the time in the race where some states get polled a lot… and so in Florida I now have SEVEN polls in my spreadsheet that ended on the 18th. So how do I pick which ones to include in the five poll average?
You could imagine all kinds of tiebreaker criteria, or you could imagine including more than five polls in situations like this. I essentially go with what is simplest for me to process, rather than something that I can justify from a “this is logically the right way to do this because X”, namely, I use the order I found them and added them to my spreadsheet. So the ones I found out about first in my normal daily sweep of sources age out first.
I admit that is kind of questionable and other approaches might be more valid from a theoretical point of view. Some are more complicated, like looking at both the start and end dates of the polls, or looking at the sample sizes of the polls, or things like that. I haven’t been keeping the data necessary to do that, so that would be a bit time intensive. So, what can we look at quickly.
First of all, if we looked at all seven of the polls that ended on the 18th instead of just five of them… We would have an Obama lead of 0.1%.
OK, what if we looked at all of the polls that ended after the second debate (8 polls)… We would have an 0.6% Obama lead.
What about the last 10 polls instead of the last five? Now we would have an 0.7% Obama lead.
What about if we just took any poll ending in the last week? Now we would have an 0.9% Obama lead.
Well, OK, that is interesting, look at that. In all of these cases, we now have Obama leads. So maybe my choice of “last 5” isn’t really that important after all. The trend is indeed moving back toward Obama, and the chart of Florida polls shows that nicely. But…
Another thing to look at… the spread… of the 7 polls that ended on the 18th, we have a range from a 5% Romney lead to a 6% Obama lead. That is quite a spread. The average is slightly on Obama’s side… slightly… but there is a large variance.
And even if there was no oddness with how I choose which polls to include in the average, what do we have here? My straight five poll average gives a 1.8% Obama lead… which is still very very close. That is a sliver of a lead that could disappear with the very next poll.
Bottom line, Florida is too close to call. All of the states in my “Lean” categories could easily go either way, but Florida remains one of the closest.
So, where does this put us:
|
Romney |
Obama |
| Romney Best Case |
315 |
223 |
| Current Status |
223 |
315 |
| Obama Best Case |
191 |
347 |
I won’t delve into all the details because I’m slightly behind schedule today, but Romney’s easiest path to victory is pull Florida back into his column and then win Ohio. This has been the primary scenario for a little while now. We’re off a bit from Romney’s highs, but Obama hasn’t yet started pulling states firmly back into his column. So this could still go either way.
We’ll start seeing the final view of what this election will look like once the post 3rd debate polls start coming in. By the time we get a full picture on that though, election day will be upon us. And of course early voting has been going on for weeks now. We’re right up against the end now, with Obama remaining a favorite, but by a slim margin.
Note: Chart and map from the Abulsme.com 2012 Electoral College Prediction page. Both assume Obama vs Romney with no strong third party candidate and show polling as it currently exists. Things will change before election day. On the map red is Romney, blue is Obama, gold states are too close to call. Lines on the chart represent how many more electoral votes a candidate would have than is needed to tie under several different scenarios. Up is good for Obama, Down is good for Romney.
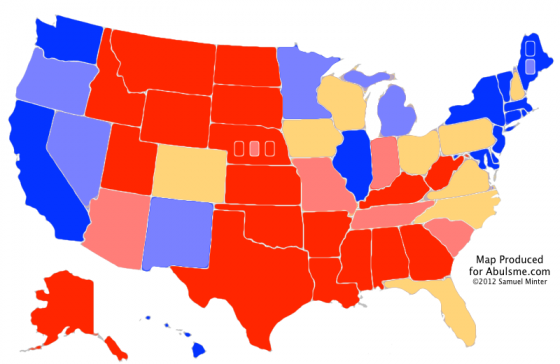
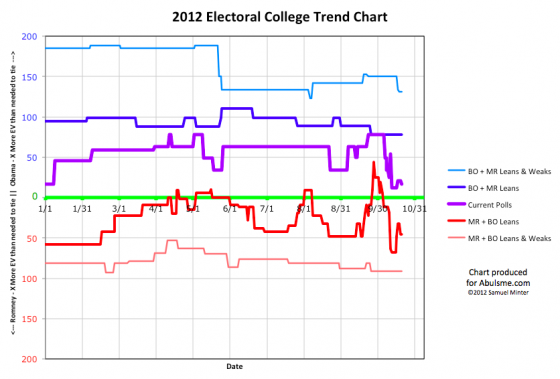
One state changes categories today, and it is a move toward Romney:
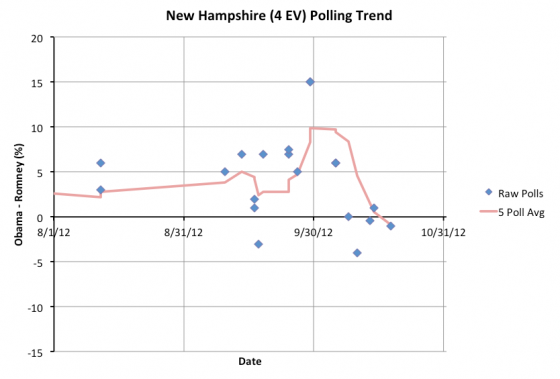
Romney had a lead in the five poll average in New Hampshire early in the year… back in January and February… but since then Obama has maintained a consistent lead in New Hampshire, sometimes close, sometimes considerable. Until now. After Obama peaked at a 9.9% lead at the end of September, Romney now takes a 0.9% lead in New Hampshire. And yes, for those asking, that does include one out of five polls with an end date after the second presidential debate.
So, new summary:
|
Romney |
Obama |
| Romney Best Case |
315 |
223 |
| Current Status |
252 |
286 |
| Obama Best Case |
191 |
347 |
While still not as well off as his peak on October 12th, Romney has been moving some states in his direction the last couple of days. While Obama is still ahead, the race remains extremely close. Today let’s once again look at the state of the five poll average in all of the close states. In order by the strength of Romney’s position:
- Virginia (13 ev): 2.4% Romney Lead – 2/5 polls after 2nd debate
- North Carolina (15 ev): 2.0% Romney Lead – 2/5 polls after 2nd debate
- New Hampshire (4 ev): 0.9% Romney Lead – 1/5 polls after 2nd debate
- Florida (29 ev): 0.4% Romney Lead – 5/5 polls after 2nd debate
- Ohio (18 ev): 1.6% Obama Lead – 4/5 polls after 2nd debate
- Colorado (9 ev): 2.6% Obama Lead – 2/5 polls after 2nd debate
- Iowa (6 ev): 2.8% Obama Lead – 2/5 polls after 2nd debate
- Pennsylvania (20 ev): 2.8% Obama Lead – 0/5 polls after 2nd debate
- Wisconsin (10 ev): 3.1% Obama Lead – 3/5 polls after 2nd debate
With just the states Romney is ahead in by more than 5%, he gets to 191 electoral votes.
Add the four states he is ahead in by margins less than 5%, and he gets up to 252 electoral votes. Those four states are all close. They could slip away. But if Romney holds them, that leaves him 17 electoral votes short of a tie, and 18 electoral votes away from an outright win.
What is the easiest way to get there? Yup… Ohio. Obama is still ahead in Ohio, but by a razor thin margin. And that margin has actually decreased from 2.8% before the 2nd debate to 1.6% now. If Romney pulls ahead in Ohio, that gets him to 270 electoral votes… the bare minimum needed to win outright without throwing it to the House.
I classify all nine of these states as states that could easily go either way. 5% is a margin that can disappear in a day or two with one candidate or another having a bad news cycle. Despite Obama’s razor thin lead at the moment, this really is anybody’s game right now. Obama is one bad day away from actually being behind for the first time.
Obama’s performance in the second debate may have stopped his slide and prevented Romney from taking a definitive lead, but so far at least, we don’t have evidence of Obama pulling ahead in a way that would return him to anything close to his late-September numbers. Instead, we have Obama with a small but real lead, and Romney within striking distance.
Just over 48 hours until the third debate, and then we’re in the final stretch…
Note: Chart and map from the Abulsme.com 2012 Electoral College Prediction page. Both assume Obama vs Romney with no strong third party candidate and show polling as it currently exists. Things will change before election day. On the map red is Romney, blue is Obama, gold states are too close to call. Lines on the chart represent how many more electoral votes a candidate would have than is needed to tie under several different scenarios. Up is good for Obama, Down is good for Romney.
|
|


