This is the website of Abulsme Noibatno Itramne (also known as Sam Minter). Posts here are rare these days. For current stuff, follow me on Mastodon

Categories

Calendar

December 2024
S M T W T F S
1234567
891011121314
15161718192021
22232425262728
293031  

Electoral College: Arizona Stops Swinging, Goes Light Red

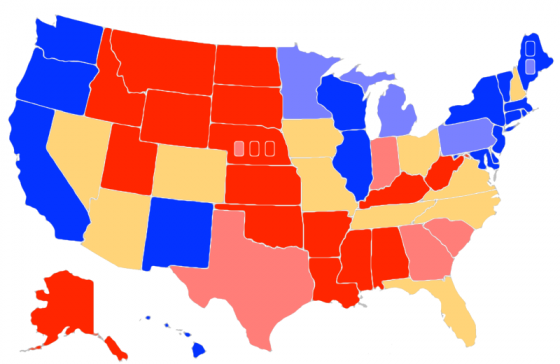
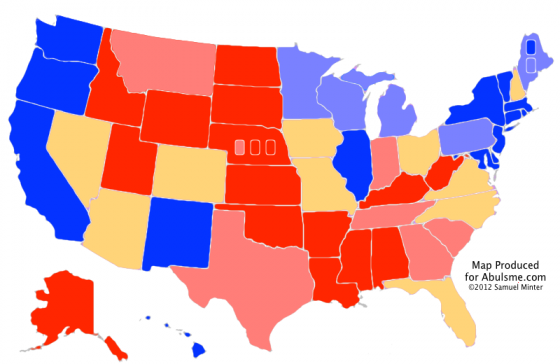
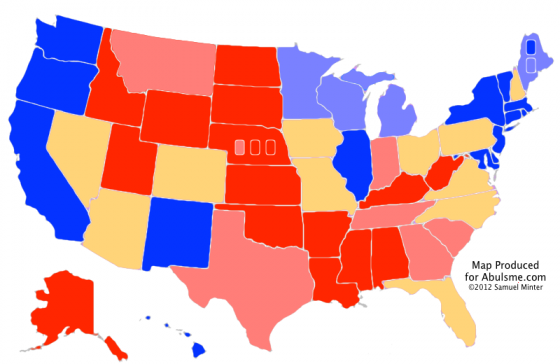
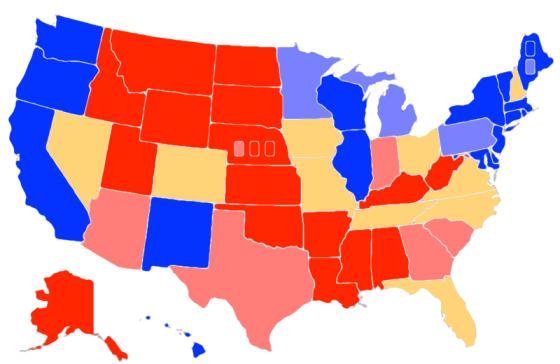
Map from the Abulsme.com 2012 Electoral College Prediction page. This map reflects Obama vs Romney. If any other candidate takes the lead in the Republican delegate race we’ll switch to making maps for them. This reflects the current state of polling, which of course will change drastically as the campaign progresses from now until November.

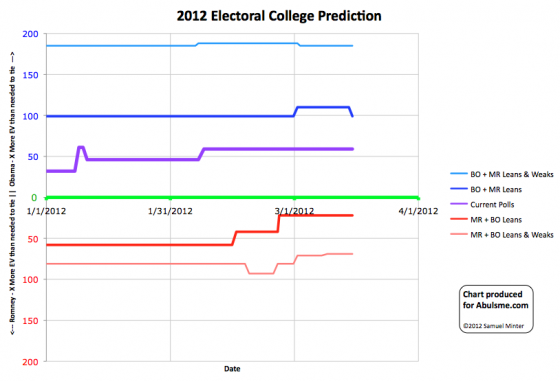
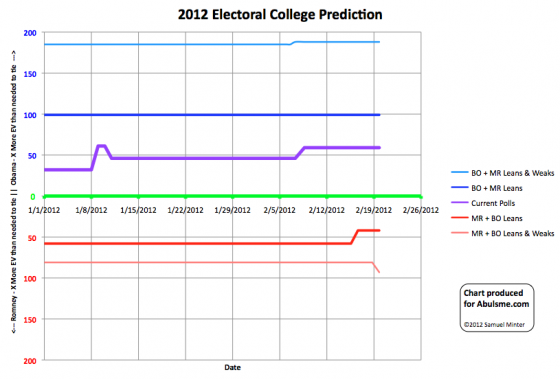
The latest update in my five poll averages puts Romney’s lead in Arizona over 5%, so the state moves out of the “Lean Romney” swing state status to “Weak Romney” indicating Romney’s lead is more than 5% but less than 10%. This moves Arizona out of the list of states that could easily go either way, and reduces the margin in Obama’s “Best Case” Scenario.

Romney Obama
Romney Best Case 291 247
Current Status 210 328
Obama Best Case 170 368

And the trends over time…

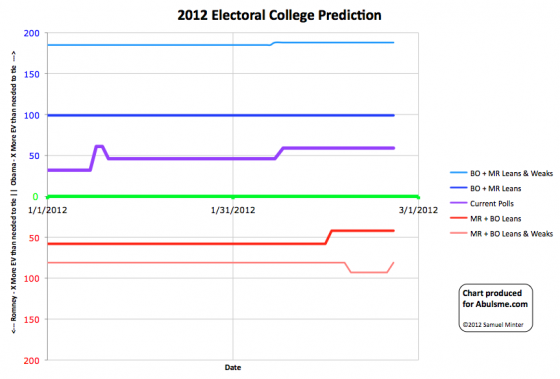
Chart from the Abulsme.com 2012 Electoral College Prediction page. Lines represent how many more electoral votes a candidate has than is needed to tie under several different scenarios. This chart reflects Obama vs Romney. Lines moving up indicate Obama’s situation improving, lines moving down indicate Romney’s situation improving. If any other candidate takes the lead in the Republican delegate race we’ll switch to making charts for them.

Electoral College: Maine (at large) goes Dark Blue

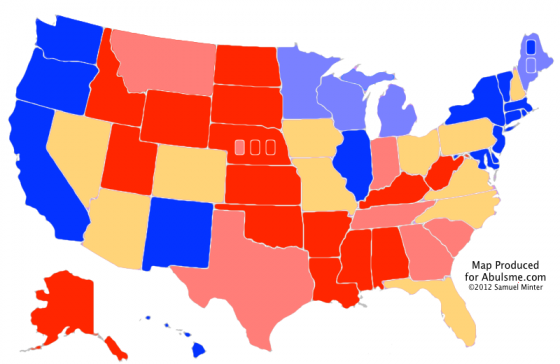
Map from the Abulsme.com 2012 Electoral College Prediction page. This map reflects Obama vs Romney. If any other candidate takes the lead in the Republican delegate race we’ll switch to making maps for them.

So the latest poll in Maine (the first since October) puts our “last five poll average” up an Obama lead of 12.1%, so the state moves from our light blue color (indicating a 5% to 10% lead) to dark blue (indicating a lead over 10%). Obama won Maine in 2008 by over 17%, so this isn’t a huge surprise.

This is for the whole state though. Maine is one of two states (the other is Nebraska) that allocate some of their electoral votes based on the state wide vote, but some of them by the winners in each congressional district. We have no polling yet for the individual congressional districts in Maine, so they are colored in by the average of the results in 2004 and 2008. So we classify ME-1 as Strong Obama (lead over 10%) and ME-2 as Weak Obama (lead between 5% and 10%).

In practice these states have almost never split their vote, but it does happen sometimes… Nebraska split its vote in 2008… so we have to allow for the possibility in our model.

Since this change does not effect a swing state, our summary remains the same:

Romney Obama
Romney Best Case 291 247
Current Status 210 328
Obama Best Case 159 379

And our chart over time…

Chart from the Abulsme.com 2012 Electoral College Prediction page.

In the last month there have been 8 state category changes. 6 of them have gone in Obama’s direction. It will be awhile until the state by state polls are frequent enough and in enough states to be quickly responsive to the state of the race, but from the polling we do have, it is apparent that the continuing Republican primary battle seems to be slowly but surely weakening Romney’s hand against Obama. The expectation is that once Romney can pivot to the general election, he’ll be able to start trying to reverse that tide. But until then, he seems to just continue to lose ground.

Electoral College: Montana back to Strong Romney

Map from the Abulsme.com 2012 Electoral College Prediction page. This map reflects Obama vs Romney. If any other candidate takes the lead in the Republican delegate race we’ll switch to making maps for them.

For a short time Romney’s last five poll average had dropped to less than a 10% lead in Montana, but the latest poll pushes that average back over 10%, so we color the state bright red again. Since either way Montana is not close to being a swing state (although the margin was only 2.3% in the 2008 election!) this does’t effect the overall summary of the race.

Romney Obama
Romney Best Case 291 247
Current Status 210 328
Obama Best Case 159 379

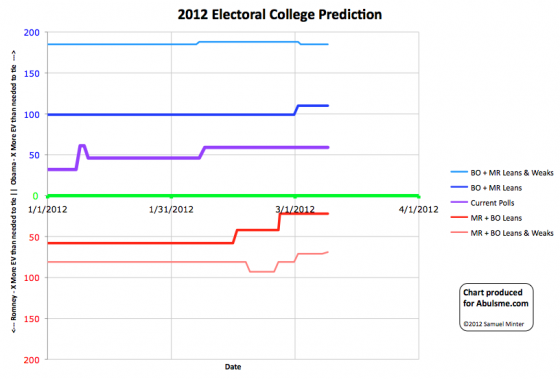
This does represent the first state to move in Romney’s direction in a couple of weeks, which can be seen in our trend chart:

Chart from the Abulsme.com 2012 Electoral College Prediction page.

Electoral College: Tennessee Swings and Wisconsin Solidifies for Obama

Map from the Abulsme.com 2012 Electoral College Prediction page. This map reflects Obama vs Romney. If any other candidate takes the lead in the Republican delegate race we’ll switch to making maps for them.

New polls in our last five poll averages move Obama’s lead in Wisconsin to over 10%, so that state moves into the “Strong Obama” category.

More interestingly perhaps, Romney’s lead in Tennessee drops to under 5%, moving that state to the “Lean Romney” category, which for purposes of our “best case” scenarios, puts the state into play for Obama. In 2008 McCain won Tennessee by a 15% margin, so this is somewhat surprising. We’ll see if this holds up as we move further into the year, but for the moment, that is where we are.

New Summary:

Romney Obama
Romney Best Case 291 247
Current Status 210 328
Obama Best Case 159 379

And the trends since the beginning of the year…

Chart from the Abulsme.com 2012 Electoral College Prediction page.

Up is better for Obama, so you can see that at least so far, things have generally been heading in his direction. It is of course still very early, so much will change between now and November.

Correction 2012 May 23 10:18 UTC: As it turns out, Wisconsin should NOT have flipped from Weak Obama to Strong Obama with this update on March 2nd. This change was influenced by the presence of a Washington State poll that I incorrectly included in my Wisconsin data. When this is backed out, Wisconsin does eventually go Strong Obama, but not until March 30th. Thanks to Darryl at HorsesAss for finding the error in my spreadsheet. The time series chart is corrected to reflect this starting with my May 23rd update.

Correction 2012 Jun 8 14:56 UTC: So, Tennessee shouldn’t have moved on this day either. The HorsesAss data included an old Tennessee poll from October 2011, that shows a strong Romney lead. The presence of this poll would have delayed the Tennessee move to “Lean Romney” until May 24th. This was noted and the historical graphs corrected starting with the June 8th update.

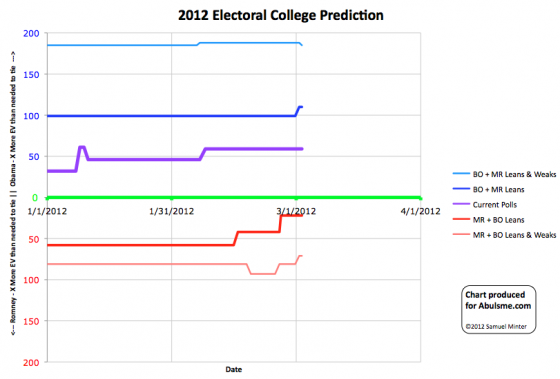
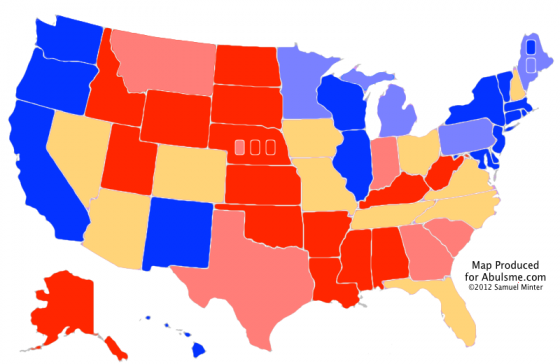
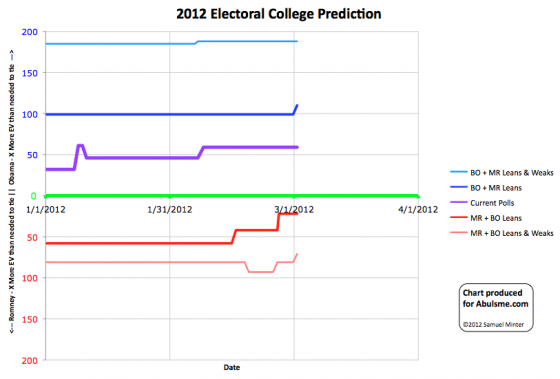
Electoral College: Pennsylvania Goes Blue

Chart from the Abulsme.com 2012 Electoral College Prediction page. Lines represent how many more electoral votes a candidate has than is needed to tie under several different scenarios. This chart reflects Obama vs Romney. If any other candidate takes the lead in the Republican delegate race we’ll switch to making charts for them.

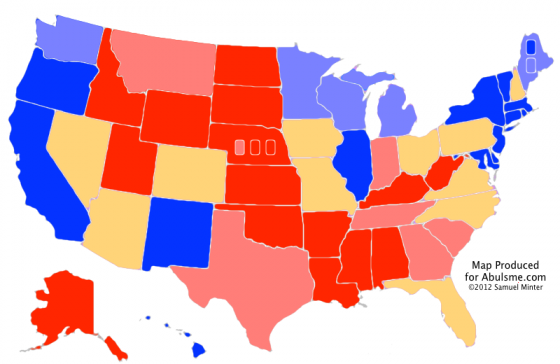
This is a big one today. Obama’s 5 poll average in Pennsylvania is now more than a 5% lead. This means I take Pennsylvania out of swing state status. It is no longer “too close to call”, it is blue. This reduces Romney’s best case (win all the swing states scenario) to only a 291 to 241 win. It is still a win, but his best case is now a vey narrow win, only 22 electoral votes past the 269 needed to tie. That turns Florida into a “Must Win”, as without winning Florida, there is no longer a way to get to 269. (At least without reaching past the swing states and pulling back states where Obama is even further ahead.)

New summary:

Romney Obama
Romney Best Case 291 247
Current Status 210 328
Obama Best Case 170 368

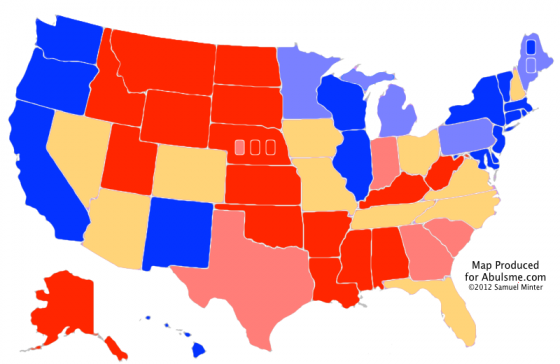
And new map…

Map from the Abulsme.com 2012 Electoral College Prediction page.

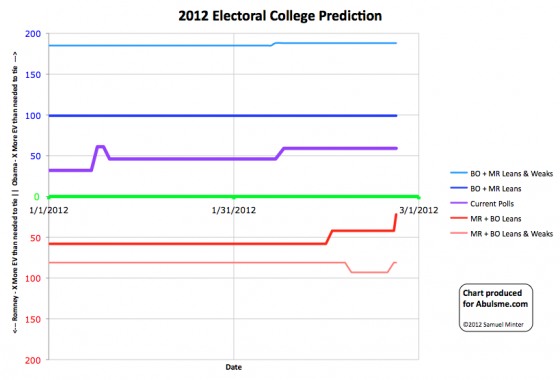
Electoral College: Easy Come, Easy Go (WA dark blue again)

Map from the Abulsme.com 2012 Electoral College Prediction page. This map reflects Obama vs Romney. If any other candidate takes the lead in the Republican delegate race we’ll switch to making maps for them.

So on February 19th our five poll average for Washington state had Obama’s lead dip below 10%, moving them from Strong Obama to Weak Obama. Today another poll puts Obama’s 5 poll average back over 10%, so we put the state back in the Strong Obama category. Either way, just above or just below 10%, Washington is nowhere near being a swing state.

Since this doesn’t affect the inventory of swing states, the overall summary is the same:

Romney Obama
Romney Best Case 311 227
Current Status 210 328
Obama Best Case 170 368

And the chart over time…

Chart from the Abulsme.com 2012 Electoral College Prediction page. Lines represent how many more electoral votes a candidate has than is needed to tie under several different scenarios.

Comparing 2008 and 2012 Again (Now With Graphs!)

OK, beating a dead horse a bit, but I finally made graphs, so one more look. (Previous comments on this here and here, 2012 Delegate race here, 2008 Delegate races here.)

The key is that while if you look at the calendar, and say where were things on February 22nd 2008…

On the Republican side you’d see that McCain had for all intents and purposes wrapped things up. On that date 60.4% of the delegates had already been allocated. McCain had 63.9% of the delegates, while his closest competition (Romney) only had 19.9%. In order to get to his magic number McCain only needed 29.0% of the remaining delegates. For Romney to catch up, he would have needed 96.0% of the remaining delegates. Romney was just days away from being mathematically eliminated (that would happen on February 26th).

Meanwhile on the Democratic side, 64.1% of the delegates had been allocated. Obama had 50.8% of the delegates to Clinton’s 48.2%. To win Obama needed 48.6% of the remaining delegates, Clinton needed 53.3% of the remaining delegates. Clearly the Democratic race was still close (although from here on out, Obama just increased his lead, Clinton never really made up any ground except when Florida’s delegates were reinstated near the end). But the Republican race was over.

You’d then compare to Romney today and build a narrative of Romney not being able to close the deal, of wondering why he can’t just wrap this up, after all McCain had wrapped this up by this time, right?

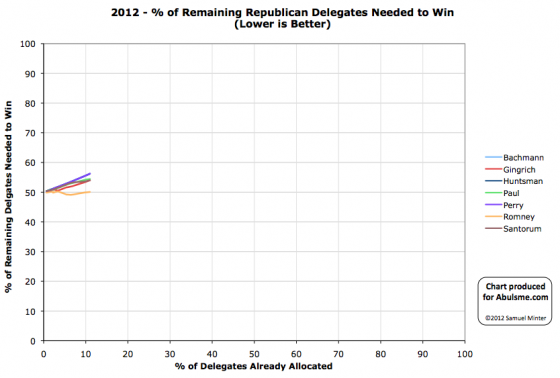
But this year, on the Republican side, as of today we only have 11.0% of the delegates allocated (and that counts estimates from caucus states, it is less without that). So how does this year look and compare with 2008 when you look at it by % of delegates allocated instead of by date?

Well, here is the “% of remaining needed to win” chart with % of delegates allocated on the horizontal axis instead of date:
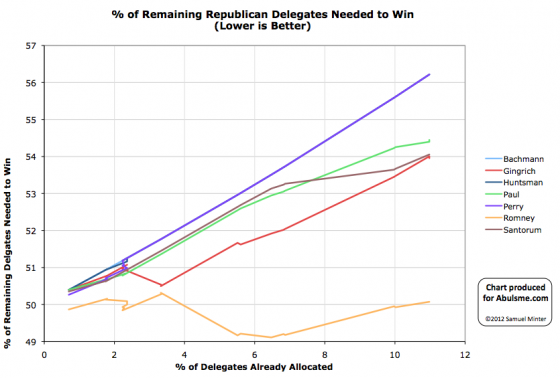
You can see clearly that Romney is well ahead of his competition, and while he isn’t yet diving down toward zero (indicating he is heading quickly to the nomination) he is holding steady, while everybody else is trending upward toward being eliminated. Gingrich and Santorum are neck and neck for 2nd place and both need about 54% of the remaining delegates to catch up and win. 54% is not an impossible number in a two man race. It is a lot better than either has done so far, but if one of them stops getting delegates and the other picks up all of their support, it is in the realm of the possible. But it would be a significant change from what has happened so far. Note, for instance, that even when Santorum won states, he didn’t win by a big enough margin to actually be catching up. His line still went up.

Now what did this look like in 2008? The closest comparison for the Republicans would be as of February 5th… the day before Super Tuesday. At that point 9.4% of the delegates had been allocated.
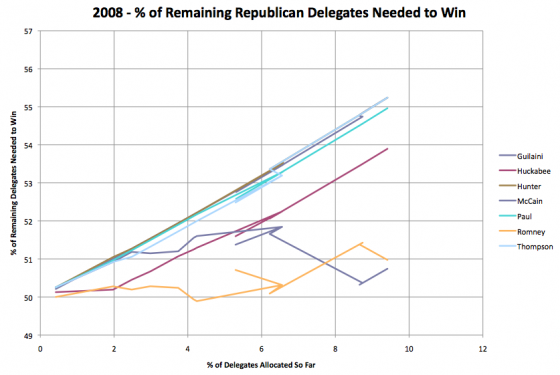
What do we see here? A very different pattern. McCain had only recently (in terms of % of delegates) pulled ahead, but Romney was still close… and gaining! We had a two person race where both were within shooting distance of each other, and neither were yet heading either rapidly up or down on this chart, indicating that they were either on the way to elimination or to the nomination. In 2008 at this point, things really were still close. The very next day, on SuperTuesday, McCain would essentially run away with it, and that would be that. But comparing comparable points in the delegate race, Romney actually has a much bigger lead and advantage on his competition than McCain had in 2008.

One more comparison though… The Democrats in 2008. The comparable date there is also February 5th, the day before Super Tuesday. 10.3% of the delegates had been allocated on that side on that day.
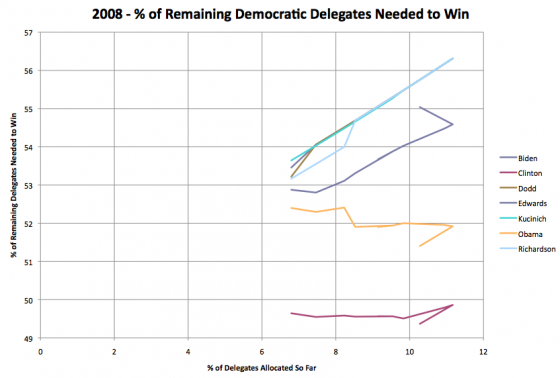
There are a few oddities in the data from back then… my sources had allocated some delegates, then backtracked, causing the little bit of backtracking on the chart, and when my tracking started on January 1st almost 7% of the delegates were already in place because of Super Delegates who had declared their preferences)… but you can still see the trends.

So, most important thing you see here… Clinton was still in the lead! Obama didn’t catch her in delegates until significantly later. But it is clear that both Obama and Clinton are still in contention. Their lines are basically horizontal, and they were pretty close to each other. Neither of them had started moving toward the nomination really, but neither was showing a pattern of getting eliminated either… like Edwards and all the rest were.

In this year’s race, all of Romney’s competition are in worse positions than McCain’s competition was at the same time. It is not yet too late for one of them to mount a push and catch up… but it is getting close. Even with the vastly stretched out schedule, there is still a big enough chunk of states coming up on Super Tuesday that we’ll probably see that day be the do or die day for all the not-Romneys. At least for actually catching up and winning. Blocking Romney from 1144 is a lot easier task than actually winning at this point. We’ll know a lot more about how possible (or not) that scenario is after Super Tuesday as well.

OK, long post, but finally, for reference, here are the two races in 2008 in full as they played out (rather than just looking at the first 12%).
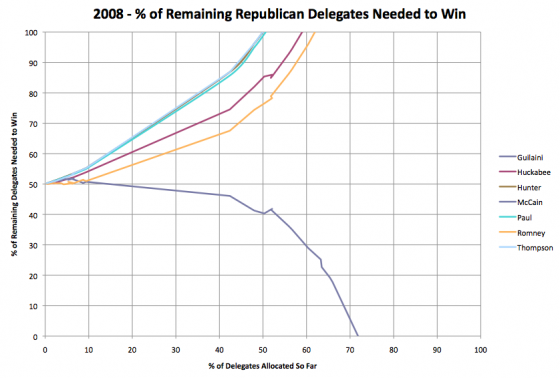
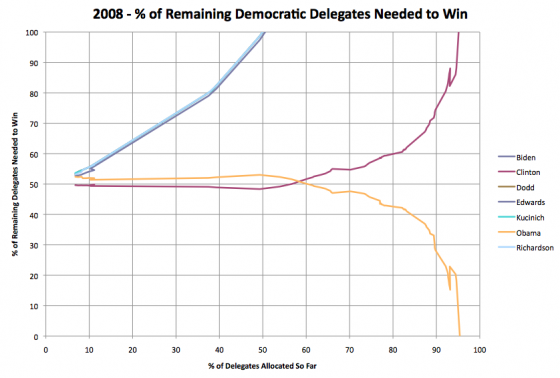
And here is this year’s Republicans at the same scale…
Just a little ways left to go, huh?
Curmudgeon’s Corner: Descent into Chaos

In the latest Curmudgeon’s Corner…

Sam and Ivan talk about:

  • Texas / Illegal Immigration
  • Mountain Lion / Useful Apps
  • Obama Frustration / Tea Party Frustration / Arizona and Michigan
  • Santorum on Contraception, Sex and Religion / Gaming the Race

Just click to listen now:

[wpaudio url=”http://www.abulsme.com/CurmudgeonsCorner/cc20120219.mp3″ text=”Recorded 19 Feb 2012″]

or

1-Click Subscribe in iTunes

View Podcast in iTunes

View XML Feed

Electoral College: Obama weakens a bit in Washington

Map from the Abulsme.com 2012 Electoral College Prediction page.

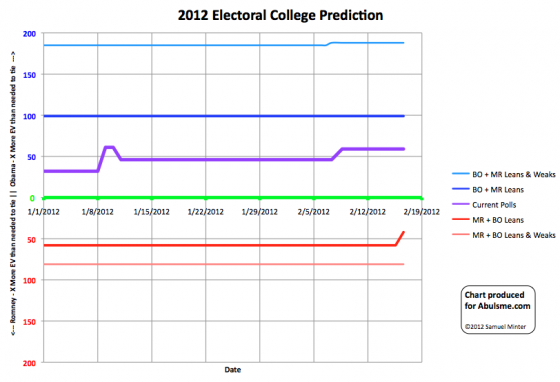
So, a new poll in Washington state moves Obama’s 5 poll average from a lead just a little more than 10%, to a lead just under 10%. To be fair, this is the 5th real poll I have, so this for the first time moves the 2008 election results used to seed the averages out, and makes this the first look that is based solely on Obama vs Romney polling. It does though move Washington from the “Strong Obama” category down to my “Weak Obama” category. I keep thinking maybe I should rename the categories, because a 9.5% lead isn’t exactly all that “Weak”. But leads that size have been known to disappear via strong campaigning, major events in the campaign, etc. The right way to interpret this category is “Candidate has a decent lead, but not so huge they can take the state for granted.” My name just sucks a little. :-)

In any case, since this doesn’t effect a swing state, this doesn’t move the basic numbers of the race:

Romney Obama
Romney Best Case 311 227
Current Status 210 328
Obama Best Case 170 368

This is the first movement on our charts toward Romney since January 11th though, so that is worth noting.

Chart from the Abulsme.com 2012 Electoral College Prediction page. Lines represent how many more electoral votes a candidate has than is needed to tie under several different scenarios.

Electoral College: Michigan moves further toward Obama

Map from the Abulsme.com 2012 Electoral College Prediction page.

I’ve switched the color of the swing states to gold to make them stand out more. Also note this analysis is strictly Obama vs Romney. If some other candidate takes the delegate lead on the Republican side, I’ll start an analysis for them too, but not before.

The big change today is that a new poll moves my five poll average for Michigan to a greater than 5% lead for Obama. This takes it out of my “Lean Obama” swing state category and into the “Weak Obama” category, meaning that Obama has a nice lead in the state, but not so large he can take it for granted.

In terms of the range of outcomes that seem possible (again, if the election were held today, which it won’t be, and a lot will happen before November), we consider as the extremes of what is likely all the swing states going one way or the other. This is a highly unlikely outcome in and of itself, but it serves to bound the range of possible outcomes. With Michigan slipping out of the swing state category, this means Romney’s best case scenario is now Romney 311 – Obama 227. To achieve this he would need to win all the states where he is currently ahead in polling, and also pull Florida, Pennsylvania, Ohio, Virginia, Colorado, Iowa and Nevada away from Obama.

The situation if everybody wins the states they are currently ahead in remains Obama 328 – Romney 210.

Chart from the Abulsme.com 2012 Electoral College Prediction page. Lines represent how many more electoral votes a candidate has than is needed to tie under several different scenarios.