This is the website of Abulsme Noibatno Itramne (also known as Sam Minter).
Posts here are rare these days. For current stuff, follow me on Mastodon
|
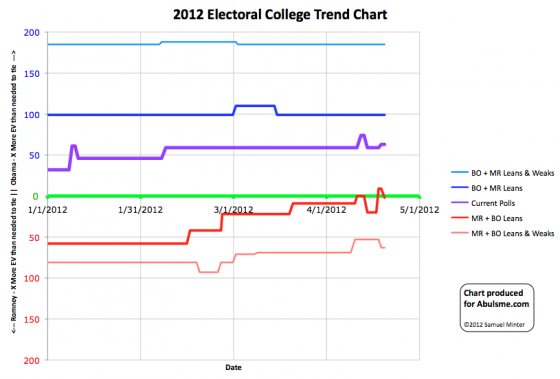
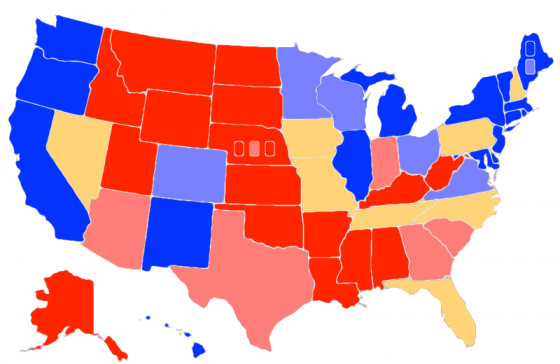
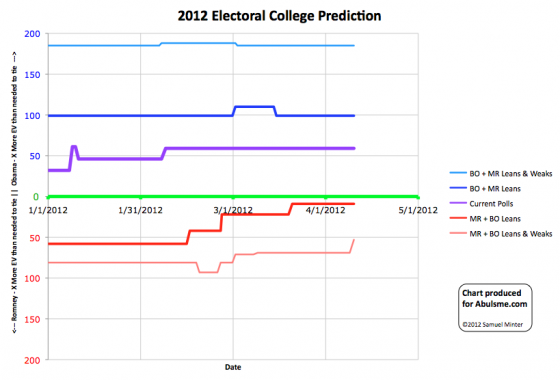
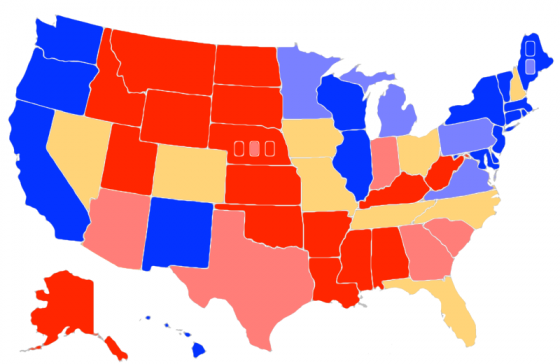
Chart and map from the Abulsme.com 2012 Electoral College Prediction page. Both assume Obama vs Romney with no strong third party candidate. Both show polling as it currently exists. Things will change before election day. Lines on the chart represent how many more electoral votes a candidate would have than is needed to tie under several different scenarios. Up is good for Obama, Down is good for Romney. On the map Red is Romney, Blue is Obama, Gold States are too close to call.
Two changes today based on new polls added to my master spreadsheet. And they both change the inventory of swing states, so important changes at that! Here are the details:
Florida (29 electoral votes): Just two days ago the five poll average moved Obama’s lead in Florida to over 5% (5.2%) and thus moved the state out of swing state status and into the “Weak Obama” category. Well, that didn’t last very long. Today’s update puts Obama’s 5-poll lead at 4.0%, so the state goes back into the “Lean Obama” category and is once again classified as a swing state for our model. Florida is big at 29 electoral votes, so makes a big difference in the electoral math.
Ohio (18 electoral votes): Meanwhile, Obama’s lead in Ohio goes above 5% to 5.2% in the five poll average. This removes Ohio from the swing state pool and moves it into the “Weak Obama” group. This means Obama has a decent lead at the moment, but not so big that it wouldn’t be worth Romney’s time to try to attack that lead and pull Ohio back to being a close contest. Ohio is one of those states that everyone expects to be close, so don’t be surprised if, like Florida, Ohio doesn’t stay in this status too long.
All and all since Florida is “worth more” than Ohio, today’s moves are good for Romney. And in fact, this once again makes it so if Romney wins all the swing states, he wins the election…
|
Romney |
Obama |
| Romney Best Case |
271 |
267 |
| Current Status |
206 |
332 |
| Obama Best Case |
170 |
368 |
While some states have moved in both directions, if we look at all the changes in April so far, Obama is still in a better position than he was at the beginning of the month. We still haven’t had enough state polls to detect the recent move in Romney’s direction over the last week and a half. If Romney hold his position in the national polls, expect more states to move in Romney’s direction over the next few weeks.
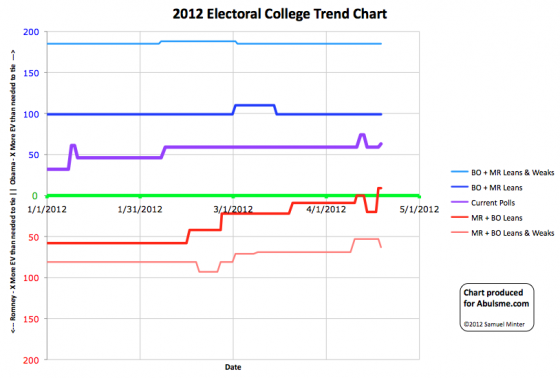
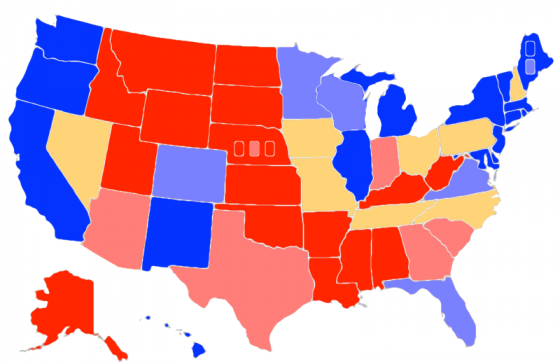
Chart and map from the Abulsme.com 2012 Electoral College Prediction page. Both assume Obama vs Romney with no strong third party candidate. Both show polling as it currently exists. Things will change before election day. Lines on the chart represent how many more electoral votes a candidate would have than is needed to tie under several different scenarios. Up is good for Obama, Down is good for Romney. On the map Red is Romney, Blue is Obama, Gold States are too close to call.
Two changes in our poll classifications today based on new additions to our five poll averages.
First, Obama’s lead in Wisconsin (10 electoral votes) drops to less than 10% bringing Wisconsin into the “Weak Obama” category. Since this is still not a swing state, our “Romney Best Case” scenario still doesn’t include Romney winning Wisconsin. But this does mean that Wisconsin is potentially in play. With the right combination of campaigning and events, Obama’s lead in Wisconsin could drop below 5%, putting it into contention as a swing state. It is not there today… Obama’s lead in the five poll average is still 8.8%… but it is close enough now to be worth spending time and money in the state.
Second, New Hampshire (4 electoral votes) moves from being just barely Romney to being just barely Obama. (Obama’s lead in the five point average is 1.7%, which is negligible and can disappear in an instant.) New Hampshire remains too close to call and therefore one of our swing states. But this does change our “everybody wins the states they are ahead in” scenario.
|
Romney |
Obama |
| Romney Best Case |
260 |
278 |
| Current Status |
210 |
328 |
| Obama Best Case |
170 |
368 |
Romney’s best case with current polling results remains a loss. And the “current status” improves for Obama because of New Hampshire.
But Wisconsin does show there is some movement in Romney’s direction at the moment. Over the last eight days we’ve seen Obama’s lead in RCP’s National Poll average drop from 5,4% to 1.7%. That is a very significant drop. We’ll see over the next few weeks as more state polls come in whether this starts to translate into electoral college gains as well. The expectation is that as long as the national poll trend is sustained, the state numbers will move correspondingly as soon as we have enough state polls to show it.
Edit 2012 Apr 19 07:10 UTC – Added number of electoral votes for each state mentioned.
Edit 2012 May 30 15:47 UTC – It turns out New Hampshire’s move from Lean Romney to Lean Obama should actually have happened on Mar 31. Details of correction and revised historical chart posted on May 30.
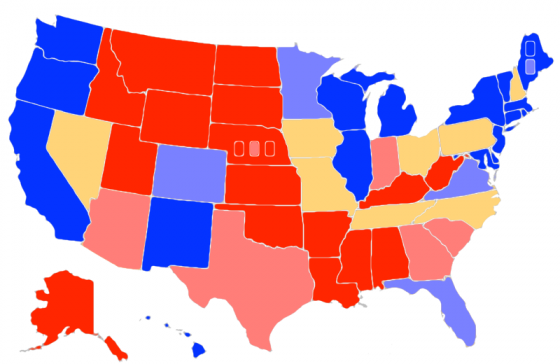
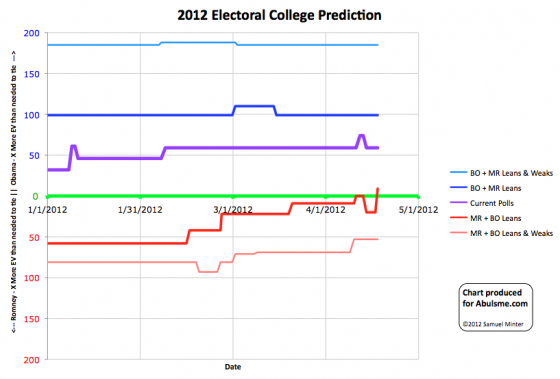
Map and chart from the Abulsme.com 2012 Electoral College Prediction page. Both assume Obama vs Romney with no strong third party candidate. Both show polling as it currently exists. Things will change before election day. On the map Red is Romney, Blue is Obama, Gold States are too close to call. Lines on the chart represent how many more electoral votes a candidate would have than is needed to tie under several different scenarios. Up is good for Obama, Down is good for Romney.
Remember how a few days ago I said things were starting to improve for Romney? Well, that didn’t last long…
Obama’s lead in the five poll average for Florida increases to over 5%. It leaves the swing states and moves to “Weak Obama”. My “best case scenarios” give one candidate or another all of the swing states. Florida makes a big difference. So what do things look like now?
|
Romney |
Obama |
| Romney Best Case |
260 |
278 |
| Current Status |
210 |
328 |
| Obama Best Case |
170 |
368 |
Yes, that is right. With current state polling, if Romney wins ALL of the states that are close…
He still LOSES 260 to 278.
There are major caveats to give:
- November is still far away. Romney hasn’t geared up his campaign machine. Important states are not yet being blanketed by advertisements. We haven’t had the conventions yet. Most people aren’t paying attention yet. News events will change the agenda. The situation in April is not a good predictor of what will happen in November. Obama has a head start. That is all that can be said.
- State polling is still sparse. In Florida, five polls goes back to January. Florida is more frequently polled than many others. Some states actually haven’t been polled at all. Until polling ramps up, this projection will lag events.
Despite this, it is remarkable for Obama to be showing this kind of lead. Romney has a lot of work to do. But wait…. haven’t there been polls in the news lately showing Romney ahead? What is going on?
First, never pay attention to individual polls. Instead look at one of the places that aggregate. Lets look at RCP’s Average. Obama’s lead was usually between 4% and 6% from February until April. It was 5.3% on April 10th. It declined to 2.4% on April 14th. This dip is eight days old. Too short to be picked up in state polls. The projection here is consistent with the lead Obama showed until the last few days. If the new trend is sustained, it will show up in the state results soon.
Second, the president is not elected by popular vote. It doesn’t matter if Obama is ahead in California by a little more or less. Obama will win California. But that will show up in national polls. Popular vote and electoral college will only diverge in close elections, but the election is decided by the electoral college. Look at the popular vote polls as leading indicators, but in the end, look at the electoral college. That is how Presidential elections work.
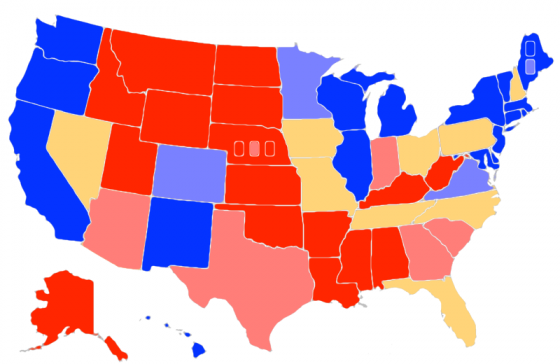
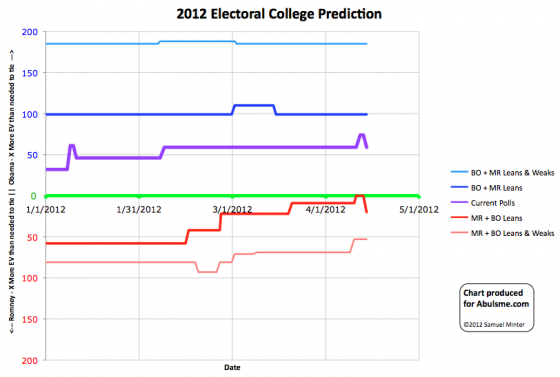
Map and chart from the Abulsme.com 2012 Electoral College Prediction page. Both assume Obama vs Romney with no third party strong enough to win states. Both show the polling situation as it currently exists. Things can and will change before election day. On the map Red is Romney, Blue is Obama, Gold States are too close to call. Lines on the chart represent how many more electoral votes a candidate would have than is needed to tie under several different scenarios. Up is good for Obama, Down is good for Romney.
As we have been saying for the last few updates, at some point the trend making things look better and better for Obama would come to an end. Today is that day. Two states change categories.
North Carolina: Only two days ago North Carolina moved from just barely Romney to just barely Obama in our five poll average. Well, a new poll there gets added today, and moves it back to just barely Romney. Easy come, easy go. In either case, it is really too close to call and counts as a swing state in our analysis.
Pennsylvania: The five poll average prior to today had Obama up by 5.6% in Pennsylvania. Today’s update drops Obama’s lead to 4.4% in the five poll average, which takes the state out of “Weak Obama” territory and back into too close to call swing state status. (5% leads can disappear overnight given the right events after all.)
The new summary becomes:
|
Romney |
Obama |
| Romney Best Case |
289 |
249 |
| Current Status |
210 |
328 |
| Obama Best Case |
170 |
368 |
The “best cases” are when a candidate wins ALL the swing states, not just the ones they are ahead in. “Current Status” is if everybody wins the states they are even a tiny bit ahead in.
Romney can once again win outright in his best case, not just tie and win in the House of Representatives.
Trendwise though, these are the first moves in Romney’s direction in almost a month. (The last time was March 16th when Arizona moved from being a swing state to Weak Romney.) So the question of course is: Does that mean we have just passed Obama’s high water mark and Romney will continue gaining ground for awhile?
My expectation is that we’ll have a bit more movement in Romney’s direction over the next few months as the general election is joined in earnest. This is natural as Romney is finally able to start crafting his general election message and, yes, moving toward “the center” to appeal to swing voters and swing states. Prior to a few days ago, he has had to concentrate on trying to get votes from Republicans… which is a very different game.
We shall see soon enough I guess. :-)
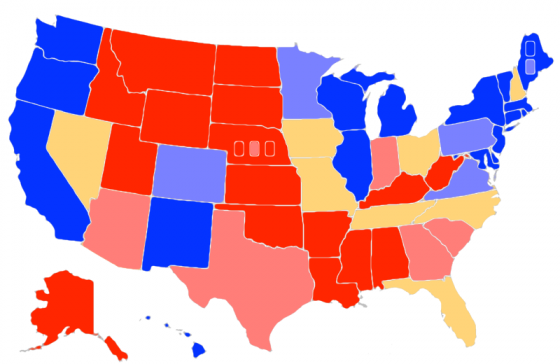
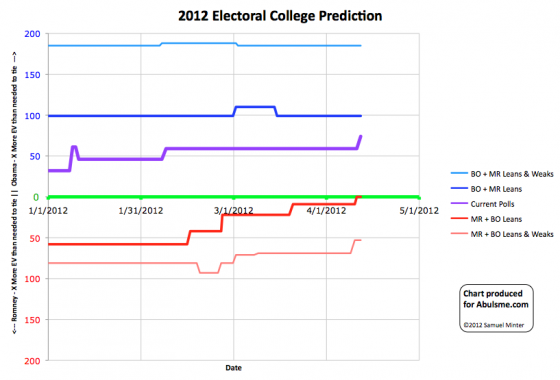
Map and chart from the Abulsme.com 2012 Electoral College Prediction page. Both assume Obama vs Romney with no third party strong enough to win states. Both show the polling situation as it currently exists. Things can and will change before election day. On the map Red is Romney, Blue is Obama, Gold States are too close to call. Lines on the chart represent how many more electoral votes a candidate would have than is needed to tie under several different scenarios. Up is good for Obama, Down is good for Romney.
The latest polls move my five poll average in North Carolina from barely Romney to barely Obama. The reality is that the margin is still essentially too close to call (Obama ahead by 0.2%). North Carolina is firmly a swing state at the moment. So this doesn’t change the range of possibilities between Obama getting all swing states and Romney getting all swing states… but it does move our “everybody gets the states they are ahead in” line further toward Obama. In this case, we have Obama now winning 343 to 195.
This is the third change in three days in Obama’s favor.
The summary:
|
Romney |
Obama |
| Romney Best Case |
269 |
269 |
| Current Status |
195 |
343 |
| Obama Best Case |
170 |
368 |
Edited 2012 Apr 12 21:24 UTC to replace an errant “McCain” with the intended “Romney”. Thanks JH for pointing out the error.
In the latest Curmudgeon’s Corner Sam talks about:
- Car GPSes
- Goodbye Santorum
- General Election 2012
- Interpreting Election Coverage
Just click to listen now:
[wpaudio url=”http://www.abulsme.com/CurmudgeonsCorner/cc20120410.mp3″ text=”Recorded 10 Apr 2012″]
or
 1-Click Subscribe in iTunes 1-Click Subscribe in iTunes
 View Podcast in iTunes View Podcast in iTunes
 View XML Feed View XML Feed
|
 |

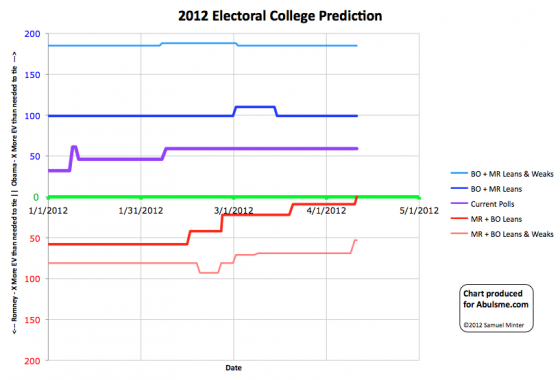
Map and chart from the Abulsme.com 2012 Electoral College Prediction page. Both assume Obama vs Romney with no third party strong enough to win states. Both show the polling situation as it currently exists. Things can and will change before election day. On the map Red is Romney, Blue is Obama, Gold States are too close to call. Lines on the chart represent how many more electoral votes a candidate would have than is needed to tie under several different scenarios. Up is good for Obama, Down is good for Romney.
Just yesterday I was mentioning that at some point things have to stop getting worse for Romney. Yesterday was not that day. Neither is today. Today my poll average for Colorado sees Obama’s lead increase to over 5%. So I color the state light blue and take it out of swing state status.
So, if we give Romney every single one of the remaining swing states… we end up with a 269 to 269 electoral vote tie. In all fairness, ties go to the House and almost certainly that would lead to a Romney win. So Romney can still pull out that very messy win.
But this means that with current polling Romney would not be able to manage a direct win in the electoral college, even in the most favorable disposition of the swing states. That is a remarkably bad position to be in, even this early.
The overall summary looks like this:
|
Romney |
Obama |
| Romney Best Case |
269 |
269 |
| Current Status |
210 |
328 |
| Obama Best Case |
170 |
368 |
Given that, lets compare to four years ago…
On April 11th 2008 if each candidate won every state where they were ahead, McCain would have beaten Obama 283 to 255. He would have won by 28 electoral votes. That is a tight victory in electoral college terms but it is a victory.
Meanwhile, today, if each candidate won every states where they are ahead, Obama would beat Romney 328 to 210. That is a 118 electoral vote margin.
Romney is in a much worse position now than McCain was in four years ago. Of course McCain ended up losing by a pretty substantial margin. So should we all just go home? Obama is going to win, so why bother even having a campaign? No. Not hardly. If we were seeing these numbers in October… then maybe, like I did on October 3rd 2008 when McCain’s best case got this bad, I’d say exactly that. But it is not October. It is April.
Despite McCain’s small lead at this time four years ago the actual election ended up being Obama 365 McCain 173… a 192 electoral vote margin for Obama. So big swings can happen. In 2008 between April 11th and election day 110 electoral votes moved in Obama’s direction. If Romney’s campaign manages to move a similar 110 electoral votes his way… he would win easily.
So even though Obama is way ahead based on today’s polling, the battle has just barely begun. There is a lot more to come.
As our recently departed Senator Santorum would say, “Game On!”
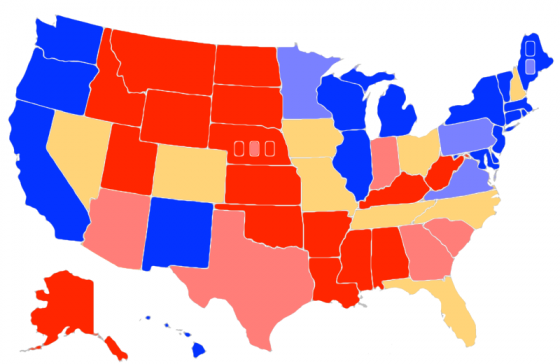
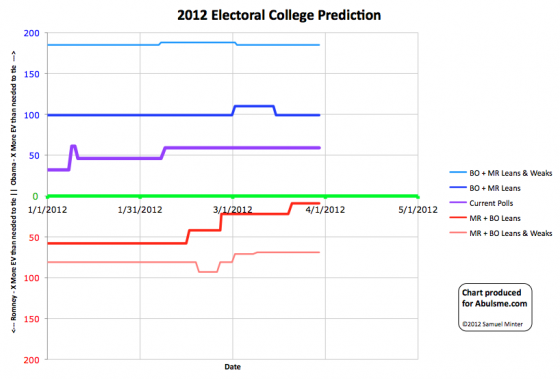
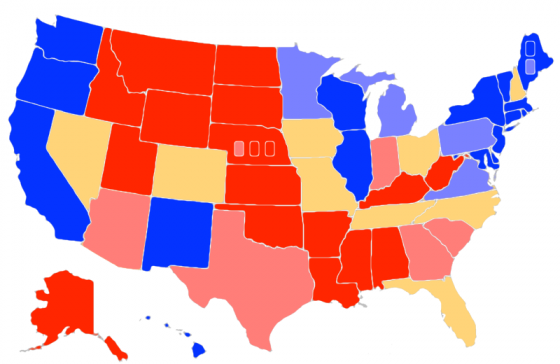
Map and chart from the Abulsme.com 2012 Electoral College Prediction page. Both assume Obama vs Romney with no third party strong enough to win states. On the Map Red is Romney, Blue is Obama, Gold States are too close to call. Lines on the chart represent how many more electoral votes a candidate has than is needed to tie under several different scenarios. Up is good for Obama, Down is good for Romney.
At some point things have to stop getting worse for Romney, right? As he pivots from the primaries to the general election, he’ll start pulling back support from the middle and start gaining ground again, right? Well, probably. But not yet. In today’s update the 5 poll average for Michigan moves to Obama having more than a 10% lead in that state. So we color the state dark blue. Essentially this means it is a state Romney probably shouldn’t bother putting any resources into at all. The situation may change later, but for the moment, it is out of reach.
Since Michigan isn’t moving in or out of Swing State status, the overall summary remains the same with Obama clearly the favorite by a large margin, but Romney still being able to squeak by with a win if he manages to sweep all of the too close to call swing states:
|
Romney |
Obama |
| Romney Best Case |
278 |
260 |
| Current Status |
210 |
328 |
| Obama Best Case |
170 |
368 |
One thing to keep in mind at this stage is that state polling is still sparse. So the “five poll averages” I use for this analysis can cover a lot of time. For instance, in Michigan my five poll average currently has polls that were done all the way back through January. (Specifically it includes one from January, two from February, one from March and one from April.)
There are still just a handful of state polls per week. Some states actually haven’t even been polled at all and I’m extrapolating based on the 2004 and 2008 elections. I’m also doing a straight average, not a recency weighted average. Because of this, this analysis will react more slowly to changes in the political situation.
At least that is the situation here in April. As we get closer and closer to November, we’ll have a faster and faster pace of polls. By the time we get to October we will have many new state polls every week, and changes in this analysis will be much more frequent and catch changes faster.
Edit 2012 May 30 15:49 UTC: It turns out that between the last update on Mar 30 and this one New Hampshire should have moved from Weak Romney to Lean Romney on Mar 31. At that time however, I was missing some polls and thought New Hampshire was already Lean Romney, so no update was posted. This is corrected in the historical charts starting on May 30.
Map and chart from the Abulsme.com 2012 Electoral College Prediction page. Both assume Obama vs Romney with no third party strong enough to win states. Lines on the chart represent how many more electoral votes a candidate has than is needed to tie under several different scenarios. Up is good for Obama, Down is good for Romney.
So my update today included a new PPP poll in Nebraska. This poll included a breakdown by congressional district, which is useful because Nebraska is one of two states (the other is Maine) which currently have the potential of splitting their electoral college vote. Both states do this with 2 electoral votes going to the statewide winner, then 1 electoral vote for the winner of each congressional district. Thanks PPP for actually doing the CD split!!
Anyway, as I was adding the new data points for Nebraska at large and each of the three congressional districts, I noticed the previous data for the 1st and 2nd congressional districts included some errors. (Specifically the 2008 Republican and Democratic results were reversed… I use the 2004 and 2008 elections to seed the numbers for states that have had less than five actual Obama vs Romney polls.) The end result of this was that the 1st district had been classified as Weak Romney when it should have been Strong Romney, and the 2nd district was classified as Strong Romney when it should have been Weak Romney. I corrected this and the new poll results didn’t change the classifications again.
The net result of this is just that on the map I had the wrong one of the three boxes in Nebraska light red. It should have been the 2nd box instead of the 1st. This has now been corrected. Since both districts are one electoral vote and the changes balanced each other, the lines on the graph do not change at all.
The summary remains:
|
Romney |
Obama |
| Romney Best Case |
278 |
260 |
| Current Status |
210 |
328 |
| Obama Best Case |
170 |
368 |
Note 2012 May 23 10:43 UTC: Due to an error in my spreadsheet, a change in status for Wisconsin from Weak Obama to Strong Obama that should have been noted on this update on March 30th, was prematurely made on March 2nd. The corrected time series chart can be seen starting with the May 23rd update. Thanks to Darryl at HorsesAss for finding the mistake.
Note 2012 Jun 16 21:22 UTC: Actually, with more information, the Wisconsin transition should have happened on March 31st. See the correction on the June 19th update.
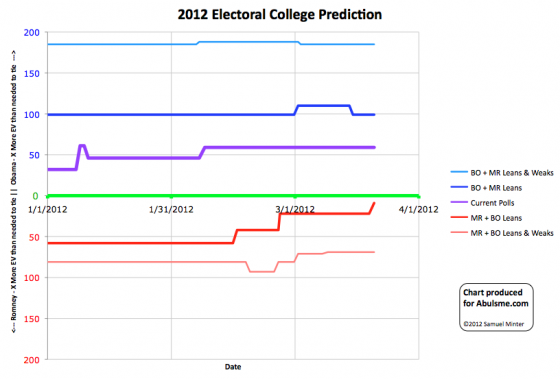
Map and chart from the Abulsme.com 2012 Electoral College Prediction page. Both assume Obama vs Romney with no third party strong enough to win states. Lines on the chart represent how many more electoral votes a candidate has than is needed to tie under several different scenarios. Up is good for Obama, Down is good for Romney.
Surely we must be close to Romney’s nadir, right? We expect him to suffer in the polls while going through his primary battle, but once it becomes clear he is the nominee and he can start pivoting to the general election, he should start fighting back. Right? That’s what we expect? Romney should hope that this is his low point, because his best case is now just barely squeaking out a win…
The new update today to my “last five poll average” for Virginia pushes Obama’s lead to over 5%. So I move the state out of the swing state category and into “Weak Obama” which I color light blue above.
This change makes our summary look like this:
|
Romney |
Obama |
| Romney Best Case |
278 |
260 |
| Current Status |
210 |
328 |
| Obama Best Case |
170 |
368 |
This means that in Romney’s best case (that is, he wins every single swing state), he wins with only 9 more electoral votes than the 269 needed to tie. That is getting awfully close.
That would mean that out of the nine swing states (defined as states where the leading candidate is ahead by less than 5% in the polls)…
- Romney MUST win Florida (29), Ohio (18), North Carolina (15), Tennessee (11) and Missouri (10) to win.
- He could afford to lose ONE of Iowa (6), Nevada (6) or New Hampshire (4) and still win.
- If he won all the rest, but lost Colorado (9) then we’d end up with a 269 to 269 tie, which would throw the election to the House of Representatives (voting by state delegation) which would likely result in a Romney win as well.
(Meanwhile, in Obama’s best case, he wins with 99 more electoral votes than needed to tie.)
That is of course if the election was today, which it is not. We have a long way to go. These lines will move up and down quite a bit before we get to November.
|
|


