This is the website of Abulsme Noibatno Itramne (also known as Sam Minter).
Posts here are rare these days. For current stuff, follow me on Mastodon
|
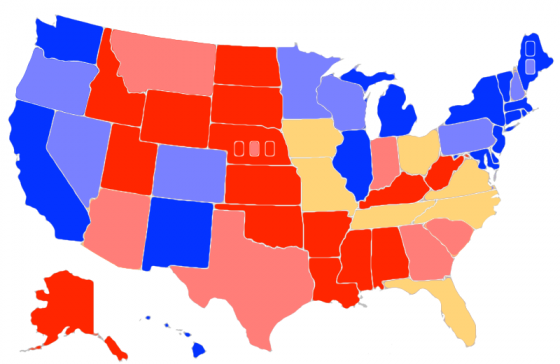
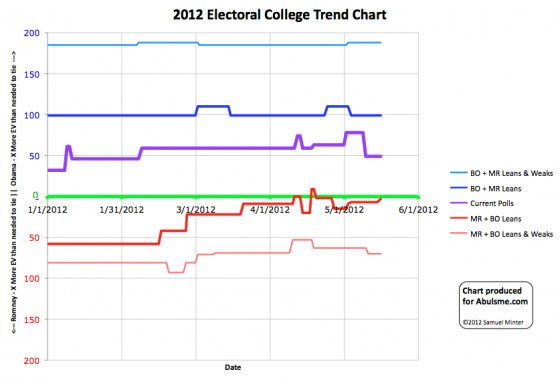
Chart and map from the Abulsme.com 2012 Electoral College Prediction page. Both assume Obama vs Romney with no strong third party candidate. Both show polling as it currently exists. Things will change before election day. On the map red is Romney, blue is Obama, gold states are too close to call. Lines on the chart represent how many more electoral votes a candidate would have than is needed to tie under several different scenarios. Up is good for Obama, Down is good for Romney.
One state changes status today. This time it is a move toward Obama:
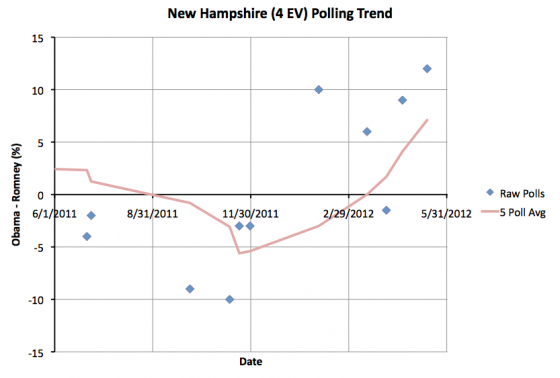
The five poll average goes from an Obama lead of 4.1%, which we consider close enough to call the state a swing state, to a 7.1% lead, which we consider large enough to call New Hampshire a “Weak Obama” state. So it gets colored blue for now.
Since New Hampshire is no longer in our swing category, we take the possibility of winning it out of Romney’s Best case. This leaves us with:
|
Romney |
Obama |
| Romney Best Case |
272 |
266 |
| Current Status |
220 |
318 |
| Obama Best Case |
170 |
368 |
Romney’s new best case has him with just 3 more electoral votes than a 269-269 tie. This leaves his path to victory very narrow indeed. Assuming he retains all of the states he is ahead by more than 5% in, he would then have to still win ALL of the swing states that are currently too close to call. Florida (27), Ohio (18), North Carolina (15), Virginia (13), Tennessee (11), Missouri (10), and Iowa (6) all become must win states. Lose any one of those, and the election is lost.
Of course, there is still plenty of time to pull more states that are currently “Weak Obama” states back into the swing state category. Pull Pennsylvania (20), Minnesota (10) or Wisconsin (10) back from Obama and make them competitive, and all of a sudden there would be a lot more ways to win. Colorado (9), Oregon (7), Nevada (6) or New Hampshire (4) would help too, just not as much. I suppose a play might even be made at Maine’s 2nd Congressional District (1). At the moment though, Obama has healthy leads in those states (and the CD).
Edit 2012 May 20 06:35 UTC – Fixed Map, SC was incorrectly colored as a swing state, it is now correctly colored as “Weak Romney”.
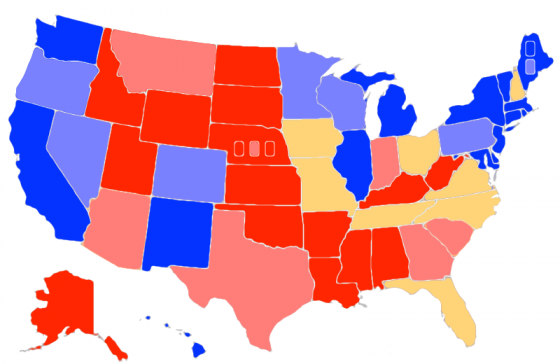
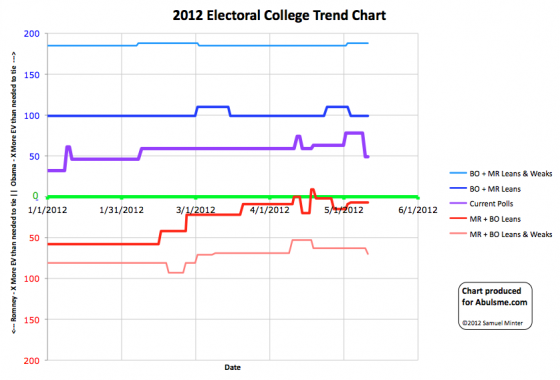
Chart and map from the Abulsme.com 2012 Electoral College Prediction page. Both assume Obama vs Romney with no strong third party candidate. Both show polling as it currently exists. Things will change before election day. On the map red is Romney, blue is Obama, gold states are too close to call. Lines on the chart represent how many more electoral votes a candidate would have than is needed to tie under several different scenarios. Up is good for Obama, Down is good for Romney.
One state changing status today, and once again it is a move in Romney’s direction:
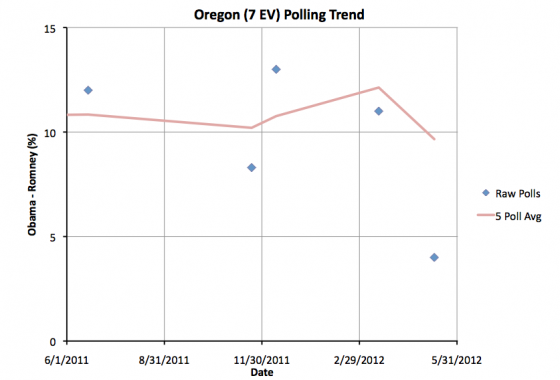
Obama’s lead in the five poll average drops from 12.1% to 9.7%. So we no longer classify it as “Strong Obama”, but rather “Weak Obama”. Now, the average is still well over 5% (despite the most recent poll) so Oregon is still nowhere near being a swing state. In the last year there hasn’t been a single poll showing Romney leading in Oregon. But the lead is no longer so big that Obama would be safe completely ignoring the state. Romney could cause some heartburn for Obama there if he put some effort into the state.
There have also only been five Oregon polls in the last year. If additional polling shows the current status is closer to the most recent poll than the previous four, and Romney continues to make gains, then Oregon may well move into swing state status later in the race.
Since Oregon is neither entering or leaving swing state status, the summary stays the same:
|
Romney |
Obama |
| Romney Best Case |
276 |
262 |
| Current Status |
220 |
318 |
| Obama Best Case |
170 |
368 |
Edit 2012 May 20 06:30 UTC – Fixed Map, SC was incorrectly colored as a swing state, it is now correctly colored as “Weak Romney”.
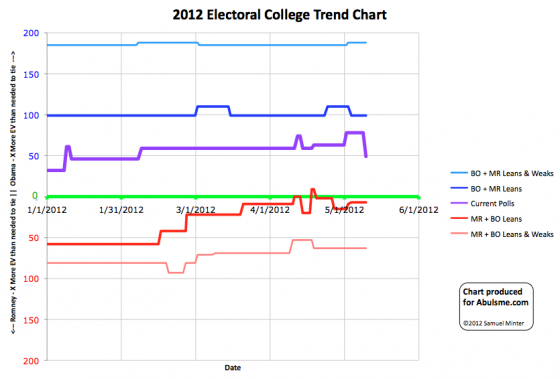
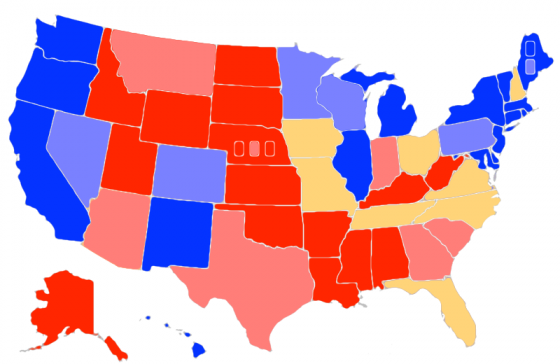
Chart and map from the Abulsme.com 2012 Electoral College Prediction page. Both assume Obama vs Romney with no strong third party candidate. Both show polling as it currently exists. Things will change before election day. On the map red is Romney, blue is Obama, gold states are too close to call. Lines on the chart represent how many more electoral votes a candidate would have than is needed to tie under several different scenarios. Up is good for Obama, Down is good for Romney.
One state changes status today, and it is a big one!
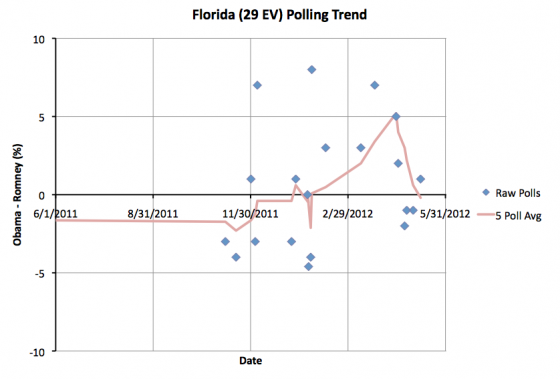
In my five poll average Florida moves from Obama up by 0.6% to Romney up by 0.2%. In either case, the bottom line is that Florida is too close to call and could go either way. The recent trend has been toward Romney though. We’ll see if Romney can pull Florida closer toward him, or if it remains a super close swing state. (Which is kind of what everyone expects.)
Anyway, a big state flips to the Romney side. This effects the “current” line by moving 29 electoral votes in Romney’s direction, but the “best cases” representing the range of possible outcomes stay the same:
|
Romney |
Obama |
| Romney Best Case |
276 |
262 |
| Current Status |
220 |
318 |
| Obama Best Case |
170 |
368 |
I had said I wouldn’t mention national level polls much, but there has been a big enough move there lately to warrant another mention. In the last couple of weeks there has been a substantial move toward Romney in the national polls, with the RCP Average dipping to an Obama lead of as low as 0.2% on May 8th, although it is back to 1.3% as of today. So why do the state numbers still show a massive Obama lead?
There are two answers, one is of course that the election is based on the states, not the national popular vote, and they do not always move in lockstep. But frankly, they DO usually move together, and only tend to diverge much in really close situations. The electoral college just usually shows an “amplified” version of the separation between the candidates in the national popular vote.
The more important factor right now is the second answer. State polls are still slow. There are new national polls every day. Meanwhile even important close states like Florida are still getting polled only once a week or so. Most states are polled even less frequently. This means that any state by state analysis will take longer to react to changes.
If the race narrows significantly and stays narrowed, the state numbers will start showing that soon enough. (And state polling in close states will get increasingly frequent as we approach the election, so this lag will decrease dramatically later in the year.)
Edit 2012 May 10 15:56 UTC – Moved summary box earlier in post.

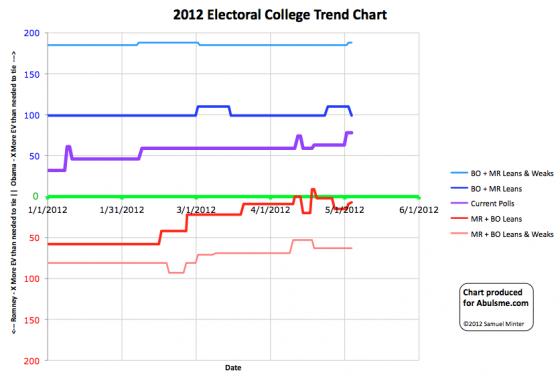
Chart and map from the Abulsme.com 2012 Electoral College Prediction page. Both assume Obama vs Romney with no strong third party candidate. Both show polling as it currently exists. Things will change before election day. On the map red is Romney, blue is Obama, gold states are too close to call. Lines on the chart represent how many more electoral votes a candidate would have than is needed to tie under several different scenarios. Up is good for Obama, Down is good for Romney.
Today is an exciting day. THREE states change categories.
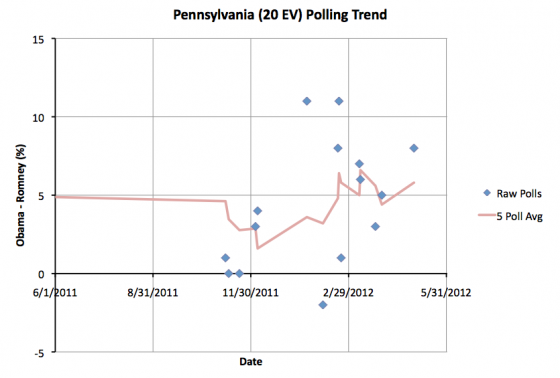
First up, Obama’s lead in Pennsylvania moves over 5%, so we pull it out of swing state status again. We’d listed Pennsylvania as a swing state since April 14th. The five poll average now has Obama up by 5.8%. This is still pretty close to the boundary, so a poll or two in Romney’s direction could pull Pennsylvania back, but for now we no longer consider Romney winning PA in our “Romney Best Case” scenario.
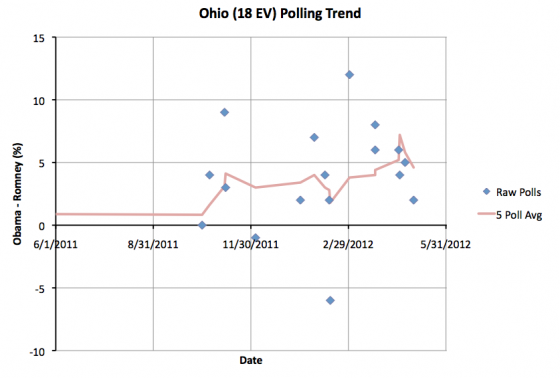
Second, Ohio gets tighter. Obama’s lead drops to 4.6%, which means I consider it a swing state again, and Romney’s best case scenario now includes Ohio. Ohio has usually been considered a swing state, and our five poll average only showed a greater than 5% lead for Obama from Apr 20 until today… two weeks. So this is a return to Ohio’s “normal” status. Ohio (18 ev) moving back toward Romney balances the Pennsylvania (20 ev) move, so the overall loss to Romney’s best case is only 2 electoral votes.
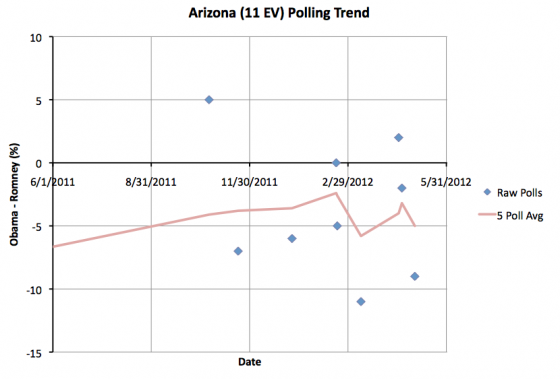
Third, Arizona moves back toward Romney. There has been talk of Arizona being a red state that Obama may be able to pick off and win. For the moment though, that looks less likely. According to my definition, I consider states to be swing states if the lead in the five poll average is LESS than 5.0%. At the moment the five poll average in Arizona is EXACTLY a 5.0% Romney lead, so the state moves back into “Lean Romney”. So I take winning Arizona off the table for Obama. At least for the moment. One poll could bring it back.
Between all three of these changes, the net affect is to narrow the range of possibilities between our Obama best case and Romney best case scenarios. Obama’s best case is worse by 11 electoral votes, and Romney’s best case is worse by 2 electoral votes.
|
Romney |
Obama |
| Romney Best Case |
276 |
262 |
| Current Status |
191 |
347 |
| Obama Best Case |
170 |
368 |
Romney’s best case remains very narrow. In order to win the presidency, he needs to win all of the states where he is currently ahead, including Tennessee (11 ev) and Missouri (10 ev) where polls currently show his lead is slim, then he MUST win Florida (27 ev), Ohio (18 ev), North Carolina (15 ev) and Virginia (13 ev), all of which are states where Obama is currently ahead by a narrow margin. Then he needs to win either Iowa (6 ev) or New Hampshire (4 ev) both of which are also leaning Obama at the moment.
Edit 2012 May 4 18:07 UTC – Corrected map, I had forgotten to color Ohio gold.
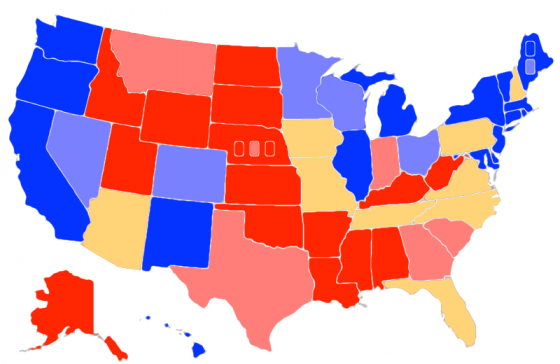
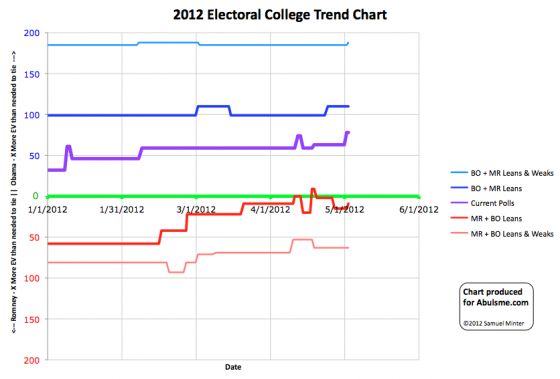
Chart and map from the Abulsme.com 2012 Electoral College Prediction page. Both assume Obama vs Romney with no strong third party candidate. Both show polling as it currently exists. Things will change before election day. On the map red is Romney, blue is Obama, gold states are too close to call. Lines on the chart represent how many more electoral votes a candidate would have than is needed to tie under several different scenarios. Up is good for Obama, Down is good for Romney.
There are two states changing category today. In order by number of electoral votes:
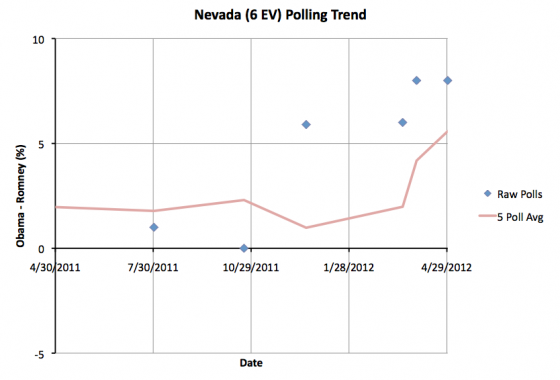
Nevada moves from a “Lean Obama” swing state into “Weak Obama” territory as Obama’s lead in the five poll average goes above 5% to 5.6%. This is still close enough to 5% that a poll or two in Romney’s direction could easily move this back into swing state territory. For the moment though, this means I no longer consider this one of the states Romney could win in his “best case” scenario. So that best case scenario gets slightly worse for Romney, now with Romney winning by just 278 to 260.
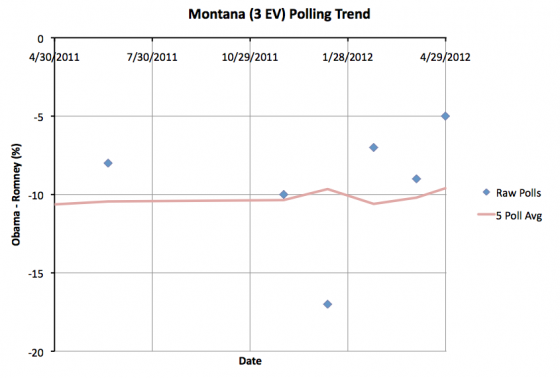
Next, Montana moves from “Strong Romney” to “Weak Romney” as Romney’s lead in the five poll average drops below 10% to a 9.6% lead. Now, make no mistake, a 9.6% lead is still very substantial. Montana is a long way from being a swing state. But with a lead under 10% and a trend moving in Obama’s direction, Romney may want to deploy some resources to defend the state even if Obama’s odds of actually flipping the state are very slim (and they are). Now, Montana is only 3 electoral votes… so maybe Romney won’t bother. But with all of Romney’s paths to victory currently being very narrow ones, every electoral vote counts, so Montana will probably get some attention. Because Montana was not and is not a swing state, this does not however change anything in our summary.
|
Romney |
Obama |
| Romney Best Case |
278 |
260 |
| Current Status |
191 |
347 |
| Obama Best Case |
159 |
379 |
With this new status Romney’s path to victory is holding all of his current Strong and Weak states, then from the swing states winning all of: Florida (29 ev), Pennsylvania (20 ev), North Carolina (15 ev), Virginia (13 ev), Arizona (11 ev), Tennessee (11 ev) and Missouri (10 ev). If he lost ANY of those states, he would lose the election overall. Of the current swing states, he can only afford to lose Iowa (6 ev) or New Hampshire (4 ev)… but not both.
If this was the polling in late October, the chances of Romney pulling off a victory would be pretty slim. (Not zero, a Romney win would still be possible, the odds would just be very strongly against it since it would require a near sweep of the swing states, including many where he is behind.)
It is of course not late October though. Romney has plenty of time to campaign and plenty of time to move critical states toward him.
Edit 2012 May 4 14:05 – Adding in my boilerplate intro paragraph, which I had forgotten.
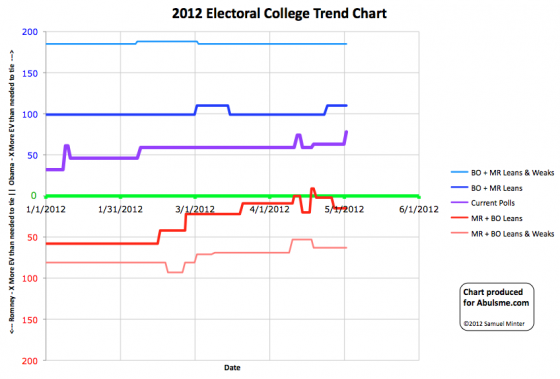
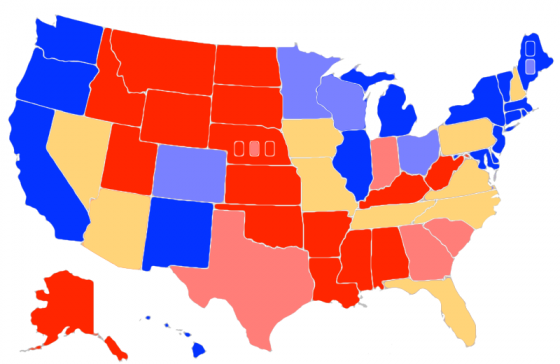
Chart and map from the Abulsme.com 2012 Electoral College Prediction page. Both assume Obama vs Romney with no strong third party candidate. Both show polling as it currently exists. Things will change before election day. On the map red is Romney, blue is Obama, gold states are too close to call. Lines on the chart represent how many more electoral votes a candidate would have than is needed to tie under several different scenarios. Up is good for Obama, Down is good for Romney.
One change today in my categorization of states. North Carolina:
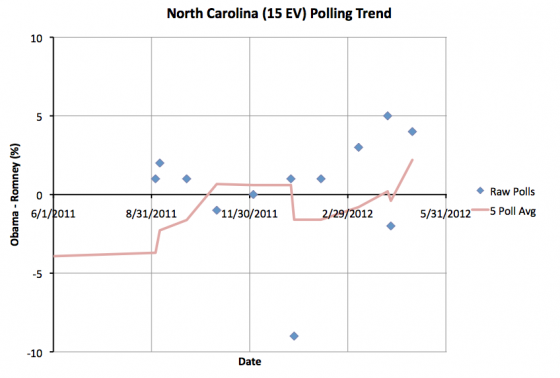
The last five polls go back to February, but now no longer include what now appears to be an outlier poll from Civitas in January that showed Romney up by 9%, so the five poll average pops upward and now sits at a 2.2% Obama lead. This leads me to classify North Carolina as “Leans Obama” again. But that lead is less than 5%, so really too close to call, and North Carolina stays a swing state in our model. As such, this only changes the “Current” line in our summary:
|
Romney |
Obama |
| Romney Best Case |
284 |
254 |
| Current Status |
191 |
347 |
| Obama Best Case |
159 |
379 |

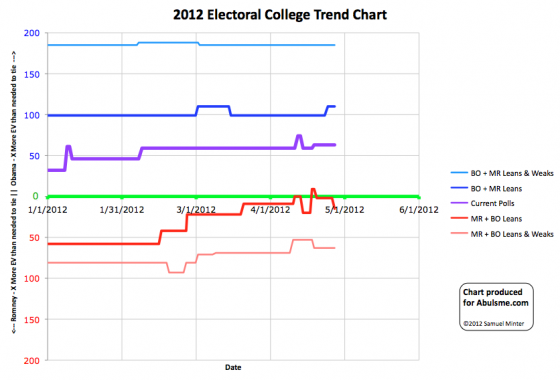
Chart and map from the Abulsme.com 2012 Electoral College Prediction page. Both assume Obama vs Romney with no strong third party candidate. Both show polling as it currently exists. Things will change before election day. On the map red is Romney, blue is Obama, gold states are too close to call. Lines on the chart represent how many more electoral votes a candidate would have than is needed to tie under several different scenarios. Up is good for Obama, Down is good for Romney.
One state changing categories today. Virginia.
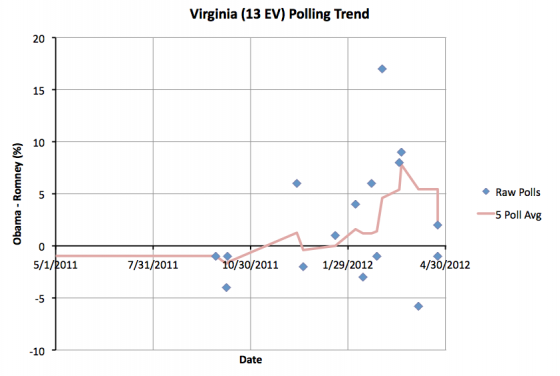
As you can see, The 5 poll average once again drops below 5%, moving the state from “Weak Obama” to “Lean Obama” and making Virginia once again one of the states we consider to be a swing state. The big effect here is the March 2nd Marist poll which showed Obama up by 17 in Virginia rolling off the 5 poll average. That poll was clearly an outlier. Even without it, we see a trend toward Obama around that time, but it wouldn’t have been large enough to move the average over a 5% lead without that one poll. In addition, the more recent polls have been moving in Romney’s direction. In any case, as of now the new 5 poll average has Obama up in Virginia by 2.4%. Clearly in the swing state category.
This change improves Romney’s best case scenario (where we give him all the swing states):
|
Romney |
Obama |
| Romney Best Case |
284 |
254 |
| Current Status |
206 |
332 |
| Obama Best Case |
159 |
379 |
Since Santorum dropped out on April 10th, there have been 11 changes to state categories. In the case of Florida (29 ev) and North Carolina (15 ev), they changed categories, but already changed back to where they were… so no net change. Ohio (18 ev), Arizona (11 ev), Colorado (9 ev) and New Hampshire (4 ev) moved toward Obama. Pennsylvania (20 ev), Virginia (13 ev) and Wisconsin (10 ev) moved toward Romney. The main net effect is slightly more electoral votes in the swing state category, so a bit larger range between Obama’s best case and Romney’s best case.
Comparing to my last update before Santorum dropped out…
- Romney has improved his best case from 278 electoral votes to 284 electoral votes
- Obama has improved his best case from 368 electoral votes to 379 electoral votes.
- The “everybody gets every state they are ahead in even slightly” result changes from Obama winning 328 to 210 to Obama winning 332 to 206.
All in all, the main result here is the race opening up since the last small doubts of Romney being the nominee were put to rest. The polls are tightening and more states are up for grabs. Obama still has a big advantage in the electoral college… for the moment. It has only been 17 days since Santorum dropped out. My expectation is that this race becomes closer as events play out over the next few months.
Edit 2012 May 2 13:10 UTC – Adjusted horizontal scale on Virginia Graph
You may have heard some reports that this already happened back at the beginning of April (CNN reported it for instance), but I can’t figure out any math to back that up other than someone mistakenly thinking that since more than 50% of the Republican delegates had been allocated, the same must have been true for the Democrats. Not true. Different calendars.
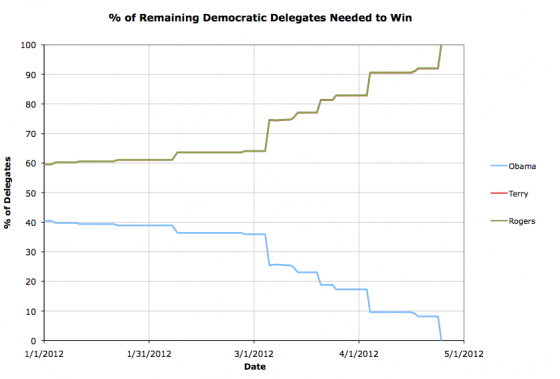
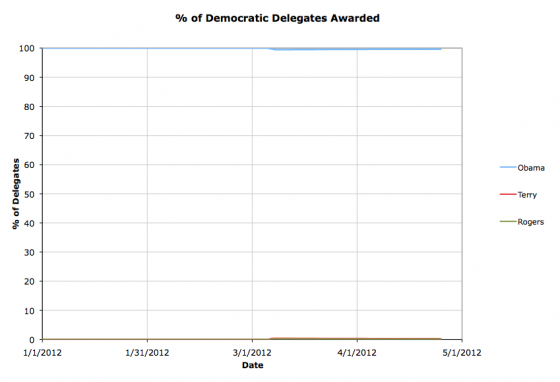
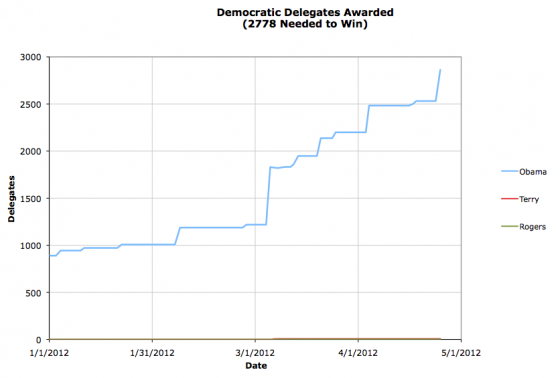
Anyway, while the fun has been on the Republican Side I have been diligently tracking the Green Papers numbers for the Democrats too. Their soft count does not include Democratic Superdelegates, but I think it is a pretty safe bet that 100% of the Democratic Superdelegates will vote for Obama at the convention, so I have been including those in my own counts for the Democrats. Given that assumption, plus Green Papers’ tally of the results from primaries and estimated results from caucuses, as of yesterday’s contests we have this delegate count:
Sorry Randall and Jim. I don’t think this year is going to be your year.
Anyway, 2776 delegates are needed to win the nomination on the Democratic side, and as of today, Obama exceeds that number.
This is of course no surprise to anybody. If anything, it is surprising 10 delegates went to someone else.
The chart’s of Obama’s walk to victory follow, but they aren’t as interesting as the equivalents on the Republican side this year.
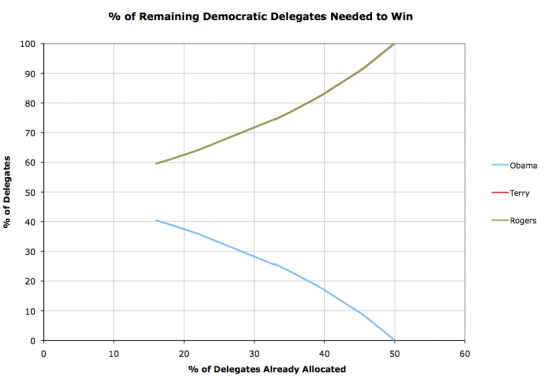
And two bonus charts I include for the Republicans on the 2012 Republican Delegate Count Graphs page but not on my blog updates…
Of course, nothing is actually official until the convention. But I think we have a Democratic nominee. :-)
Note added 16:28 UTC: To be absolutely strict, if you look at Green Paper’s “Hard Count” which only includes delegates officially bound to Obama, and not estimates from caucuses, and not officially uncommitted delegates who unofficially are identified Obama delegates, and not any of the super delegates, Obama only has 1940 delegates, so still has some ways to go. But I think including the superdelegates, estimates from caucuses, and officially uncommitted delegates known to support Obama is completely reasonable. So I’m willing to call this clinched. :-)
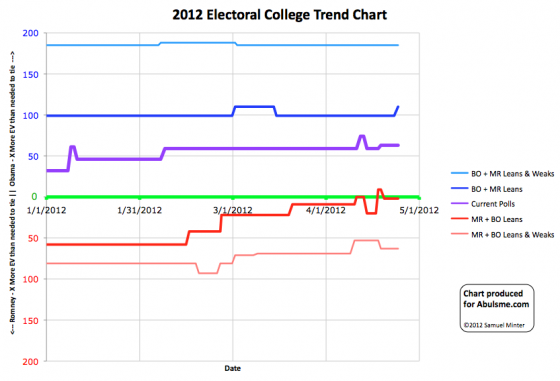
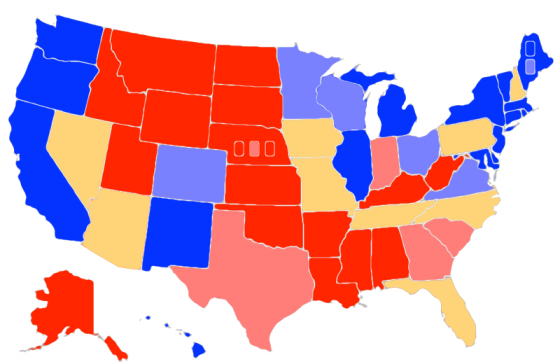
Chart and map from the Abulsme.com 2012 Electoral College Prediction page. Both assume Obama vs Romney with no strong third party candidate. Both show polling as it currently exists. Things will change before election day. Lines on the chart represent how many more electoral votes a candidate would have than is needed to tie under several different scenarios. Up is good for Obama, Down is good for Romney. On the map red is Romney, blue is Obama, gold states are too close to call.
Today Arizona moves from “Weak Romney” to “Lean Romney”, which makes it a swing state in our model.
Starting with this update, when a state changes status, I’ll also show the polling history for that state, so the trend is visible.
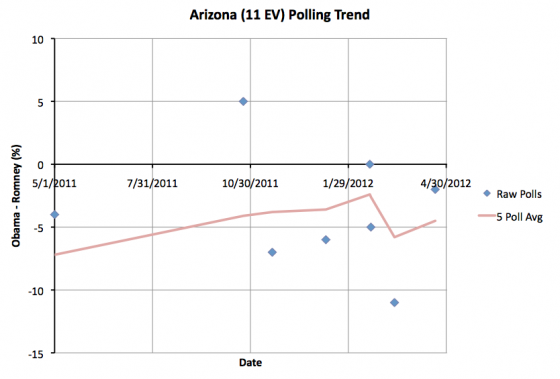
Looking at the above you can see that the last five polls goes back more than three months. You can see the spread within those five polls. Seeing this information visually can help interpret the movement being discussed. In this case, Arizona goes back into the swing state category after a relatively short period as a “Weak Romney” state (since March 16th). There are a couple data points that look like they might be outliers but which still affect the average. And of course you can see that the 5 poll average is just barely in the less than 5% swing state zone. The next poll could easily change the category again.
This change improves Obama’s “best case” where we give him all of the swing states.
|
Romney |
Obama |
| Romney Best Case |
271 |
267 |
| Current Status |
206 |
332 |
| Obama Best Case |
170 |
368 |
I’ll also note that movement in the national level polls toward Romney we talked about in previous updates seems to have been short lived. Looking at the RCP Poll Average Obama dropped from a lead of 5.3% on April 11th to a lead of only 1.7% on April 18th, but as of April 24th has rebounded to a lead of 3.7%. If the move toward Romney had been sustained, I would have expected to see a lot of state polls moving in Romney’s direction over the next few weeks. With the current trend that is no longer a safe assumption.
As things ebb and flow we will probably see movement toward Romney, but it won’t be the state polls catching up to the Romney spike of last week. It would be new changes based on new events.
But my general philosophy is that while the national polls are a leading indicator for the state polls and there is a strong correlation between the national popular vote and the electoral college, the real race is still the 50 separate state elections. That is how presidential elections work. So one gets a better picture of the dynamics by looking at the state numbers… although you need to be cognizant of the slower pace of state polling and interpret things accordingly. So we shall not speak of national level polls again.
Uh, unless there is something really interesting there to talk about. :-)
Edit 2012 May 2 13:08 UTC – Adjusted horizontal scale on Arizona graph
|
|


