|
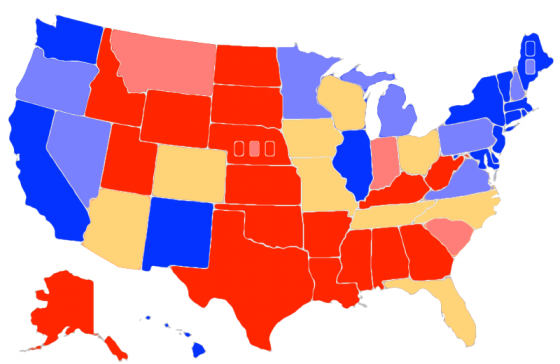
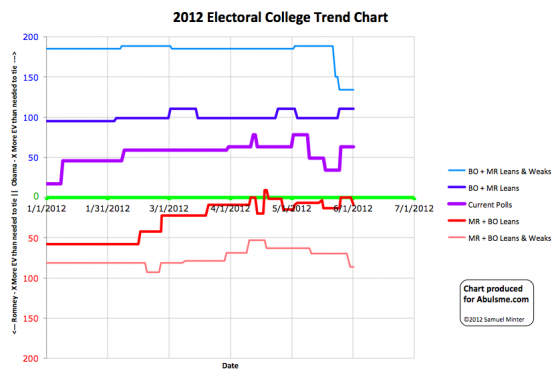
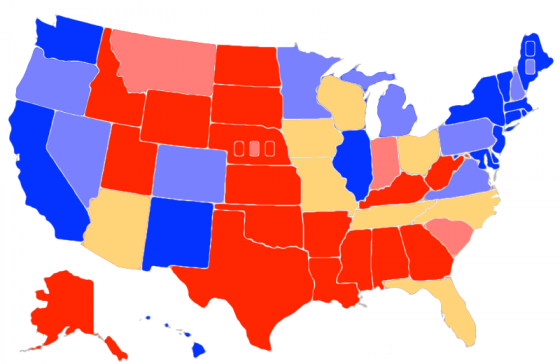
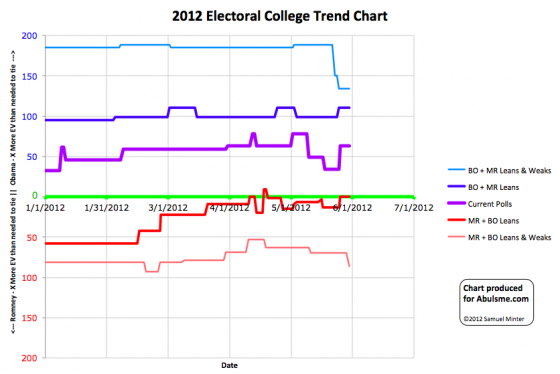
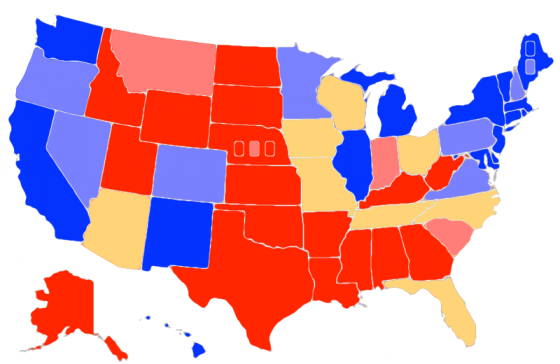
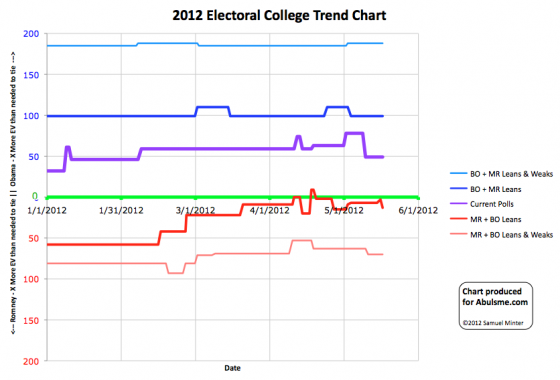
Chart and map from the Abulsme.com 2012 Electoral College Prediction page. Both assume Obama vs Romney with no strong third party candidate. Both show polling as it currently exists. Things will change before election day. On the map red is Romney, blue is Obama, gold states are too close to call. Lines on the chart represent how many more electoral votes a candidate would have than is needed to tie under several different scenarios. Up is good for Obama, Down is good for Romney. One state changes status today, and it is once again a move in Romney’s direction:
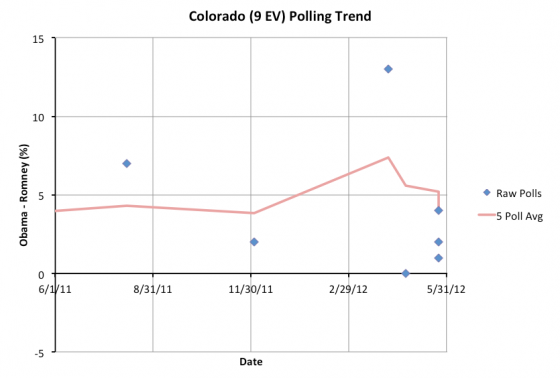
Colorado has been polled less frequently than one would expect. Since April 11th I have classified it as a “Weak Obama” state as the 5 poll average has been over 5%. It now looks clear that this was mostly on the strength of one PPP poll in April showing an Obama 13 point lead which now very much looks like an outlier. With the most recent polls, Obama’s lead falls back under 5%, so I move it back to “Lean Obama” again and it is now once again considered to be a state that could go either way. This improves Romney’s “best case”.
This move opens up some additional paths to victory for Romney. He can now afford to lose Iowa (6) if he wins the rest of the swing states. Or he can win Iowa (6) and lose Colorado (9) and still tie 269-269 and pull out a win in the House. But Florida (29), Ohio (18), North Carolina (15), Arizona (11), Tennessee (11), Missouri (10), and Wisconsin (10) are all still must win states. If Romney loses any one of them, he loses the election. And now, as I continue to go through data provided by Darryl at HorsesAss I have another correction to the old historical time series. In this case I was missing an old North Carolina poll from last September. This changed North Carolina’s status at the very beginning of the year from very slightly leaning Obama to very slightly leaning Romney. The old timeline had been:
Now it is simply:
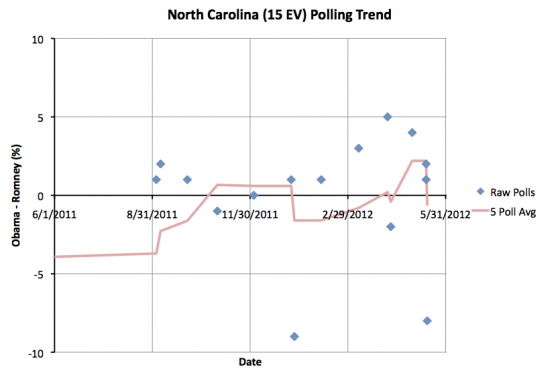
This only changes what the status should have been at the very beginning of the year. Current status remains the same. The historical chart is corrected starting with today’s update. It is important to note that regardless of the flips back and forth from leaning one way to leaning the other way, North Carolina has been in the “swing state” status the whole time… it is just plain too close to call and has been the whole time.
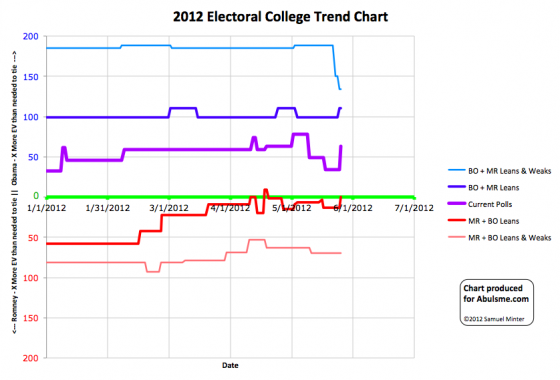
Chart and map from the Abulsme.com 2012 Electoral College Prediction page. Both assume Obama vs Romney with no strong third party candidate. Both show polling as it currently exists. Things will change before election day. On the map red is Romney, blue is Obama, gold states are too close to call. Lines on the chart represent how many more electoral votes a candidate would have than is needed to tie under several different scenarios. Up is good for Obama, Down is good for Romney. One state changes status today, and it is a move toward Romney:
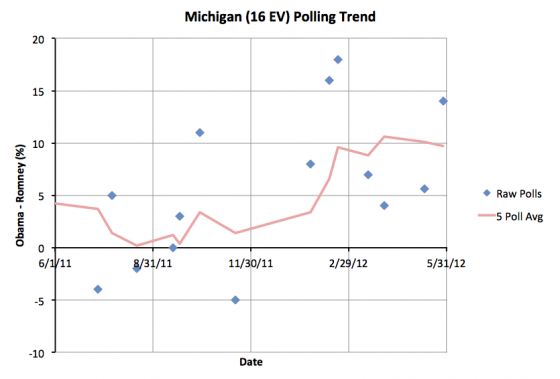
Michigan was in my “Strong Obama” category starting on April 10th. Today the five poll average drops to only a 9.7% lead for Obama, so the state drops to “Weak Obama”. As I’ve described this category many times before, this means that while Obama has a healthy lead, it is not so strong a lead that he can ignore the state. He has to play defense here, otherwise strong efforts from Romney (or big mistakes on his part) could make the state competitive again. As recently as February the five poll averages were such that Michigan was categorized as a swing state. It could go there again. Since this does not change the inventory of swing states, the summary remains the same:
In addition to the change in Michigan today, I have a correction to the historical timeline for New Hampshire. Based on data provided by Darryl from HorsesAss I found a typo in one New Hampshire poll from March, and a few older polls from 2011 that I had missed when booting up these charts in January. The end result is that New Hampshire’s timeline changes slightly. Prior to today I had this timeline:
With the corrections, the timeline should have been:
These changes only effect the historical timeline, the current position remains the same. The chart showing the race over time has been updated with this correction starting with today’s update.
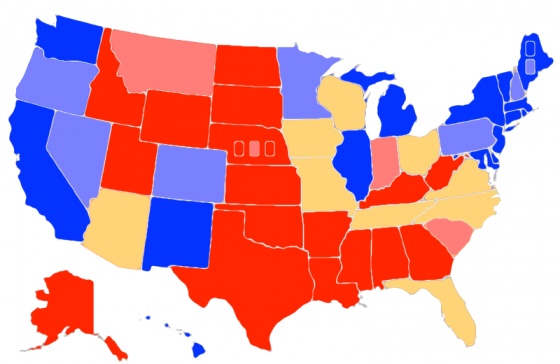
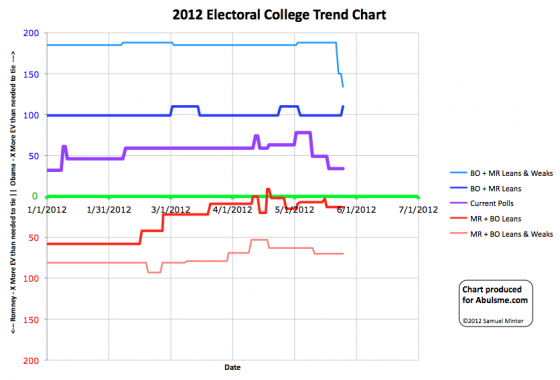
Chart and map from the Abulsme.com 2012 Electoral College Prediction page. Both assume Obama vs Romney with no strong third party candidate. Both show polling as it currently exists. Things will change before election day. On the map red is Romney, blue is Obama, gold states are too close to call. Lines on the chart represent how many more electoral votes a candidate would have than is needed to tie under several different scenarios. Up is good for Obama, Down is good for Romney. Two states changing status today, both moving toward Obama:
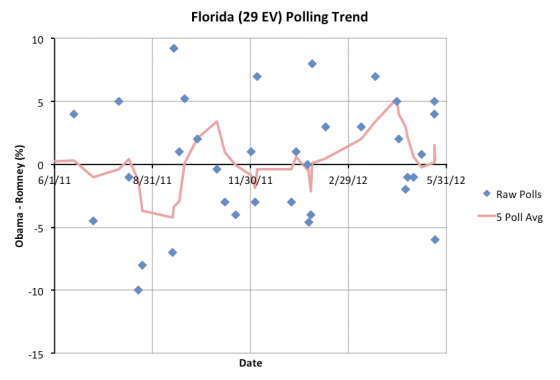
First up Florida (29). Bottom line is Florida is too close to call. It has been too close to call for almost all of the last year. (The exception was two whole days in April where Obama’s lead in the five poll average went over 5%.) The rest of the time, one of the swingiest of swing states. Most recently, from May 10th until today, Romney was every so slightly ahead in the five poll average. Now Obama is ever so slightly ahead (0.3% actually). The next poll could move it back over the line to Romney. Bottom line, don’t put too much weight on what side of the line the too close to call states are on at any given moment. There is a reason I color them all the same on the map.
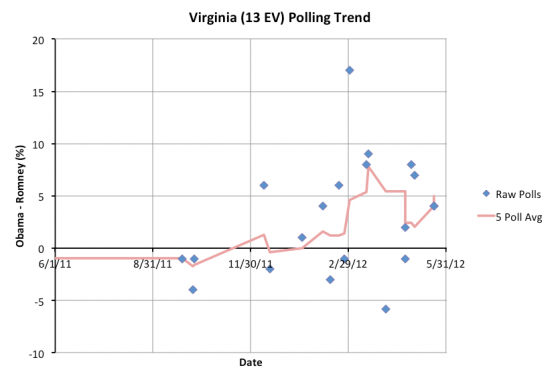
Next we have Virginia (13). Obama’s lead in the five poll average gets up to 5.0% which means by my classification it is no longer a swing state, but now gets listed as a “Weak Obama” state. Generally speaking that means he has a healthy lead at the moment, but not so big a lead as would allow him to take the state for granted and ignore it. Virginia no longer being a swing state takes the possibility of winning it out of Romney’s best case in the summary, which leaves us in a fun place…
Yes, we are once again in a situation where even if Romney won all the states he is ahead in, plus all the states Obama is ahead in by less than 5%, the result would be a TIE in the electoral college, which would throw the election to the House. In such a scenario, given the makeup of the House, Romney would almost certainly win. It is a fun scenario to think about. It is however an unlikely scenario. My model doesn’t produce odds, but Darryl’s at HorsesAss does, and in his latest analysis he has the odds of a 269/269 tie at just about 0.05%. So about 1 in 2000. So pretty long odds. Which is a shame, because that would be really fun to watch. It hasn’t happened since 1824, isn’t it about time? More to the point though, Romney is back to the very weak position he had in mid-April, and it seems that a lot of the gains he had been making in May have evaporated. For now anyway.
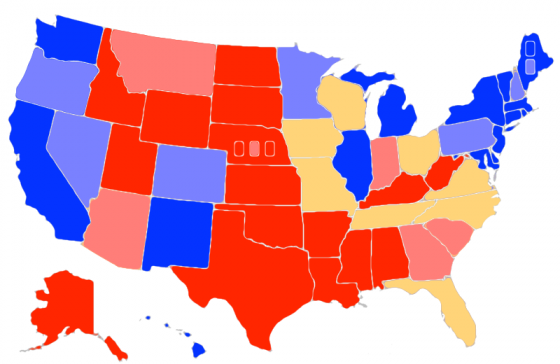
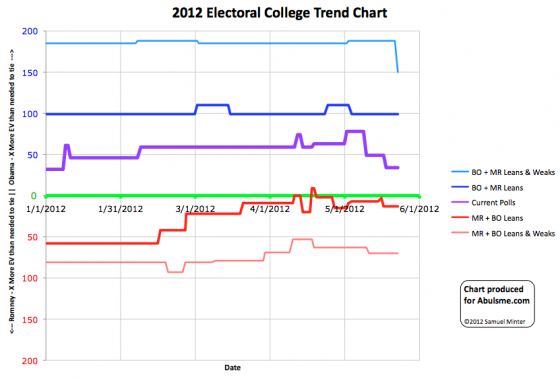
Chart and map from the Abulsme.com 2012 Electoral College Prediction page. Both assume Obama vs Romney with no strong third party candidate. Both show polling as it currently exists. Things will change before election day. On the map red is Romney, blue is Obama, gold states are too close to call. Lines on the chart represent how many more electoral votes a candidate would have than is needed to tie under several different scenarios. Up is good for Obama, Down is good for Romney. Two states change status today. One moving toward Romney, one moving toward Obama:
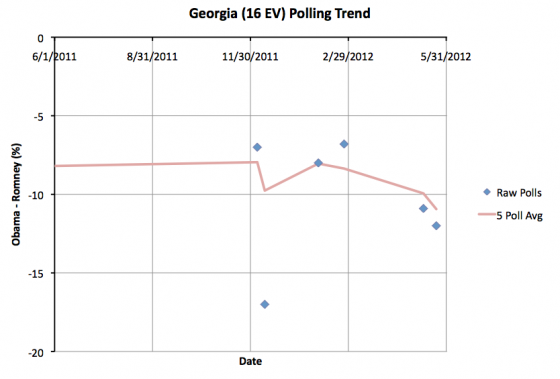
First up, Georgia with its 16 electoral votes. Like Texas a couple days ago, Georgia is one of those states that nobody thinks will be a swing state, but some polling was showing it closer than one might expect, leading one to think that Romney might have wanted to spend at least a little time and money on shoring it up. The latest polls though have Romney’s lead there in my five poll average going over 10%. This moves it into the “Strong Romney” category which generally are quite safe for Romney and therefore can effectively be ignored in the campaign. These moves from Weak to Strong don’t change the range of outcomes in my model, but they do show Romney’s consolidation of his base states.
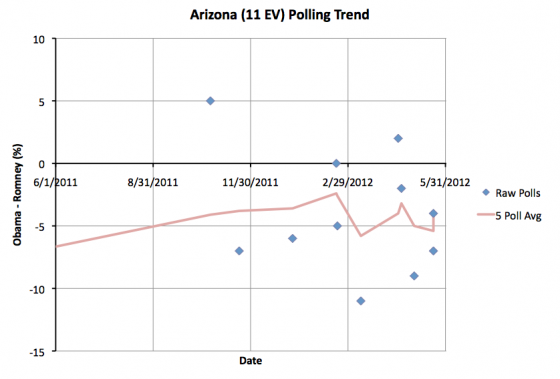
Second we have Arizona. This has been bouncing back and forth, over and under the Romney 5% lead line in the five poll average. With today’s update, the 5 poll average drops below 5% again, so we once again classify it as a Lean Romney Swing State. Now, the five poll average in Arizona has never shown Obama actually ahead in Arizona (although a couple individual polls in the last year have), so Arizona is not as swingy as, say, Florida or North Carolina, where the actual lead keeps changing hands. But it is close enough that the lead could be wiped out in a few days depending on the news cycle. So, for the moment, Arizona swings again. In terms of our summary, since Georgia was never considered a real Obama possibility, only Arizona causes a change, improving Obama’s best case by 11 electoral votes:
Note 2012 Jun 8 15:00 UTC: A correction noted June 8th moved a Tennessee change from “Weak Romney” to “Lean Romney” from March 2nd to May 24th, which would have been the day before this post. Updates between March 2nd and this post therefore incorrectly classified Tennessee.
Chart and map from the Abulsme.com 2012 Electoral College Prediction page. Both assume Obama vs Romney with no strong third party candidate. Both show polling as it currently exists. Things will change before election day. On the map red is Romney, blue is Obama, gold states are too close to call. Lines on the chart represent how many more electoral votes a candidate would have than is needed to tie under several different scenarios. Up is good for Obama, Down is good for Romney. One state changes status today, and once again it is a move in Romney’s direction.
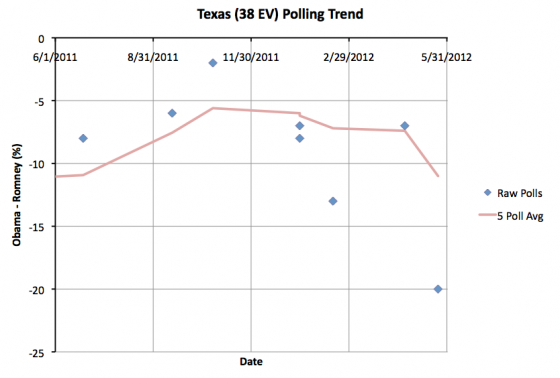
Texas, which was never a swing state by any means, but which for awhile looked like it might be a state where Romney would at least need to watch his back and play a little defense just to be sure it didn’t surprise anyone by starting to get competitive, is now moving back into the “Strong Romney” camp as Romney’s lead in the five poll average jumps to 11%. This is a surprise to precisely no one. :-) Since Texas was never a swing state, this does not change the summary.
The general trend in Romney’s direction which I mentioned last time continues. But to make a big positive difference in his situation, Romney needs to be pulling current “Weak Obama” states into the swing state category. Strengthening his lead in states he is already nicely ahead in may feel good, but it doesn’t have an impact on the election. Unfortunately, I also have a correction to make regarding some older Wisconsin data. Thanks to a tip from Darryl at HorsesAss I found that I had mistakenly included a Washington State poll from February in the Wisconsin data (as well as in the Washington State data). The end result of this is that prior to today on the chart showing the history of the race so far, Wisconsin had been classified as a “Strong Obama” state from March 2nd to April 19th. With the erroneous poll backed out, Wisconsin should only have been “Strong Obama” from March 30th to April 19th. Starting with the chart in today’s post, the light red line indicating the number of excess electoral votes Romney would have if he won all swing states plus all of Obama’s weak states has been corrected to reflect this. Notes have also been placed in the March 2nd and March 30th updates to point out this correction. In either case, since May 17th I have classified Wisconsin as a “Lean Obama” swing state. Sorry for the error. It happens every once in awhile. :-)
Chart and map from the Abulsme.com 2012 Electoral College Prediction page. Both assume Obama vs Romney with no strong third party candidate. Both show polling as it currently exists. Things will change before election day. On the map red is Romney, blue is Obama, gold states are too close to call. Lines on the chart represent how many more electoral votes a candidate would have than is needed to tie under several different scenarios. Up is good for Obama, Down is good for Romney. One state changes status today:
North Carolina moves from Obama up by 2.0% to Romney up by 0.6%. Either way, this is too close to call. North Carolina remains a swing state. Now, the latest poll actually has Romney ahead by 8%. This might be the start of a larger move toward Romney. Or maybe it is an outlier. It is too early to tell. For now, North Carolina is now a swing state that leans ever so slightly to Romney. Since North Carolina remains too close to call, this doesn’t change either candidate’s best case scenarios, which represent the range of reasonably possible results based on current state polling. The current line drops a nice ways in Romney’s direction though.
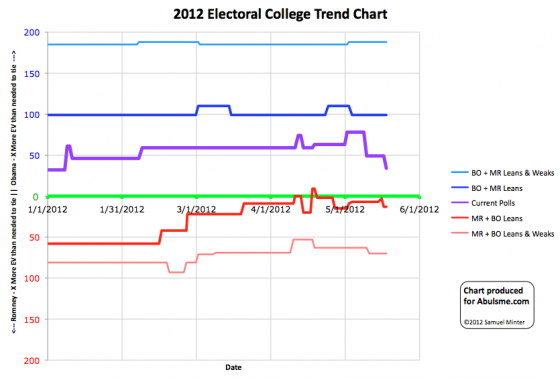
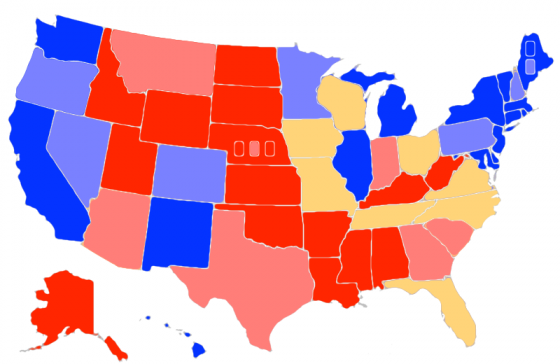
Glancing at the chart, it looks like there has been a nice move in Romney’s direction lately. Lets look at some specific numbers and compare to one month ago. One month ago was the first time that the state polls showed Romney’s best case being to lose. Things clearly look much better for him today. On April 18th, Romney’s best case showed him losing 260 to 278. Now he wins 276 to 262. He has moved 16 electoral votes (net) back into contention that a month ago seemed out of reach. On the current line, a month ago Obama was winning 328 to 210. Now he is only winning by 303 to 235. Over the last month Romney has pulled a full 25 electoral votes (net) over the line toward him. As for Obama’s best case… no change. The needle hasn’t moved at all. Obama hasn’t managed to pull more electoral votes into being competitive, nor have any moved out of reach. So the movement has definitely been in Romney’s direction. If he keeps it up, we’ll start to see the map looking much more competitive soon. By comparison, look at 4 years ago… the two best cases were much more symmetric around the tie line. The candidates were more evenly matched and the range of possibilities was not really favoring either candidate. It was clearly a wide open race four years ago. Having a lot more swing states helped. The “current” status looked very similar to today’s though… we had McCain 302, Obama 236. Reverse the parties, and we are almost exactly in the same place we are today. Of course McCain did not go on to win. One should look at Obama’s current lead in the model with that in mind. There is still a long time until November. Edit 2012 May 20 06:39 UTC – Fixed Map, SC was incorrectly colored as a swing state, it is now correctly colored as “Weak Romney”.
Chart and map from the Abulsme.com 2012 Electoral College Prediction page. Both assume Obama vs Romney with no strong third party candidate. Both show polling as it currently exists. Things will change before election day. On the map red is Romney, blue is Obama, gold states are too close to call. Lines on the chart represent how many more electoral votes a candidate would have than is needed to tie under several different scenarios. Up is good for Obama, Down is good for Romney. One state changes status today, and it is a move in Romney’s direction:
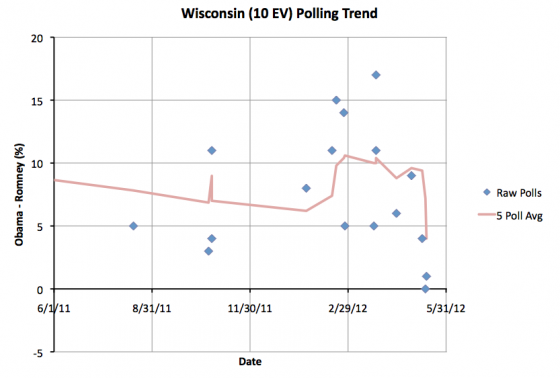
It seems like it was just yesterday when I was saying that if Romney pulled Wisconsin back toward being competitive it would open up more paths for victory to him. And boom, today Obama’s lead in the five poll average in Wisconsin drops from 7.2% down to 4.0%. Looking at the history here, this is a veritable collapse for Obama in Wisconsin. Up through mid-April I’d classified Wisconsin as “Strong Obama” because his leads there were over 10%. There was even one poll showing him up by 17%! On April 19th the lead dropped to below 10% and I reclassified Wisconsin as “Weak Obama”. But the trend in May has been decidedly and dramatically toward Romney. The two most recent polls show a tie and a 1% Obama lead. There haven’t yet been any Wisconsin polls showing Romney actually ahead, but the margin is now clearly small enough that Wisconsin could easily go either way. So we add Wisconsin into Romney’s best case scenario:
This makes Romney’s path to victory much more flexible. Florida (29), Ohio (18) and North Carolina (15) are still “must win”. If any one of those went to Obama, Romney would be done. If he lost Virginia (13) we’d have a 269-269 tie, which would probably result in a messy Romney victory in the House of Representatives. But with the new set of swing states, he could afford to lose any one of Tennessee (11), Missouri (10), Wisconsin (10), or Iowa (6) and still win. This move in Wisconsin is by far the most dramatic move we’ve seen toward Romney yet in the state polls. As more polls come in for other states, the question will be if this move in Wisconsin is the first sign of more general moves toward Romney in many states, or if there is something Wisconsin specific going on here… perhaps spillover from the Walker recall battle or some such. A state moving all the way from “Strong” support of a candidate to being a swing state in less than a month though is a pretty dramatic move. If Romney can produce that kind of motion in a few more states, this analysis will very quickly start showing a much more competitive race! Edit 2012 May 20 06:38 UTC – Fixed Map, SC was incorrectly colored as a swing state, it is now correctly colored as “Weak Romney”. |
||||||||||||||||||||||||||||||||||||||||||||||||||||||||||||||||||||||||||||||||||||||

