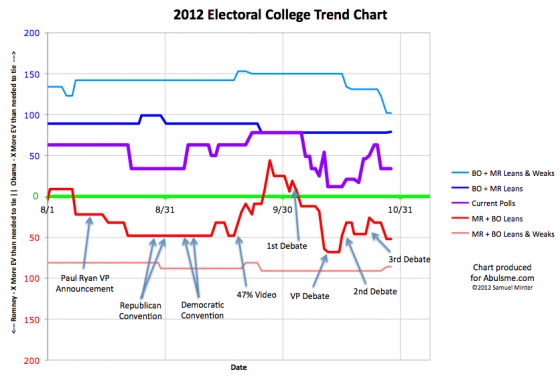
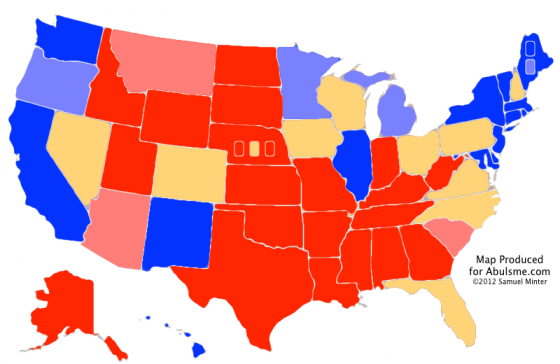
One change today, and as the headline implied, it is Nebraska’s 2nd congressional district. Nebraska is one of two states (the other is Maine) that does not award electoral votes with a winner take all formula. Instead, you get two electoral votes for winning the state as a whole, and then one electoral vote for winning each congressional district. In 2008, McCain won the state, but Obama got one electoral vote for winning Nebraska’s 2nd district, which is the district containing the city of Omaha. Nebraska as a whole, and Nebraska’s 1st and 3rd congressional districts are all very safely Romney. But the 2nd?
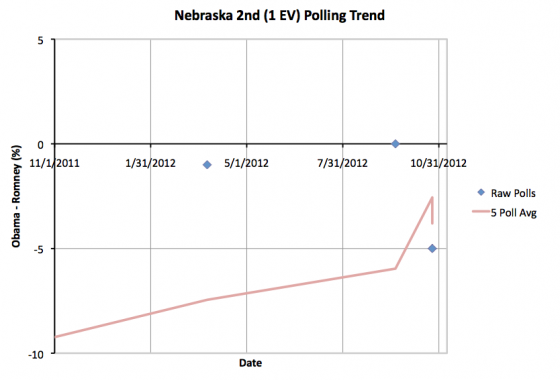
Polling in Nebraska’s 2nd has been extremely sparse. I have only five data points in my spreadsheet since the 2008 election… and that is only because I include both values when a poll includes results for both registered and likely voters. (Yeah, yeah, that is probably methodologically unsound, I’ll reconsider in 2016.) So really, only 4 polls since 2008. And only three of them were in the last 12 months. So we don’t have a great picture. But lets look at what we do have:
I’m showing the whole last year rather than just the last three months due to the paucity of polling.
Until today, the five poll average still included the “seeds” from the 2004 and 2008 elections. In 2004 Kerry lost Nebraska to Bush by a full 22%, so that significantly depressed the average. If you did my five poll average only counting the results of the new poll for likely voters, the average would now be a Romney lead of 2.6%. Using my normal rules for the five poll average, you get a 3.8% Romney lead. There are other ways you could compute an average for NE-2 depending on how you want to weight current polls vs older polls, etc. But given that the polls we have seen this year show a 1% Romney lead (in March), a tie (in September), and a 5% lead (now, looking at either Registered or Likely voters) it seems fair to lump NE-2 in with the states where Romney is ahead, but by less than 5%.
So Romney is ahead in NE-2, but it is close. With my five poll average officially at a 3.8% Romney lead, that does mean though that while close, Florida and North Carolina are both considerably closer. Any situation that includes NE-2 going for Obama is likely to actually be an Obama blowout. Well, with how sparse the polling is, maybe it really isn’t fair to say that. There just isn’t enough data to really place NE-2 well on the spectrum. We have only the vaguest idea what is really going on there. So absent more polls here in the final days, we’ll list NE-2 as the “most likely surprise” in this election. It represents the “closest” electoral vote that hasn’t been polled heavily this year.
Anyway, this gives us a slightly different map and summary:
| Romney | Obama | |
|---|---|---|
| Romney Best Case | 321 | 217 |
| Current Status | 235 | 303 |
| Obama Best Case | 190 | 348 |
So Obama’s best case improves by 1 electoral vote to a 348 to 190 win. That is a nice win, although still substantially short of his 365 to 173 in 2008.
Obama’s best case IS possible, just like Romney’s best case is. It seems like either of those though would require something actually happening in the remaining days of the campaign to move things in that direction, rather than just a continuation of normal campaigning.
Maybe Hurricane Sandy? Dunno. We’ll see.
Anyway, looking at the close areas again, just to see where we are:
- Nebraska 2nd (1): 3.8% Romney lead
- North Carolina (15): 2.4% Romney lead
- Florida (29): 0.8% Romney lead
- Virginia (13): 0.4% Obama lead
- New Hampshire (4): 1.0% Obama lead
- Iowa (6): 1.2% Obama lead
- Ohio (18): 2.0% Obama lead
- Colorado (9): 2.8% Obama lead
- Nevada (6): 2.8% Obama lead
- Wisconsin (10): 3.8% Obama lead
- Pennsylvania (20): 4.6% Obama lead
Romney gains a little bit in Ohio, so that state once again is the “tipping point state”. So the percentage Romney has to move every state in order to win is down to 2.0% (from 2.8% yesterday).
I mentioned yesterday that I might produce a “spiffy graph” showing the trend in this number… specifically the margin in the tipping point state over time… which can otherwise be thought of as the amount of “uniform movement” across all the close states that would have to happen to flip the winner. Well… I’ve been working on it… it requires pulling some historical data I didn’t explicitly keep track of at the time… but it isn’t quite done yet, and I am rapidly approaching the 00:00 UTC deadline I give myself for the daily updates. So maybe I’ll have that in the NEXT update. Sorry about that kids.
In the mean time, suffice it to say that the state of the race remains that Obama has a small but consistent lead in the critical states. If nothing changes, he will most likely win. But Romney remains within striking distance if something happens to move things his direction, or to a degree just if he has a really lucky day with turnout factors on election day.
But it is still looking like an Obama win in the electoral college.
(With the possibility of a split between that and the popular vote seemingly growing daily.)
Note: Chart and map from the Abulsme.com 2012 Electoral College Prediction page. Both assume Obama vs Romney with no strong third party candidate and show polling as it currently exists. Things will change before election day. On the map red is Romney, blue is Obama, gold states are too close to call. Lines on the chart represent how many more electoral votes a candidate would have than is needed to tie under several different scenarios. Up is good for Obama, Down is good for Romney.


