This is the website of Abulsme Noibatno Itramne (also known as Sam Minter).
Posts here are rare these days. For current stuff, follow me on Mastodon
|
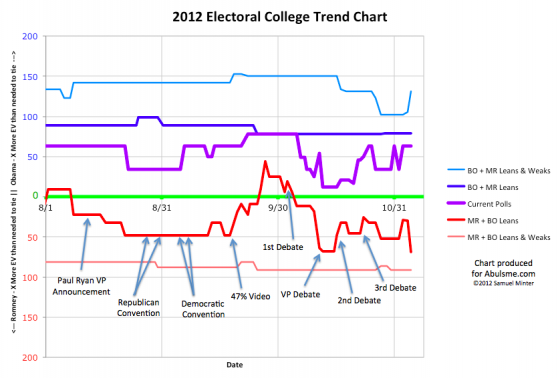
As election day approaches, the number of polls coming in each day has increased dramatically, and that means some states will be jiggling just from the higher volume of polling, although some of it may represent actual movement too.
Today according to the five poll average, five states change categories today, and they all move toward the center, toward being more competitive. But when we look at them, it turns out none of these (with one possible exception) look like they will be in a position to make any difference in this race. Let’s take a look at each of them anyway:
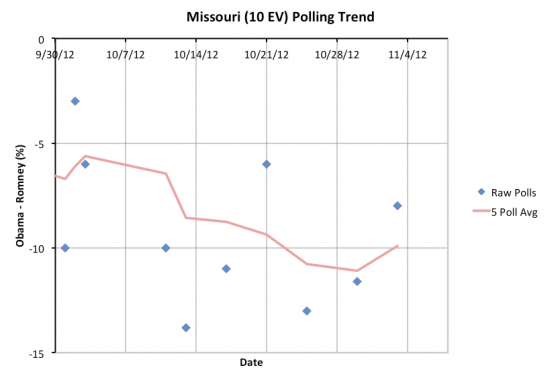
Missouri had been trending further toward Romney, but the last poll looks like Obama may be gaining a bit of support there. It doesn’t matter though, Romney is going to win Missouri.
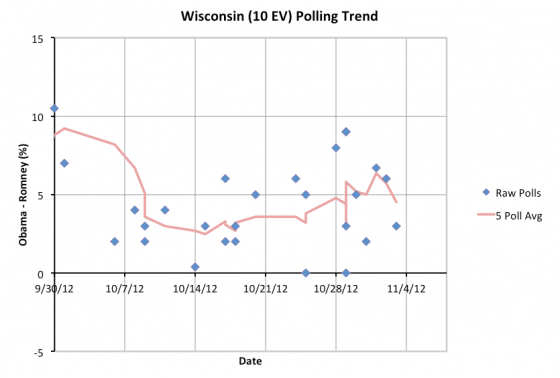
Wisconsin had bounced up to over a 5% Obama lead. It now falls below that level to a 4.5% Obama lead. This is close enough that I once again classify Wisconsin as “Lean Obama” and therefore a state that Romney could win. But of all the close states, this is the one with the second largest Obama lead. There are many closer states that are better Romney targets as he tries to claw his way to 270.
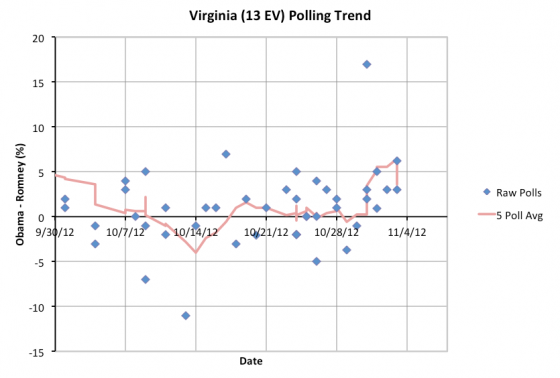
Ever since Thursday I have been mentioning the big ugly outlier in Virginia. Well, today it finally rolls off the five poll average. With this the average drops to a 3.6% Obama lead. Virginia would never have left the “close state” category without the outlier, but even without the outlier, Obama has been making gains in Virginia. A week ago all the polling indicated a tied race in Virginia. No longer. It is still close, but now Obama has a clear lead.
Of the states changing status today, Virginia is currently the closest, and it is also the only one with a history of actually being very close. At the moment, Virginia isn’t close enough compared to the other close states to actually be part of Romney’s “easiest path to victory” which I’ll cover later in the post, but given the history of polling in the state, it could easily get closer again before we are done, so it still has a chance of making a difference in the race if Romney can win it.
This state is “getting closer” only because the outlier is rolling off the average though. Without the outlier, the trend is actually toward Obama in Virginia. Virginia seems to be slipping away from Romney.
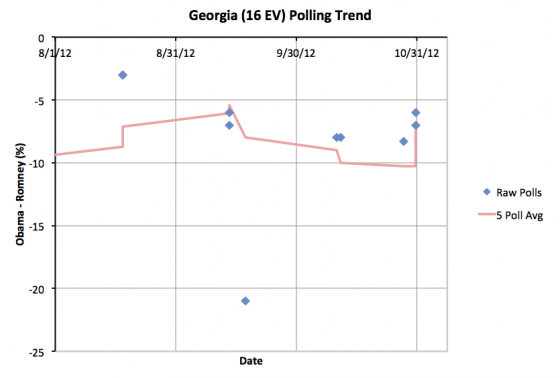
I am showing a chart since August to show a bit more context for Georgia. The five poll average moved to a greater than 10% lead for Romney due to what is a clear outlier in September. Polling has been sparse in Georgia, because it hasn’t been in contention this cycle, so that outlier only rolled off the average today. I now have Romney with a 7.5% lead in Georgia.
So this “gain” for Obama doesn’t matter. Romney will be winning in Georgia.
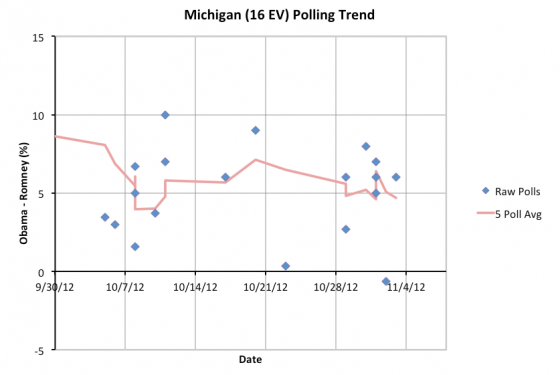
Michigan has been hovering right around the 5% Obama lead mark for the last month or so. Usually Obama’s lead is slightly more, with today’s update it is slightly less… 4.7%. This is due to one recent poll that actually shows Romney ahead in Michigan! This is out of line with all other recent polling, but as usual, I do not manually remove outliers, I let the averages do their thing. (Although I keep thinking that maybe in 2016 I should use a median, which is less sensitive to these things.)
Anyway, at 4.7%, Michigan has the biggest Obama lead of any of the current crop of “close states”. Like Wisconsin, this means that there are a lot of other states that would be easier for Romney to take the lead in that Michigan. If Romney actually pulls ahead in Michigan, this means it is very likely that he has already pulled ahead in all of the other close states… at which point he would not only have won, but be heading for a pretty comfortable victory.
So while it might be a bit closer than it was (maybe), Michigan is still quite unlikely to end up flipping to Romney, or to be one of the critical states in the last days.
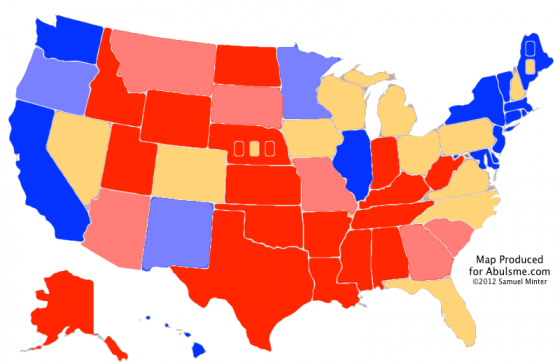
This brings us to the new map and summary:
|
Romney |
Obama |
| Romney Best Case |
338 |
200 |
| Current Status |
206 |
332 |
| Obama Best Case |
190 |
348 |
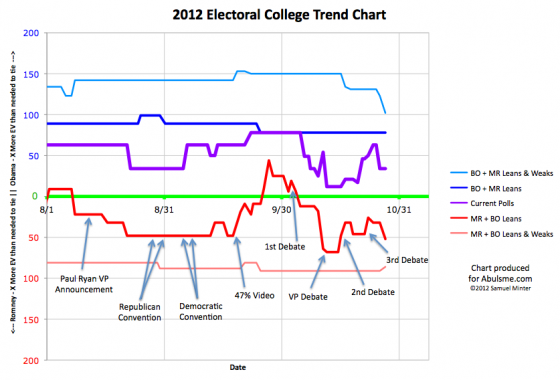
Romney’s best case now actually is the best it has been ALL YEAR LONG, exceeding his best case at the peak after the 1st presidential debate. In a sense, this does represent a Romney comeback in the last few days. He *is* making a bunch of states closer. He has taken a bunch of states where Obama had been ahead by more than 5%, and pulled them back so they are somewhat close. This may help him in the popular vote, but in the electoral college, it doesn’t look like he has moved any of these states ENOUGH. He may be making states closer, but he is NOT pulling them over the line to him.
Meanwhile, while Obama hasn’t been pulling ahead by more than 5% in more states, and he hasn’t managed to pull any more states to his side either, he actually has been increasing his lead in some of the most critical states.
Time to take a look in more detail by comparing the five poll average now to the five poll average 7 days ago:
- Nebraska 2nd (1): 3.8% Romney lead a week ago, 3.8% Romney lead now (no change)
- North Carolina (15): 2.4% Romney lead a week ago, 2.4% Romney lead now (no change)
- Colorado (9): 2.8% Obama lead a week ago, 0.4% Obama lead now (2.4% move toward Romney)
- Florida (29): 0.8% Romney lead a week ago, 1.1% Obama lead now (0.3% move toward Obama)
- New Hampshire (4): 1.0% Obama lead a week ago, 2.6% Obama lead now (1.6% move toward Obama)
- Ohio (18): 2.0% Obama lead a week ago, 3.4% Obama lead now (1.4% move toward Obama)
- Iowa (6): 1.2% Obama lead a week ago, 3.4% Obama lead now (1.2% move toward Obama)
- Virginia (13): 0.4% Obama lead a week ago, 3.6% Obama lead now (3.4% move toward Obama)
- Pennsylvania (20): 4.6% Obama lead a week ago, 3.8% Obama lead now (0.8% move toward Romney)
- Maine 2nd (1): 6.1% Obama lead a week ago, 4.2% Obama lead now (1.9% move toward Romney)
- Nevada (6): 2.8% Obama lead a week ago, 4.2% Obama lead now (1.4% move toward Obama)
- Wisconsin (10): 3.8% Obama lead a week ago, 4.5% Obama lead now (0.7% move toward Obama)
- Michigan (16): 6.5% Obama lead a week ago, 4.7% Obama lead now (1.8% move toward Romney)
That is a lot of close states! But what can be seen here? Out of 13 close areas, only FOUR moved toward Romney in the last week. Colorado, Pennsylvania, Maine’s 2nd congressional district, and Michigan. Of these only Colorado is in Romney’s easiest path to victory. I listed the states above in order by the level of Romney support from highest to lowest.
That means the states he NEEDS to be improving in the most in order to win are Colorado, Florida, New Hampshire, Ohio and Iowa. Looks like Colorado is almost tied now, so I guess whatever Romney is doing there is working and is time well spent. But the rest of these critical states are moving the wrong direction for Romney.
There has been speculation that Romney is trying to do a “hail mary” of some sort, trying to actually win Pennsylvania and Michigan as an alternate path to victory. The states he is ahead in, plus Florida, Colorado, Pennsylvania and then Michigan is certainly another path to victory. But given Obama’s current leads in those states, going through New Hampshire, Ohio and Iowa certainly seems like an easier path than Pennsylvania and Michigan. Perhaps Romney’s internal polling shows Obama’s support is “softer” in these states though.
For the most part though, this looks like effort put into the wrong places, while Obama consolidates his leads in the states more likely to be the tipping point. And that is the cue for today’s tipping point graph:
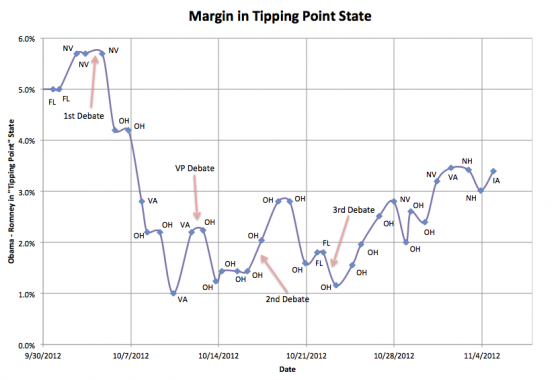
The Virginia outlier is gone, so now the chart can be interpreted directly. (I’ve removed the little x’s showing what things would have looked like if I had manually removed the outlier.) Iowa is now the tipping point state, and Obama is ahead by 3.4% in Iowa. There was a dip in the past few days (which was slightly more without the Virginia outlier) but Obama’s popped up again. If Romney manages to move the polls in all the close states by at least 3.4%, he can win. But that is a tall order at this point. A very tall order.
As I type there are 48 hours and a few minutes left until the first polls start closing on election night. 3.4% is a huge move in such a short time. Something incredibly dramatic would have to happen to move opinion that much in the final moments.
Romney’s only real hope at this point is that all the polls are wrong.
Absent that, Obama wins a second term.
Note: Chart and map from the Abulsme.com 2012 Electoral College Prediction page. Both assume Obama vs Romney with no strong third party candidate and show polling as it currently exists. Things will change before election day. On the map red is Romney, blue is Obama, gold states are too close to call. Lines on the chart represent how many more electoral votes a candidate would have than is needed to tie under several different scenarios. Up is good for Obama, Down is good for Romney.
Four states change status today, three moving toward Romney, one moving toward Obama. On the surface this looks very good for Romney. We’ll look into why that might not be the case in a bit, but first lets look at the four states that move today:
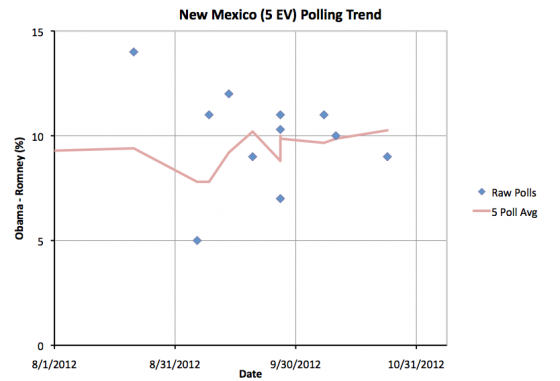
Very little to say about New Mexico. Obama’s lead increases slightly and is now over 10%. Obama will win New Mexico.
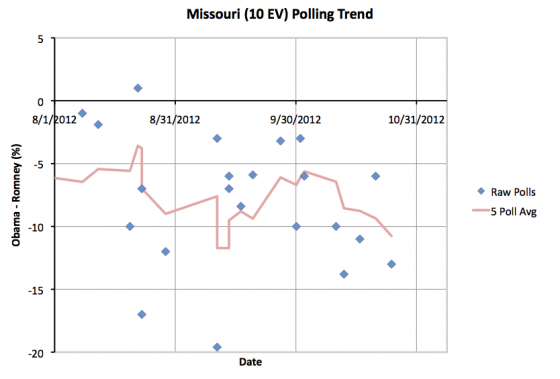
Not much to see in Missouri either. Romney’s lead increases slightly and is now over 10%. Romney will win Missouri.
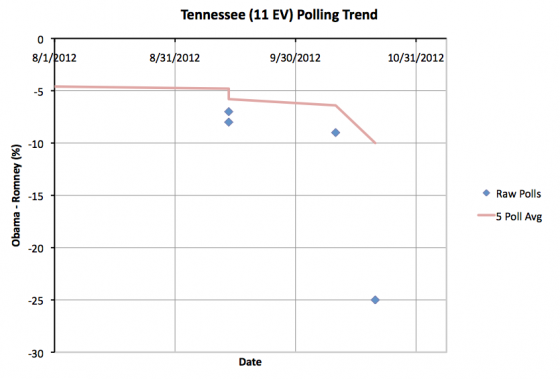
Tennessee is a bit odder. The new poll showing a 25% Romney lead in Tennessee looks like an outlier. No other poll in the state from the last year shows a Romney lead greater than 9%. Without this poll the five poll average has a Romney lead of 6.4%. With this, the Romney lead jumps to 10.0%, which moves Tennessee to the “Strong Romney” category. This may not be deserved, but I don’t make judgements about outliers, I just let the average sort it out. Either way, Tennessee’s not in contention this year. Romney will win Tennessee.
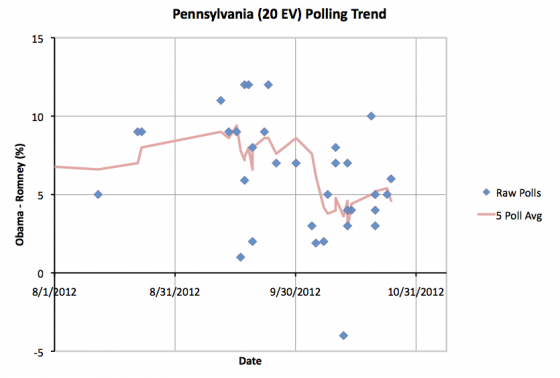
Pennsylvania shows Obama’s lead dropping under 5% again as an outlier showing Obama leading by 10% drops off. Again, we just let the average deal with outliers here, and that is what has happened. Pennsylvania returns to “Lean Obama” which probably better represents the true state of the race in Pennsylvania at the moment. Having said that, it is at the high end, Obama’s lead in the five poll average is now 4.6%. This is a pretty substantial lead. Any scenario that has Romney winning Pennsylvania would already have him wining the presidency handily.
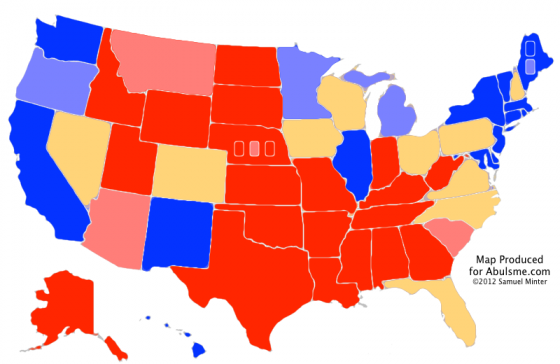
OK, so this gives us this new map and summary:
|
Romney |
Obama |
| Romney Best Case |
321 |
217 |
| Current Status |
235 |
303 |
| Obama Best Case |
191 |
347 |
As before though, since depending which way the close states go you could have either candidate winning, we need to look at the individual states:
- North Carolina (15 ev): 2.4% Romney lead – 4/5 polls after last debate
- Florida (29 ev): 0.8% Romney lead – 5/5 polls after last debate
- Virginia (13 ev): TIE – 5/5 polls after last debate
- Iowa (6 ev): 1.2% Obama lead – 2/5 polls after last debate
- New Hampshire (4 ev): 2.2% Obama lead – 2/5 polls after last debate
- Colorado (9 ev): 2.8% Obama lead – 5/5 polls after last debate
- Nevada (6 ev): 2.8% Obama lead – 5/5 polls after last debate
- Ohio (18 ev): 3.1% Obama lead – 5/5 polls after last debate
- Wisconsin (10 ev): 3.8% Obama lead – 3/5 polls after last debate
- Pennsylvania (20 ev): 4.6% Obama lead – 2/5 polls after last debate
Something interesting here, but I am running out of time to go into detail. Ohio is no longer the tipping point state! If you start adding these states up in order of how far away they are from Romney, you see that Romney’s clearest path to victory is now holding North Carolina and Florida, then pulling ahead and winning Virginia, Iowa, New Hampshire, Colorado and Nevada. If he does that, he wins 273 to 265.
So as of today, if he moves every state more than 2.8% toward him, Romney wins. But yesterday that percentage was 2.5%. Wednesday it was 1.6%. Tuesday it was 1.2%
I may make a spiffy graph of this with the next update, but for now just looking at those numbers, you can see that despite moving some states closer to him, Romney’s path to victory is slipping away. The states he needs to pull ahead in are instead slowly pulling away.
Note: Chart and map from the Abulsme.com 2012 Electoral College Prediction page. Both assume Obama vs Romney with no strong third party candidate and show polling as it currently exists. Things will change before election day. On the map red is Romney, blue is Obama, gold states are too close to call. Lines on the chart represent how many more electoral votes a candidate would have than is needed to tie under several different scenarios. Up is good for Obama, Down is good for Romney.
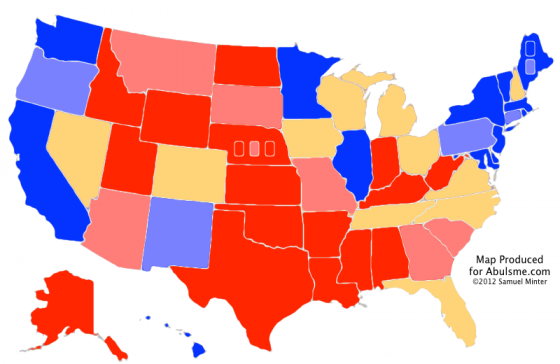
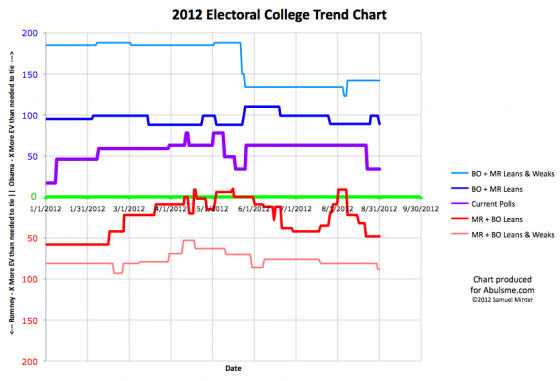
One update today, and it is Missouri reversing the move it made on the 25th:
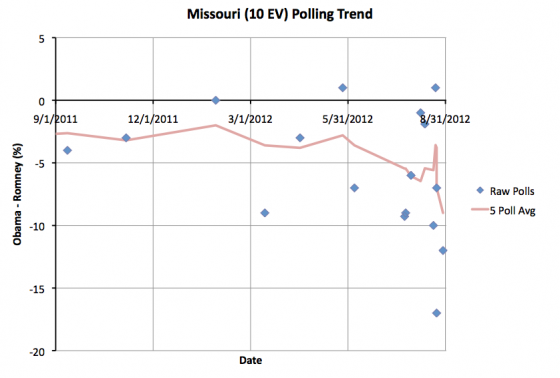
As you can see, polling in Missouri lately has been a bit, uh, wild. The last five polls, which only go back about a week and a half, have ranged from an Obama lead of 1%, to a Romney lead of 17%. That is just all over the place. I’m not sure that public opinion is really swinging quite so much so fast and there is something odd with the polls instead, but we have what we have. Before the two new polls I added today, the five poll average had a Romney lead of 3.8%. The two new polls were very good for Romney and we are now up to a Romney lead of a full 9%!
This is a very quick moment in Romney’s direction. I guess if there was indeed any movement away from the Democrats due to Akin, the backlash is now in full effect. Most of the last year Romney has been ahead in Missouri, but not by much. If the trend of the last few polls holds up, it looks like Obama’s support in Missouri pretty much collapsed and the state may even be heading toward my “Strong Romney” category.
With the polling as all over the place though, I’d reserve judgement on that. The next polls may move in the opposite direction. For the moment though, Missouri is very much in the “Weak Romney” category, meaning Romney has a pretty substantial advantage there, but not so large that he can feel safe completely ignoring the state.
This change once again reduces Obama’s best case:
|
Romney |
Obama |
| Romney Best Case |
317 |
221 |
| Current Status |
235 |
303 |
| Obama Best Case |
180 |
358 |
This means that even in his best case, Obama can’t reach his 365 to 173 victory margin from 2008. Even though Romney has had a good month in our models, Obama is still ahead… but the margins from 2008 are veery unlikely. This will be closer than 2008 unless something dramatic changes.
Note: Chart and map from the Abulsme.com 2012 Electoral College Prediction page. Both assume Obama vs Romney with no strong third party candidate and show polling as it currently exists. Things will change before election day. On the map red is Romney, blue is Obama, gold states are too close to call. Lines on the chart represent how many more electoral votes a candidate would have than is needed to tie under several different scenarios. Up is good for Obama, Down is good for Romney.
Edit 2012 Sep 6 09:34 UTC to add final note.
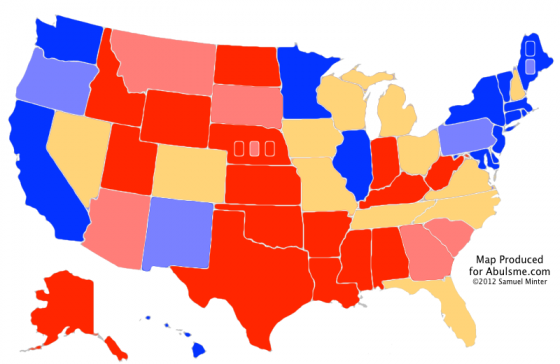
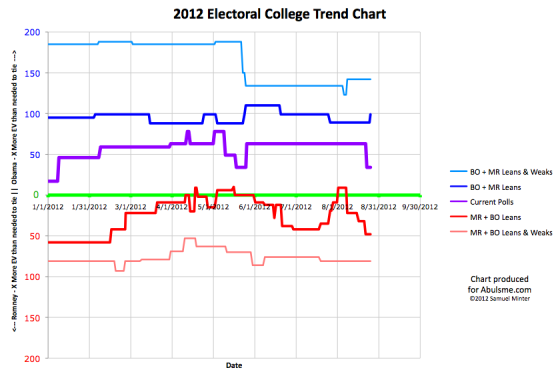
One change in this update, and for the first time in more than two weeks it is a move in Obama’s direction.
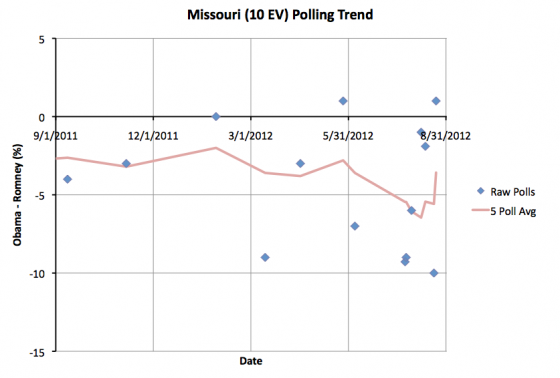
The state that moves this time is indeed Missouri (10 ev), the location of the recent dustup about comments made by Todd Akin. Could some of that be spilling into the presidential poll numbers? Well, I’d be reluctant to say that quite yet. Two of the five polls in the five poll average were taken after the incident last weekend. A PPP poll on the 20th showed Romney up 10% in Missouri. Then a Rasmussen poll on the 22nd showed Obama up 1%. Now, perhaps that was real movement caused by the coverage going on in those days. Or not. The two polls are just not enough to get a good grasp on that.
The addition of the latest poll does drop Romney’s lead in the state in my average to 3.6% though, which is enough to call the state close again. While Obama is still behind here, it is now close enough that putting some effort into trying to win it doesn’t seem completely unreasonable. Having said that, despite a few scattered polls showing Obama leads, Obama has never been ahead here in the five poll average. Obama winning Missouri is unlikely absent large moves nationally pushing toward an Obama landslide.
This does improve what I call Obama’s “best case”:
|
Romney |
Obama |
| Romney Best Case |
317 |
221 |
| Current Status |
235 |
303 |
| Obama Best Case |
170 |
368 |
Obama’s best case now actually exceeds his 2008 results (a 365 to 173 victory). This would require a sweep of all of the close states though, including the ones he is behind in at the moment. That would be Florida (29 ev), North Carolina (15 ev), Tennessee (11 ev) and Missouri (10 ev). In the five poll average at the moment, Romney is ahead by 3.5% in Florida, 0.6% in North Carolina, 4.2% in Tennessee and 3.6% in Missouri.
I’ve always said that a lead less than 5% can disappear overnight with the right events in the news, but still, it is hard to imagine at the moment the kind of news that would get Obama all four of these states.
Florida has bounced back and forth all year. It is easy to imagine it going either way.
North Carolina is more of a stretch. Obama has sometimes been in the lead there, but most of the time Romney has been. But maybe if things go very well for Obama he will manage North Carolina.
Tennessee and Missouri though? Obama has never been ahead in those states. Obama taking leads in either states would be indicative of a huge Romney collapse.
The Republican convention is starting in a few days though. So don’t expect many moves in Obama’s direction in the short term. Unless the convention is a huge disaster, it is much more likely we see more movement toward Romney from now until the Democratic Convention gets under way.
Note: Chart and map from the Abulsme.com 2012 Electoral College Prediction page. Both assume Obama vs Romney with no strong third party candidate and show polling as it currently exists. Things will change before election day. On the map red is Romney, blue is Obama, gold states are too close to call. Lines on the chart represent how many more electoral votes a candidate would have than is needed to tie under several different scenarios. Up is good for Obama, Down is good for Romney.
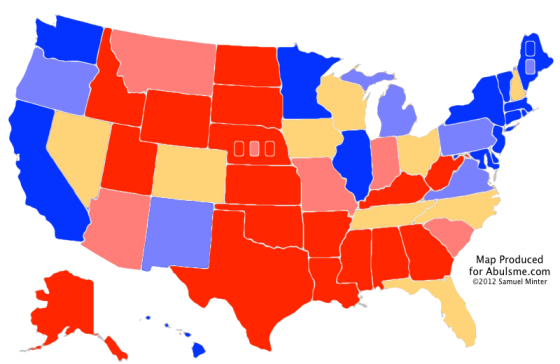
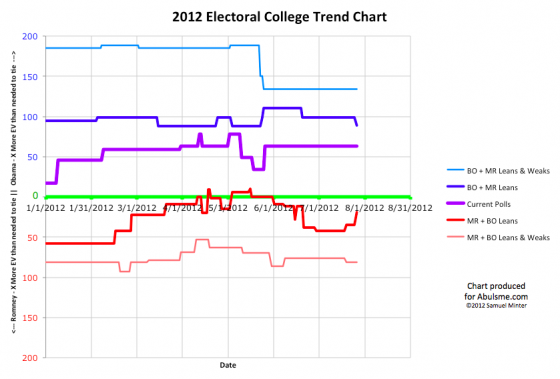
Chart and map from the Abulsme.com 2012 Electoral College Prediction page. Both assume Obama vs Romney with no strong third party candidate. Both show polling as it currently exists. Things will change before election day. On the map red is Romney, blue is Obama, gold states are too close to call. Lines on the chart represent how many more electoral votes a candidate would have than is needed to tie under several different scenarios. Up is good for Obama, Down is good for Romney.
Two states change status today, both moving out of swing status, one toward Obama, one toward Romney. In order by electoral weight:
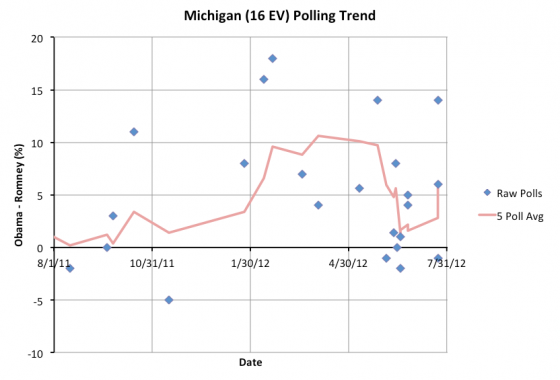
First up, Michigan, with 16 electoral votes. Obama’s lead in Michigan had dropped from over 10% in the 5 poll average back in April, down to just barely over 1% in June. It has now rebounded to 5.6%, which I consider a large enough lead to take it out of reach for Romney, moving it into the “Weak Obama” category. Now, the last three polls, all released in the last couple days, are all over the place… +14 Obama, +1 Romney, +6 Obama. (The two older polls in my average at the moment are +5 Obama and +4 Obama). So there may be a lot of uncertainty here until we get more polls to validate where we really are. But we average out the admittedly huge polling differences, and end up with a decent Obama lead.
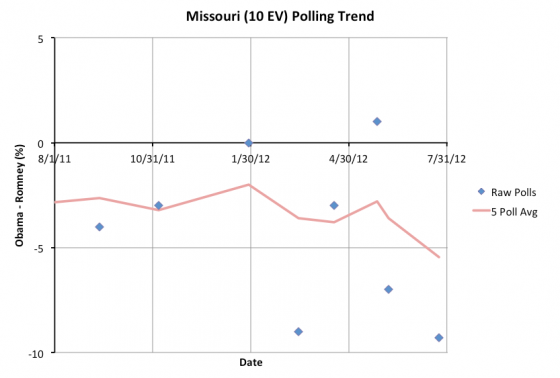
Next up is Missouri with 10 electoral votes. Missouri has been pretty sparsely polled this year, despite most of those polls showing a pretty close race (with Romney slightly ahead). You’d think it would be polled more often since even though there was a consistent Romney lead, it was a small lead, and thus the state might have been vulnerable. At this point though three of the past 5 polls show a Romney lead more than 5%, and the 5 poll average is +5.5% Romney, so Missouri moves out of my swing state category into “Weak Romney”.
The result of all this?
|
Romney |
Obama |
| Romney Best Case |
288 |
250 |
| Current Status |
206 |
332 |
| Obama Best Case |
180 |
358 |
Both Romney’s Best Case and Obama’s best case get a little worse. Since Romney’s best case is weaker, this is more critical to him. His best case now has him with only 19 more electoral votes than needed to tie. This makes Florida once again a must win state. With this configuration of close states, unless he captures some states where Obama is ahead by more than 5% right now, Romney can’t win without Florida. He can still afford to lose Ohio, but only if he then wins EVERY other close state.
With this update Romney’s paths to victory once again narrow. In order to get to a more comfortable place, he needs to be pulling more of Obama’s weak states back into contention. Pennsylvania (20), Michigan (16) and Virginia (13), I’m looking at you.
And then of course he has to actually start pulling states over the line to his side. The “current status” where everybody gets all the states they are even slightly ahead in, hasn’t changed at all since May… We’re at Obama 332 Romney 206… which is only slightly different from where we were in FEBRUARY (Obama 328 Romney 210). There has been movement around the edges, and some short term fluctuations in April and May, but for the most part, not much has moved at all… if Romney wants to win, he needs to start getting some more traction in some of the critical states pretty soon.
The line is always “a lot can change before November”. There is no question that is very true. But there is a lot less time left to make that change happen than there was. Tick tock.
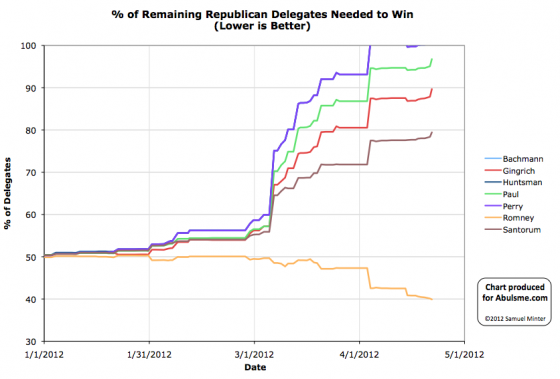
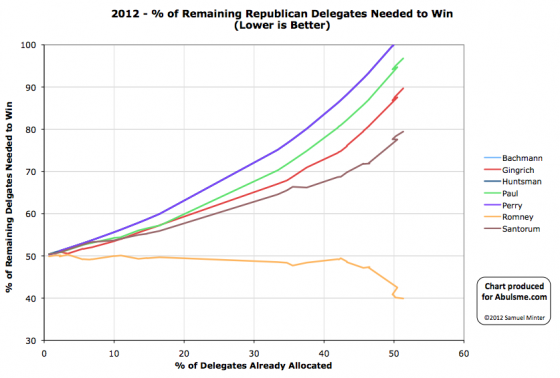
Charts from the Abulsme.com 2012 Republican Delegate Count Graphs page. When a candidate gets down to 0%, they have clinched the nomination. If they get above 100%, they have been mathematically eliminated. The first chart is by date, the second is by “% of Delegates Already Allocated”. These numbers include estimates of the eventual results of multi-stage caucus processes which will be refined as the later stages occur.
We finally have some results that aren’t just a handful of superdelegates, or minor revisions to a previous state’s tentative results. We have actual new results coming out of a state’s process. In this case, Missouri just finished its Congressional District Conventions, which allocate 24 of the state’s 52 delegates. (The rest will be determined at the State Convention on June 2, or are superdelegates.)
So… how did it turn out?
Romney 12, Santorum 7, Paul 4, Gingrich 1
With 50% of the delegates, Romney exceeds the 40.1% of the delegates he needed to be on pace to get to 1144. None of the rest come even close to the percentages they needed.
In terms of “% of Remaining Needed to Win”:
- Romney: 40.1% -> 39.9%
- Santorum: 78.4% -> 79.4%
- Gingrich: 87.9% -> 89.7%
- Paul: 95.1% -> 96.8%
Now, I’m sure Romney would have liked to have gotten significantly more than 50% here. But 50% will do. He’s comfortably on track to get to where he needs to be, and of course everybody else is still racing toward elimination.
Having said that, we should have the results from Minnesota’s Congressional District Conventions soon. Green Papers hasn’t finalized their results for Minnesota yet, and they haven’t been updating their totals based on the partial results that have been trickling out since March 31st, but they have been updating their notes on the process and all the indications are that… wait for it…
Ron Paul will walk away with more than 83% of the delegates from this stage of the Minnesota process… with Romney completely shut out, getting no delegates at all. Of course, Paul would need to be getting about 97% to be on a pace to catch up and win, but still… 83% is pretty impressive.
That is getting ahead of things though. We’ll talk about Minnesota once Green Papers updates their delegate total from the initial estimates they made after the caucuses in February. For the moment, that hasn’t happened yet.
(Edited 2012 Apr 24 05:44 UTC to add my standard intro paragraph which I had forgotten when I first posted this.)
|
|


