You may have heard all the breathless coverage last night of Sanders’ surprise win in Michigan. And it was indeed a surprise. He outperformed all the recent polls by a substantial margin. This was a big huge win, right?
Well, no. It wasn’t. The media hype is all around the fact that it is more interesting to cover an actual race than a slow march to an almost inevitable win. Time to look at the numbers.
First of all, the straight up delegates out of Michigan: Sanders 69, Clinton 61
That means Sanders got 53.1% of the Michigan delegates. To be on a pace to catch up and win, he needed 60.2% of the delegates. He may have “won”, but he didn’t win by anywhere near enough to actually catch up with Clinton.
But Michigan wasn’t the only state handing out delegates. Mississippi did too. And Mississippi went for Clinton 32 to 4. So the total for the day was actually Clinton 93 to Sanders 73.
There were also some superdelegate updates since my last post. Net change: Clinton +4, Sanders +3.
So total since the Maine results on Sunday: Clinton 97, Sanders 76.
So Sanders only got 43.9% of the delegates since Sunday. This is not close to 60.2%.
Yes, Sanders pulled out a surprise win in Michigan. But he could duplicate that win in EVERY STATE from here until the end of the primary season and he STILL would not catch up. He would not win. He can’t catch up by “just winning”. He needs to win by huge margins to catch up. That did happen (barely) in Maine. But Michigan didn’t do it, and Sanders has only very rarely managed the margins he would need to catch up.
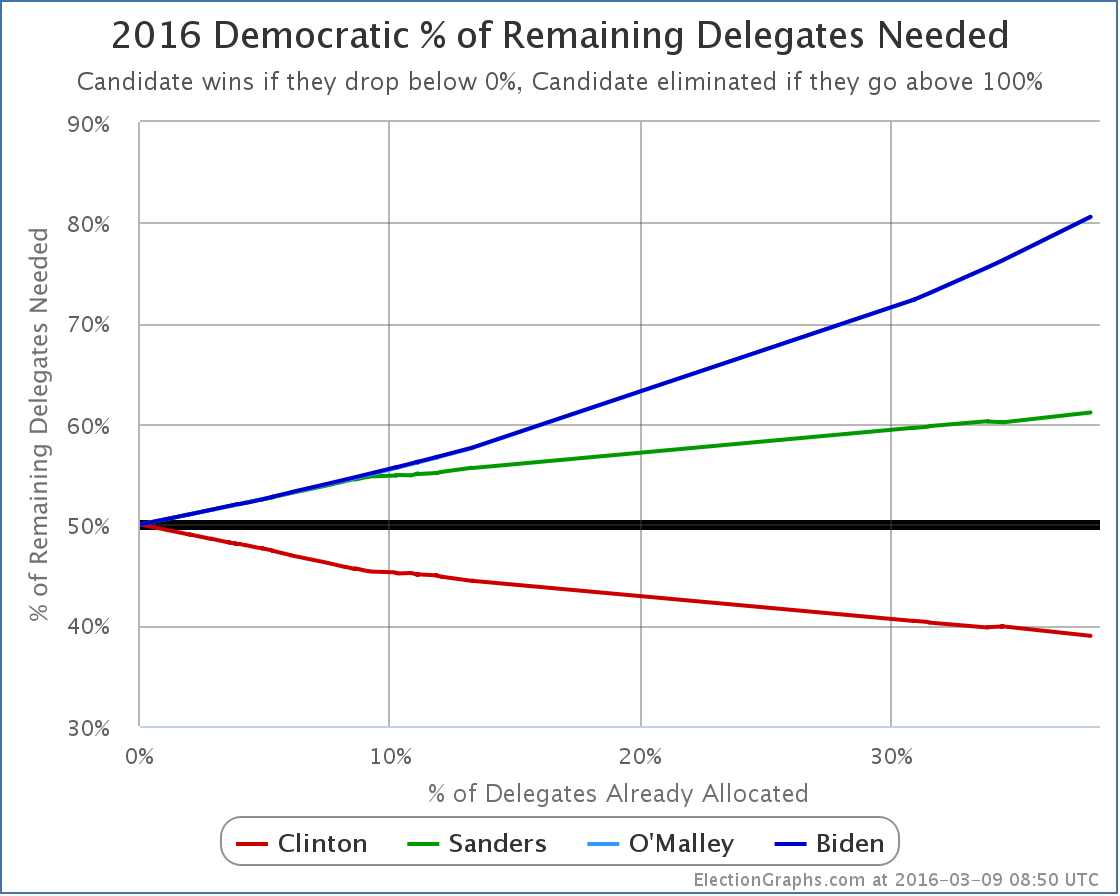
So, looking at the graph of “% of remaining needed to win”:
Clinton now needs 38.96% of the remaining delegates to win. Sanders needs 61.14% of the remaining delegates to catch up.
Oh, unless the superdelegates start changing their minds in massive numbers. That would make things harder for Clinton and easier for Sanders. And to be fair, if all 460 of Clinton’s superdelegates flipped to Sanders tomorrow, Sanders would indeed be ahead by 1035 delegates to 771.
I wouldn’t hold my breath on that one though.
Right now the totals are Clinton 1231, Sanders 575.
Next up are the Northern Marianas on Saturday, then Florida, Illinois, Missouri, North Carolina and Ohio next Tuesday.
[Edit 16:22 UTC to add the following exchange]
Minutes after I posted this update, I got a comment via Facebook that prompted me to do some additional analysis. It seemed directly relevant and interesting, so adding it here (lightly edited):
Jenn: Since superdelegates have never actually gone against the popular vote and could change their minds, what’s the math if we simply exclude them? I’m not saying it’ll happen. I’m just curious and too lazy to do it myself.
Sam: On superdelegates, my position is that if they ever start to change their minds because of the results of the pledged delegate race, we will see that because they will say so. So speculating about them changing their minds is pointless, you can actually watch and see if they do. If they start changing their minds, then it is a real thing and it will be measured and tracked as it happens. So long as they don’t, it is just a fantasy. But OK, I’ll quickly do the calculation of what things would look like if you only look at pledged delegates and assume superdelegates will follow the pledged delegate result.
[Edit 2016-03-10 16:07 UTC to strike through the calculation below due to really bad stupid math error that completely invalidates the result. Sanders needed percentage will be closer to 55%. Redoing calculations shortly.]
Sam: OK. Here goes. The current totals are Clinton 1231, Sanders 575, O’Malley 1. If you take out supers, that becomes Clinton 771, Sanders 552. Now, there are 2472 delegates total, so you need 1237 delegates to win. But that includes superdelegates. If the assumption is that supers will go for the pledged delegate winner, then you shouldn’t count them in the total number of delegates either because they now don’t matter. Without supers there are 1755 delegates, and you need 878 to win. Sanders therefore needs 326 more delegates to catch up and win. Between Clinton and Sanders they have collected 1323 delegates already. So there are only 432 pledged delegates remaining. 326/432 = 75.5%. So if you look only at pledged delegates it is actually WORSE for Sanders. He needs nearly 76% of the remaining delegates to catch up and win rather than “only” 61%.
[Edit 2016-03-10 17:30 to add additional conversation correcting the erroneous calculation. I am leaving the first version struck out above for the record. The below is lightly edited from the original Facebook conversation.]
Sam: Urg!!!! I made a huge error on those calculations! I blame it on…. Uh…. Being stupid. I used the total number of Republican delegates in one part of the calculation rather than the Democratic totals, which of course invalidates the whole thing. I suspect Sanders actually needs closer to 55% if you don’t count supers. I will redo the calculation.
Sam: OK, here goes again. I suck. Numbers that have changed bolded. The current totals are Clinton 1231, Sanders 575, O’Malley 1. If you take out supers, that becomes Clinton 771, Sanders 552. Now, there are 4765 delegates total, so you need 2383 delegates to win. But that includes superdelegates. If the assumption is that supers will go for the pledged delegate winner, then you shouldn’t count them in the total number of delegates either. Without supers there are 4048 delegates, and you need 2025 to win. Sanders therefore needs 1450 more delegates to catch up and win. Between Clinton and Sanders they have collected 1323 delegates already. So there are only 2725 pledged delegates remaining. 1450/2725 = 53.2%. This is significantly better than the 41.7% of pledged delegates Sanders has gotten so far, but it is not yet in the impossible zone by a long shot, and it is still better than where he is when you include superdelegates. Apologies for the stupid error.
Sam: I had actually checked and rechecked the calculation several times before posting it originally, but I made the same mistake every time. Sigh! Oh well!
Sam: See also this article by Andrew Prokop for more on what would be involved in a Sanders comeback. It was while reading this that I realized my error.
[Update 2016-03-10 06:45 UTC – Update in Michigan shifts 2 additional delegates from Sanders to Clinton. This does not substantially change the analysis above. In addition, the number of total “unpledged PLEOs” was adjusted in several states, giving a net addition of 1 total convention delegate.]
[Update 2016-03-11 05:29 UTC – Superdelegate update: Clinton loses one as a second superdelegate says they will just vote for the pledged delegate winner, putting them back in the uncommitted category for now.]
[Update 2016-03-12 23:50 UTC – Superdelegate update to prepare for March 12th results: Clinton +1, Sanders +1]
Note: This post is an update based on the data on ElectionGraphs.com. Election Graphs tracks both a poll based estimate of the Electoral College and a numbers based look at the Delegate Races. All of the charts and graphs seen in this post are from that site. Additional graphs, charts and raw data can be found there. All charts above are clickable to go to the current version of the detail page the chart is from, which may contain more up to date information than the snapshots on this page, which were current as of the time of this post. Follow @ElectionGraphs on Twitter or like Election Graphs on Facebook to see announcements of updates or to join the conversation. For those interested in individual general election poll updates, follow @ElecCollPolls on Twitter for all the polls as they are added.
[Edit 15:59 to fix one place I said Sanders instead of Clinton. Fixed. Thanks Jenn for pointing it out.]
[Edit 2016-03-10 21:12 UTC to fix author of Vox article I linked to.]

