This is the website of Abulsme Noibatno Itramne (also known as Sam Minter).
Posts here are rare these days. For current stuff, follow me on Mastodon
|
OK, beating a dead horse a bit, but I finally made graphs, so one more look. (Previous comments on this here and here, 2012 Delegate race here, 2008 Delegate races here.)
The key is that while if you look at the calendar, and say where were things on February 22nd 2008…
On the Republican side you’d see that McCain had for all intents and purposes wrapped things up. On that date 60.4% of the delegates had already been allocated. McCain had 63.9% of the delegates, while his closest competition (Romney) only had 19.9%. In order to get to his magic number McCain only needed 29.0% of the remaining delegates. For Romney to catch up, he would have needed 96.0% of the remaining delegates. Romney was just days away from being mathematically eliminated (that would happen on February 26th).
Meanwhile on the Democratic side, 64.1% of the delegates had been allocated. Obama had 50.8% of the delegates to Clinton’s 48.2%. To win Obama needed 48.6% of the remaining delegates, Clinton needed 53.3% of the remaining delegates. Clearly the Democratic race was still close (although from here on out, Obama just increased his lead, Clinton never really made up any ground except when Florida’s delegates were reinstated near the end). But the Republican race was over.
You’d then compare to Romney today and build a narrative of Romney not being able to close the deal, of wondering why he can’t just wrap this up, after all McCain had wrapped this up by this time, right?
But this year, on the Republican side, as of today we only have 11.0% of the delegates allocated (and that counts estimates from caucus states, it is less without that). So how does this year look and compare with 2008 when you look at it by % of delegates allocated instead of by date?
Well, here is the “% of remaining needed to win” chart with % of delegates allocated on the horizontal axis instead of date:
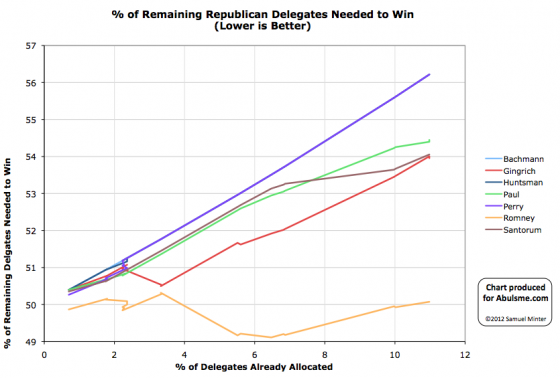
You can see clearly that Romney is well ahead of his competition, and while he isn’t yet diving down toward zero (indicating he is heading quickly to the nomination) he is holding steady, while everybody else is trending upward toward being eliminated. Gingrich and Santorum are neck and neck for 2nd place and both need about 54% of the remaining delegates to catch up and win. 54% is not an impossible number in a two man race. It is a lot better than either has done so far, but if one of them stops getting delegates and the other picks up all of their support, it is in the realm of the possible. But it would be a significant change from what has happened so far. Note, for instance, that even when Santorum won states, he didn’t win by a big enough margin to actually be catching up. His line still went up.
Now what did this look like in 2008? The closest comparison for the Republicans would be as of February 5th… the day before Super Tuesday. At that point 9.4% of the delegates had been allocated.
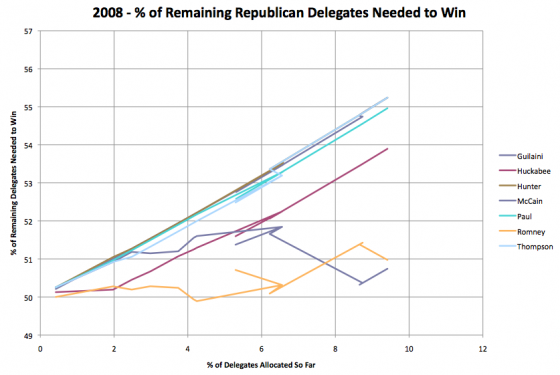
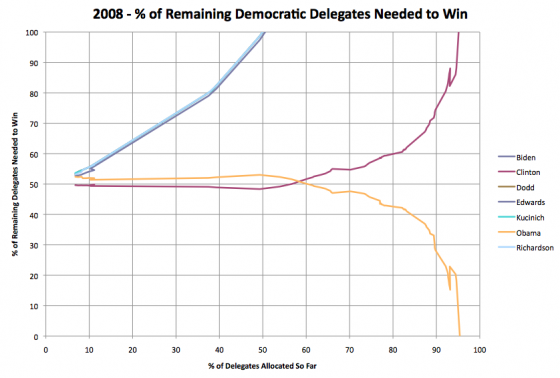
What do we see here? A very different pattern. McCain had only recently (in terms of % of delegates) pulled ahead, but Romney was still close… and gaining! We had a two person race where both were within shooting distance of each other, and neither were yet heading either rapidly up or down on this chart, indicating that they were either on the way to elimination or to the nomination. In 2008 at this point, things really were still close. The very next day, on SuperTuesday, McCain would essentially run away with it, and that would be that. But comparing comparable points in the delegate race, Romney actually has a much bigger lead and advantage on his competition than McCain had in 2008.
One more comparison though… The Democrats in 2008. The comparable date there is also February 5th, the day before Super Tuesday. 10.3% of the delegates had been allocated on that side on that day.
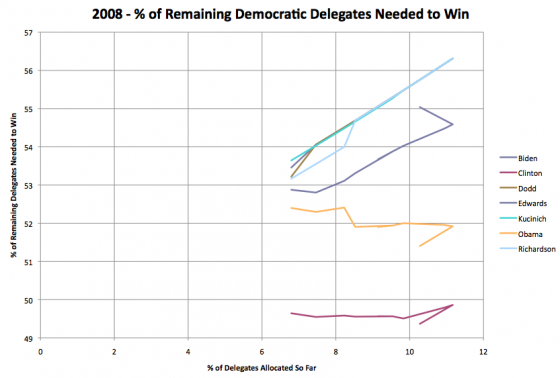
There are a few oddities in the data from back then… my sources had allocated some delegates, then backtracked, causing the little bit of backtracking on the chart, and when my tracking started on January 1st almost 7% of the delegates were already in place because of Super Delegates who had declared their preferences)… but you can still see the trends.
So, most important thing you see here… Clinton was still in the lead! Obama didn’t catch her in delegates until significantly later. But it is clear that both Obama and Clinton are still in contention. Their lines are basically horizontal, and they were pretty close to each other. Neither of them had started moving toward the nomination really, but neither was showing a pattern of getting eliminated either… like Edwards and all the rest were.
In this year’s race, all of Romney’s competition are in worse positions than McCain’s competition was at the same time. It is not yet too late for one of them to mount a push and catch up… but it is getting close. Even with the vastly stretched out schedule, there is still a big enough chunk of states coming up on Super Tuesday that we’ll probably see that day be the do or die day for all the not-Romneys. At least for actually catching up and winning. Blocking Romney from 1144 is a lot easier task than actually winning at this point. We’ll know a lot more about how possible (or not) that scenario is after Super Tuesday as well.
OK, long post, but finally, for reference, here are the two races in 2008 in full as they played out (rather than just looking at the first 12%).
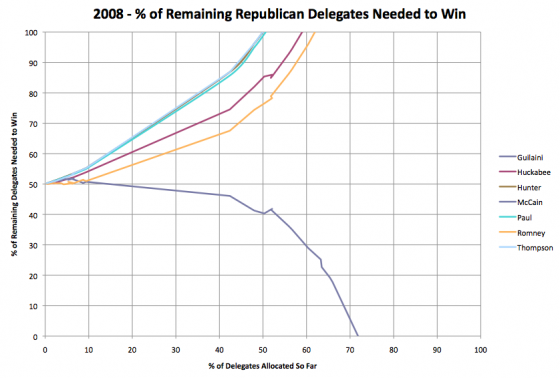
And here is this year’s Republicans at the same scale…
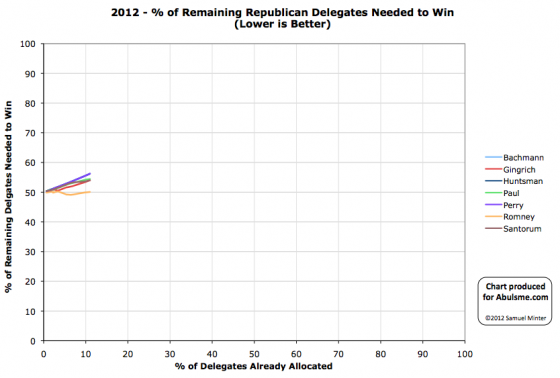
Just a little ways left to go, huh?
I couldn’t stop thinking about it, so another thought comparing the Republican race now versus 2008. This was also first posted as a comment on the Primary Season Amnesia post on Chris Weigant’s blog.
One more follow up thought… it really is very important that the calendars are so different between this year and 2008… so let me explicitly do the conversion. As of today, 2012 Feb 14, we have 10.98% of the available delegates allocated or estimated. The closest comparison we would have had in 2008 was February 4th and 5th, at which point 9.41% of the available delegates had been allocated.
On that day… McCain was ahead of Romney, but just barely. McCain had 43.3% of the delegates so far (and needed 50.7% of the remaining delegates to win). Meanwhile Romney was his closest competition and right behind… 41.1% of the delegates so far (and 51.0% of the remaining delegates needed to win.) This was still a race. These guys were very close to each other at that point. (Unlike this year, where Romney has a very substantial lead on Gingrich at this point.)
So if anything, at a comparable point in the delegate race (as opposed to the time of year) Romney is actually MUCH better off than McCain was at the same point. Gingrich is much further behind Romney than Romney was behind McCain. Romney and McCain were neck and neck. Gingrich is nowhere close to Romney in delegates, and everybody else is even further behind.
But February 5th was Super Tuesday. It took several days for all the delegate estimates from Super Tuesday to be complete… but most of them were in by February 8th, and no other primaries or caucuses had happened yet. At that point 50.29% of the delegates had been allocated. McCain now had 59.6% of the delegates so far, and only needed 40.3% of the remaining delegates to get to the magic number and win the nomination. Romney by contrast, now had only 23.9% of the delegates and needed a full 76.5% of the remaining delegates to catch up and win.
So post-Super Tuesday, McCain could do worse than he had done so far by a 20% margin and still win. But Romney needed to more than triple how he had been doing in the delegate count to catch up and win. These are again the kind of numbers where the press will still call it a race because it is fun, but the reality is that in order to close that kind of gap the front runner essentially has to totally collapse AND things have to go very very right for their challenger too…
As for this year, things are MUCH more spread out. After Super Tuesday we’ll still only have some 35% of the total delegates allocated, as opposed to over 50% in 2008. So even if after super Tuesday, Romney is finally starting to get his “% of remaining needed to win” to come down instead of staying flat, he’ll have a decent slog to actually collect the 1144 delegates. If he still is hovering around 50% of the delegates (or less!) at that point instead of routinely winning more than half of the delegates, then we’ll have quite a nice bit of fun before we get to the end of this, and the possibilities of brokered conventions start becoming more real.
But in terms of the delegate race, in comparison to 2008, it is really very early. On February 14th 2008, 56.55% of the delegates were already allocated. We won’t get to that point in 2012 until the end of March or beginning of April (depending on how fast super delegates announce their positions). It was very front loaded last time. This time it is very stretched out….
This morning I saw a post referring back to 2008 race. The part that caught my attention was this:
Primary Season Amnesia
(Chris Weigant, 2012 Feb 13)
Even accounting for such differences, the 2008 race was still a very close three-way contest in early February. Romney and McCain were almost even in states won, with Huckabee not all that far behind. This year, Mitt Romney has won four states, Rick Santorum four, and Newt Gingrich one.
You’d think the media would remember these facts, but (once again) we are being subjected to endless stories about how downright unique the 2008 Republican primary season is, along with the exact same storylines that ran in 2008 about the frontrunner not being able to close the deal, especially with conservative voters. McCain, back then, raised just as many suspicions among the conservative Republican base that he “wasn’t one of us” that Romney now hears.
I had to respond, as while I have no doubts that the media narrative was all about McCain still having trouble closing, the delegate numbers just didn’t support that story. (The media would do the same thing months later while they continued to talk breathlessly about the Obama vs Clinton race long after it was mathematically clear that it would take an absolute unprecedented miracle for Clinton to actually catch up and win.) Anyway, I posted the following as a comment at Chris Weigant’s site. (Awaiting moderation as I post this on my site.)
Sorry for the really long comment… probably should just post on my blog. :-)
The media narrative in 2008 at this point in time may well have been that McCain was having problems closing the deal, but looking at delegate counts, there was a very different story. There was NOT a close three way race in mid-February. Take a look at my page showing how the delegate race played out in both parties last time around:
http://wiki.abulsme.com/2008_Presidential_Delegate_Graphs#Republicans
By this time in February (indeed, essentially immediately following Super Tuesday, but he continued to consolidate after) McCain had essentially already put this away.
The key thing I use to measure this is the percent of the remaining delegates available that the candidate would need to cinch the nomination. This takes into account both what the candidates already have gotten, and the dwindling number of remaining delegates available to catch up. At this point in February 2008, McCain had amassed a big enough lead that he had over 60% of the delegates allocated thus far, and only needed about 35% of the remaining delegates to clinch the nomination. In other words, he could do much worse than his record up to that point and still win. By comparison, at this point his closest competition was Romney, who had collected about 22% of the delegates so far, and would have needed to get about 87% of the remaining delegates to catch up and win. 87%!!!! Compared to the 22% he had managed so far! This was not a realistic outcome absent a major McCain collapse or scandal… and probably the other candidates dropping out too.
Starting with Super Tuesday last cycle, you can see the clear pattern of McCain completely dominating the race and all other opponents just falling further and further behind while McCain races toward clinching the nomination. Any narrative about him not closing the deal was just not borne out by the numbers.
As you pointed out, the HUGE difference is that we have had less states and a smaller percentage of the delegates allocated so far. Even super Tuesday will be smaller than last time, everything is just more spread out that last time, which means in terms of TIME (as opposed to states) one would of course expect it to take longer for things to settle.
(And indeed perhaps, really, the better time to compare to would have been mid to late January in 2008, when things really were still more unsettled and less states had voted… McCain only even took the delegate lead from Romney on January 30th or so…)
But sticking with February and comparing this year:
http://wiki.abulsme.com/2012_Republican_Delegate_Count_Graphs
Looking at the “% of remaining needed to win” you see all the non-Romney’s rapidly heading upward. With each contest (with the exception of Newt’s win in South Carolina) even if they win, they aren’t winning by big enough margins to be on a pace to actually win the nomination outright. Meanwhile though, there is a big difference from 2008. Rather than Romney’s numbers indicating that he is getting an easier and easier path to the nomination after each state as he gains more and more delegates, we see him hovering around 50%. Right now he is slightly under. (I should say at this point that I use the delegate estimates from the primaries and caucuses by The Green Papers, and the Super Delegate estimates from Democratic Convention Watch.) Romney is staying flat, but to “close the deal” in terms of winning outright before the convention, he has to actually start collecting delegates at a slightly faster pace than he has been so far.
Right now Romney’s closest competition is still Gingrich (although Santorum is closing fast). Right now Gingrich has 17.9% of the delegates so far, and would need to get 54.0% of the remaining delegates remaining to catch up and win. (Santorum and Paul would have to do even better than that.) Now, 54.0% is not an outrageous number, but it is more than three times better than he has been doing so far!!! If that were to start to happen (or the equivalent with the other candidates) it would be a HUGE change compared to what has happened so far in the race. And it would have to happen soon, because if not, that 54% is just going to rise and it will get harder and harder to catch up. One of the other candidates catching up and winning is not impossible, but it would take a major seismic shift changing the dynamics of the race. Perhaps Gingrich continuing to drop rapidly with Santorum picking up most of his support, winning Michigan and getting momentum out of that going into Super Tuesday would do that… but it still needs to be a big change for one of these guys to catch up.
Meanwhile, so far Romney has 49.8% of the delegates so far, but would need 50.1% of the remaining delegates to close the deal. So he has to improve his performance, but just by a LITTLE bit in order to be on pace to actually win the nomination… a few nice big winner take all states would most likely be enough to do the trick. But he is NOT putting it away or closing the deal yet. If all the not-Romney’s combined keep operating at about the level they have been, Romney would get to the convention just short of the 1144 delegates he needs.
Now, there is a long time between now and then, and if he wins the winner take all states and doesn’t completely collapse in the proportional states, he should be able to do that “little bit better” that he needs and wrap this up. At the moment though, none of his competition are in a position to actually WIN unless there are dramatic changes in the dynamics of the race (for instance one of them drops out), but they ARE in a position to block Romney from getting 1144 if they continue to do as well or better (collectively) as they have so far…
(In 2008 at this point, all of McCain’s competition combined were not in a realistic position to even keep him from getting the magic number, let alone catching up to win.)
None of this means I’m predicting a brokered convention… yet. But if Romney is still above 50% of remaining delegates needed after we pass Super Tuesday… then I’ll start to look at that as a realistic possibility. Until then, he is still actually the front runner, although he has clearly lost some momentum.
But Arizona is winner take all, and he is still way ahead there. Michigan is proportional, so chances are even if Santorum wins, it won’t be by enough to actually be on a pace to catch up. A win there would clearly put Romney in danger on Super Tuesday though. But more immediately Arizona is the one to watch because it is winner take all. If Romney wins that, then he consolidates his lead, regardless of what happens in Michigan. If Romney LOSES there… then he is in real trouble.
I’ll note that we also talked a bit about this topic on the episode of the podcast that Ivan and I recorded on Sunday and that I haven’t posted yet (sorry!) but will probably (hopefully!) post tomorrow.
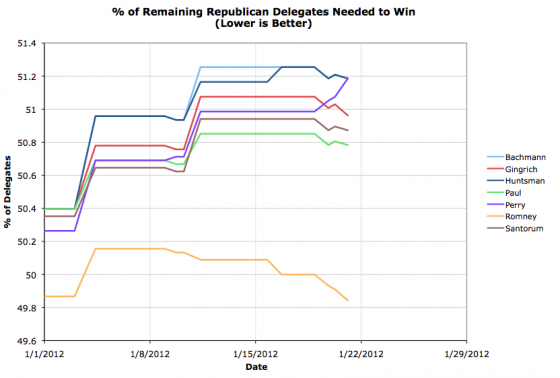
So, as we approach the voting in South Carolina, a few delegate shuffles. Perry’s 3 projected delegates from Iowa get put back into the undetermined category, Gingrich gains one super delegate, and Romney gains one superdelegate. All in all this improves everybody’s position except Rick Perry, although it is best for Romney. So here we are. We’ll see what South Carolina does to all this. In the mean time though, lets do a quick look using a different view:
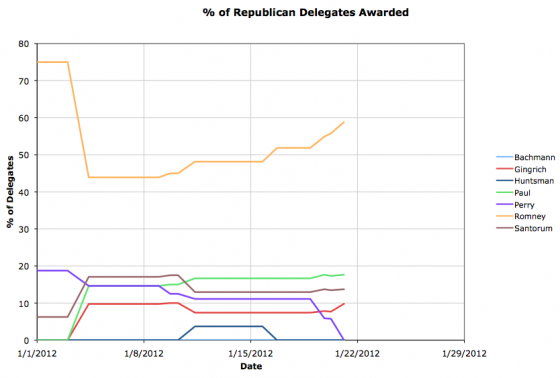
This is the percentage of delegates each candidate has so far. Our Top 4 are: 58.8% Romney, 17.6% Paul, 13.7% Santorum, 9.8% Gingrich. But I wanted to compare, by looking at where we were four years ago.
My most recent update post four years ago is here: Delegate Graphs with Preliminary Results from Nevada and South Carolina Republicans. Now, the primary schedule was a bit different, so there were already some results from South Carolina and Nevada, but where were we?
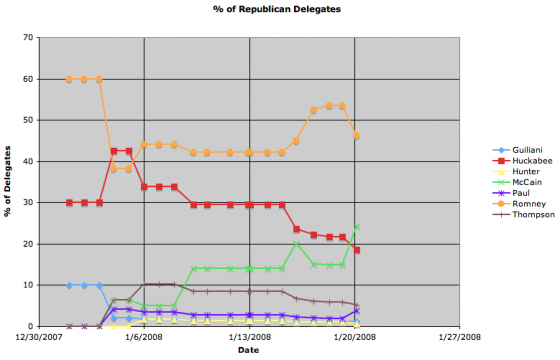
What were the Top 4 back then? 46.2% Romney, 24.4% McCain, 18.6% Huckabee, 5.1% Thompson.
That’s right, at this time in 2008, Romney was ahead in the delegate race. Romney. Not McCain. McCain had just had a big success in South Carolina, which was enough to pass Huckabee and start talk about him being the front runner and how Romney was vulnerable. McCain wouldn’t pass Romney in delegates until January 30th after Florida voted (and then he didn’t look back). So where we are on January 21st isn’t necessarily predictive of the final result.
The dynamics are of course very different this time around. I just mention all this to point out that it is indeed still early. If Gingrich DOES pull out a major victory in South Carolina, taking the lion’s share of the delegates there, then that DOES change the dynamics of the race quite a bit. Romney still has a variety of systematic advantage even in that scenario, but it could make things more interesting for awhile longer!
|
|


