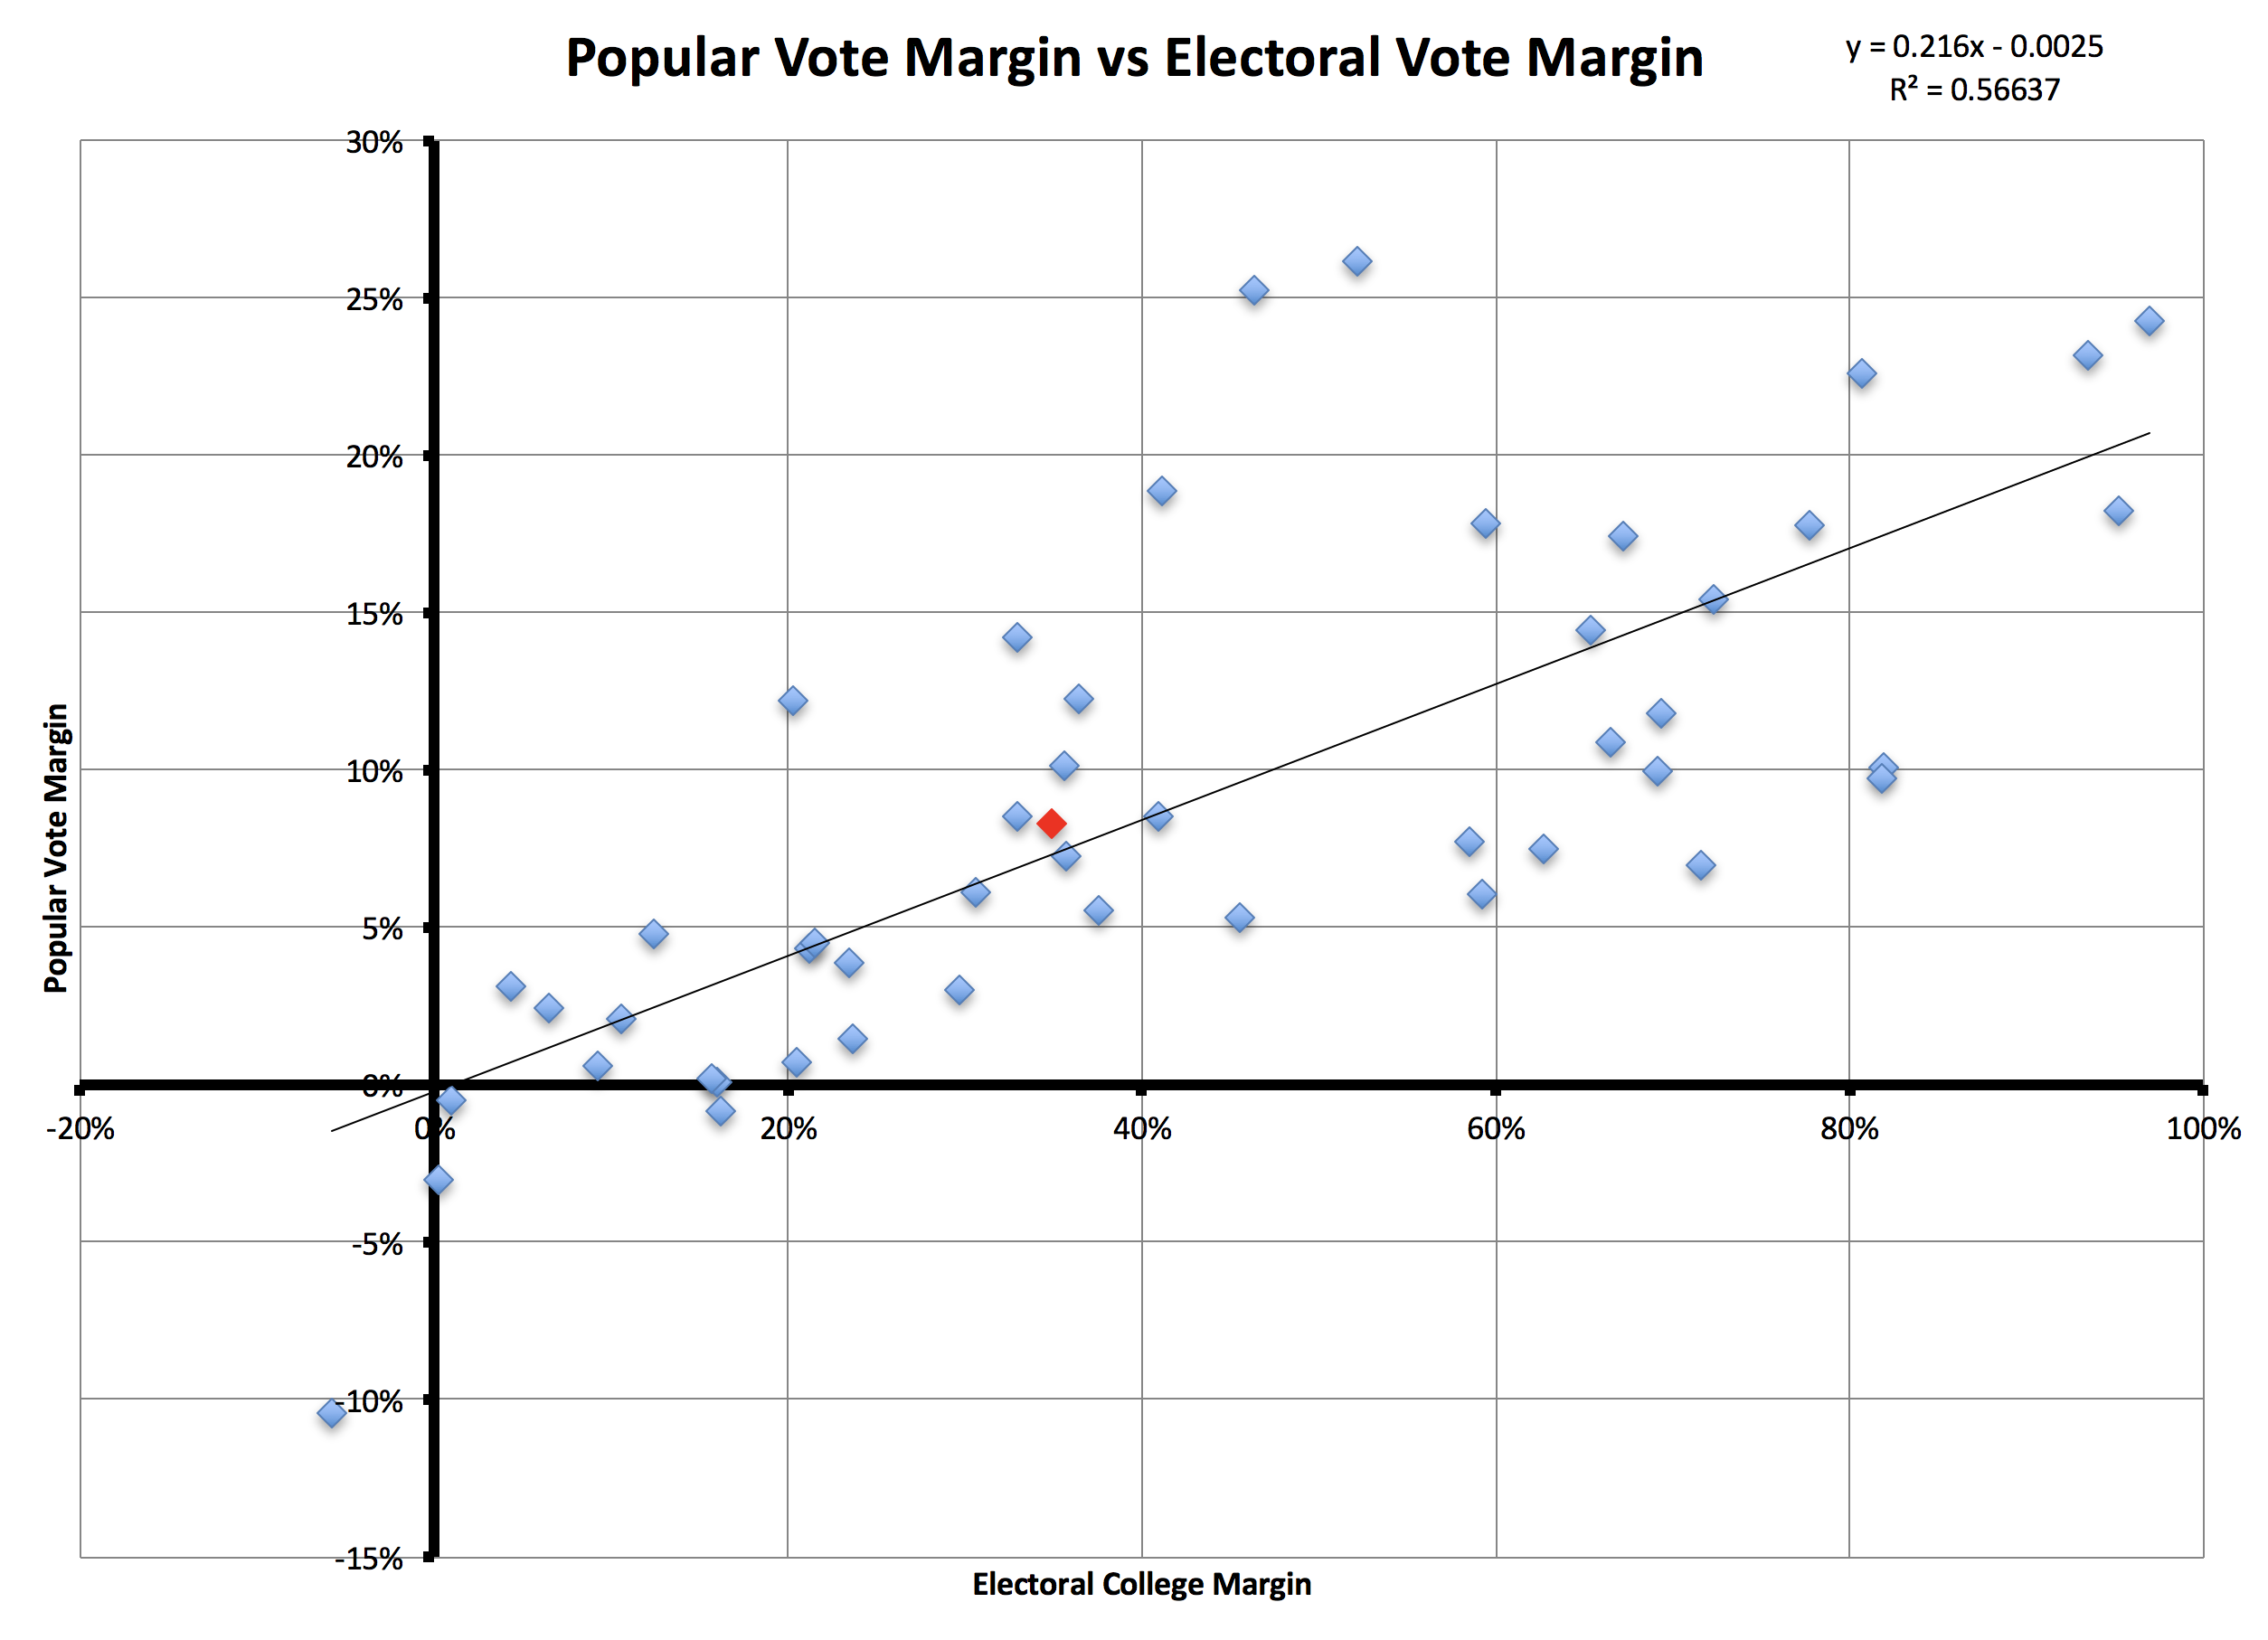
With Trump not currently doing all that well in the polls at the moment, there has been occasional chatter that maybe we’re not just looking at a Trump loss, but a Clinton landslide.
But what exactly is a landslide? There isn’t a really precise definition. Wikipedia says “A landslide victory is an electoral victory in a political system, when one candidate or party receives an overwhelming majority of the votes or seats in the elected body, thus all but utterly eliminating the opponents.”
That’s nice, but not very mathematical. I suppose you could define it in terms of absolute numbers “Landslide is over 80% of the vote” or something like that. But I think you should look in terms of the results in comparison to other elections.
So let me take a shot at defining a landslide in terms of being in the top X% of the elections in terms of the margin of victory. I figured I’d look at US presidential elections and what that would look like at 5%, 10%, 15% and 20%.
Or course there are also two ways of looking at US Presidential elections, by popular vote and by electoral college. So lets look at both. I’ll rank by simple percentage margin, so (winner-loser)/total.
Popular Vote
2016 will be the 49th presidential election where there was a popular vote tally (since 1824)
- 5% biggest wins would be the top 2. Margin to be a landslide = 25.22% (Coolidge 1924)
- 10% biggest wins would be the top 4. Margin to be a landslide = 23.14% (Nixon 1972)
- 15% biggest wins would be the top 7. Margin to be a landslide = 18.21% (Reagan 1984)
- 20% biggest wins would be the top 9. Margin to be a landslide = 17.76% (Roosevelt 1932)
Electoral College
2016 will be the 54th presidential election with an electoral vote tally under the 12th amendment (since 1804)
- 5% biggest wins would be the top 2. Margin to be a landslide = 97.0% (Roosevelt 1936)
- 10% biggest wins would be the top 5. Margin to be a landslide = 84.1% (Jefferson 1804)
- 15% biggest wins would be the top 8. Margin to be a landslide = 80.7% (Johnson 1964)
- 20% biggest wins would be the top 10. Margin to be a landslide = 72.3% (Eisenhower 1956)
Clinton vs Trump
As of right now (August 12th), estimating via current polls:
Popular Vote margin (using Pollster.com average) = Clinton by 7.7%. This would rank as #25 out of 49. Almost exactly in the middle.
Electoral Vote margin (using Election Graphs expected case) = Clinton by 188/538 = 34.9%. This would rank as #32 out of 54. Just below the middle.
If current margins hold, neither of these measures are even close to being in the top 20% in terms of how big a victory it would be. Really, it looks more like it is pretty close to a median win, with about half of elections being bigger wins, and about half being closer.
Now, we have 88 days left. In a normal election we would expect it would probably get tighter between now and November. With Trump being Trump, maybe it will go the other way a bit further.
But Clinton’s lead would have to increase by a LOT to make this election rank with the big landslides of the past.
Some people have argued that with today’s highly polarized landscape, we need to redefine landslide downward, so a much smaller win can be called a landslide. While many people may indeed end up doing that if Clinton wins by the kinds of margins seen above, I think this is silly. A win that is right near the median historically is not a landslide. Sorry.
The truth is just that we are in a time where the public is relatively closely divided… which means the environment is not very conducive to a true landslide win. Given where we are, winning the popular vote by over 7%, or the electoral college by over 180 electoral votes, may indeed be a very impressive achievement. A bigger win than might be expected even.
But it isn’t a landslide.
