| In the latest Curmudgeon’s Corner…
Sam and Ivan talk about:
Just click to listen now: [wpaudio url=”http://www.abulsme.com/CurmudgeonsCorner/cc20120304.mp3″ text=”Recorded 4 Mar 2012″] or |
 |
|
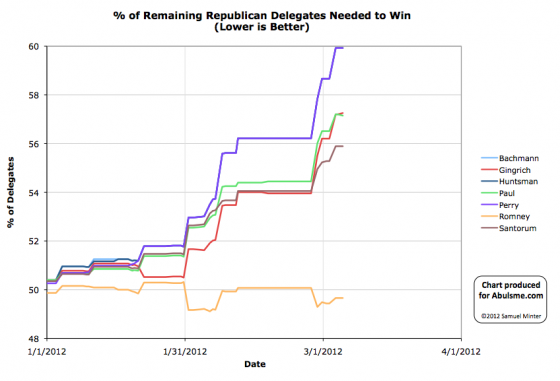
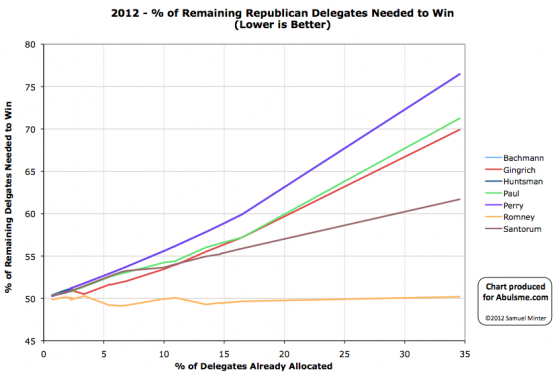
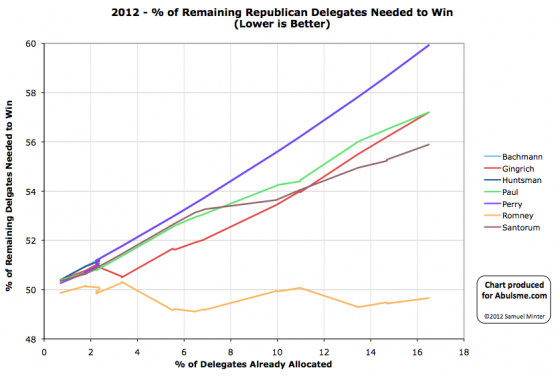
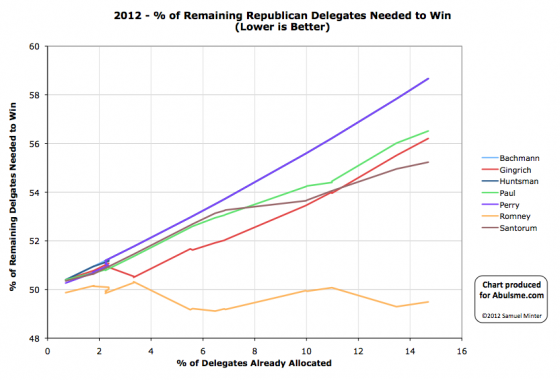
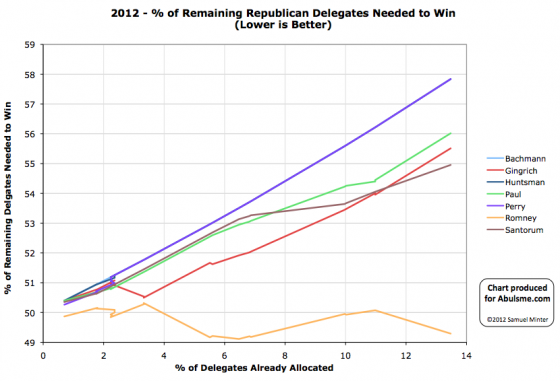
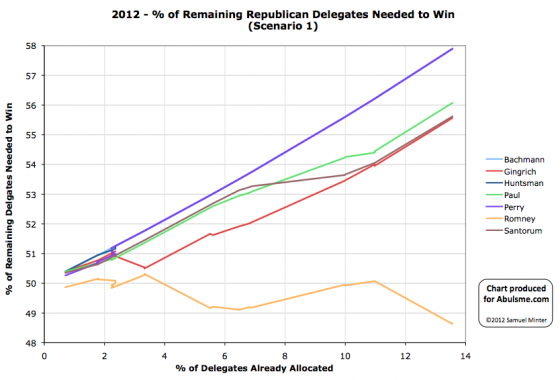
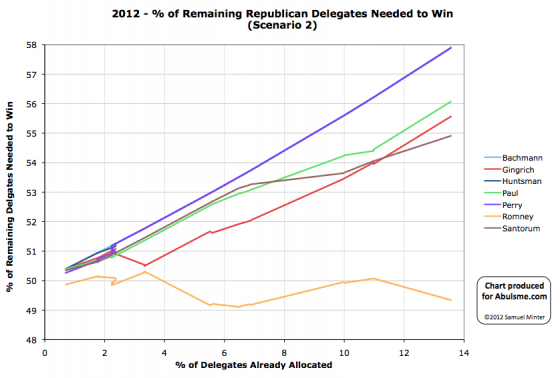
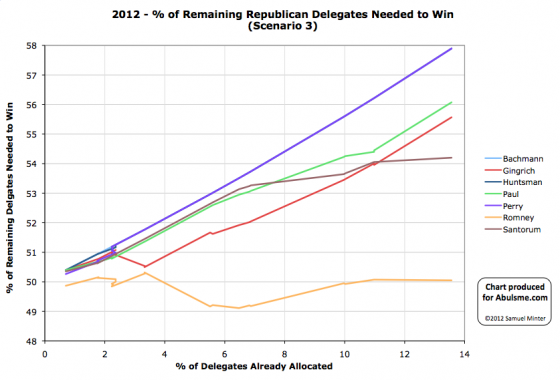
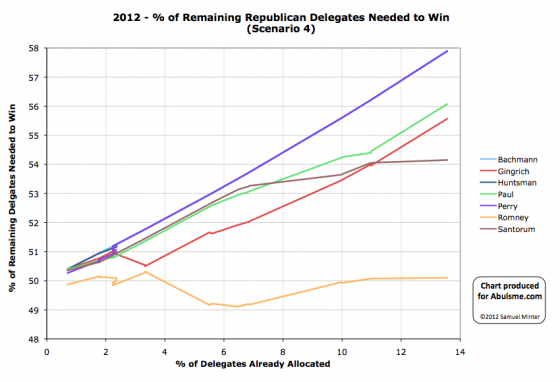
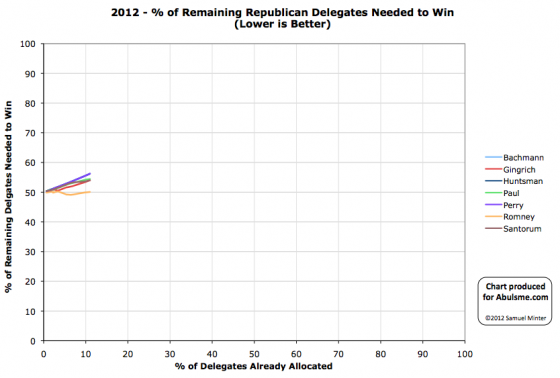
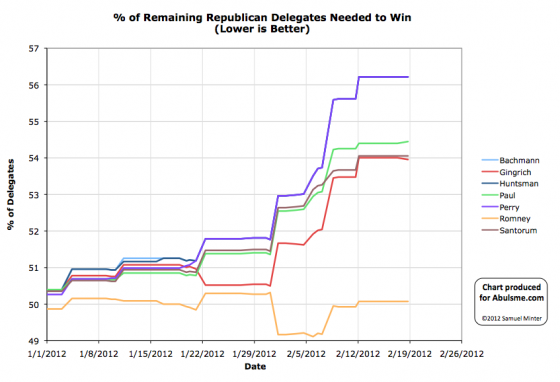
Chart from the Abulsme.com 2012 Republican Delegate Count Graphs page. When a candidate gets down to 0%, they have cinched the nomination. If they get up past 100%, they have been mathematically eliminated. Note that these numbers include estimates of the eventual results of multi-stage caucus processes which will be refined as the later stages occur. The delegate count estimate in Maine is apparently a little jittery. On February 12th I posted the initial results as Paul 8, Romney 8, Santorum 4, Gingrich 1. On February 18th Green Papers updates this to Romney 8, Paul 7, Santorum 4, Gingrich 2. Today this seems to have gotten updated back to Paul 8, Romney 8, Santorum 4, Gingrich 1. So this means for the day Paul gains a delegate and Gingrich loses a delegate. At this point though, one delegate alone doesn’t make a significant difference in the overall picture. According to our Soft Green Papers plus DCW Superdelegate count though, this means Ron Paul actually pulls ahead of Newt Gingrich into 3rd place in the delegate count by a two delegate margin. So I guess there is that. There are a lot of states voting on Super Tuesday (10). Polling is sparse. The delegate rules vary greatly between states and are complicated. I don’t really have the resources or time to do a deep dive here. Luckily, other people do. On March 1st Sabato’s Crystal ball did a detailed delegate prediction while looking at all of those things. (They also included Washington, and it seems they probably overestimated Santorum there, but that’s how predictions go.) They don’t provide a range of predictions, just one. Their best guess, on Super Tuesday: Romney 197, Santorum 144, Gingrich 46, Paul 26. This would bring their totals for the race to: Romney 393, Santorum 221, Gingrich 98, Paul 78. (This from adding Sabato’s numbers to my current estimates which combine the Soft Green Papers count and the DCW super delegate count.) Lets see where we would end up on my “% of remaining delegates needed to win” chart if the above is indeed what happens… Now, technically speaking this is another of my “everybody loses!” results, as even Romney ends up increasing his “% or remaining delegates needed to win” number in this scenario (from 49.7% to 50.2%). But there are definitely degrees of losing, and Romney has by far the best deal here. Lets start at the bottom. After this result Ron Paul would need 71.3% of the remaining delegates to catch up and win, compared to the 9.9% he would have gotten up to that point. This clearly is beyond what is reasonably possible. Paul was never about winning though, he is about getting his message out. So he’ll of course continue on. After this result Newt Gingrich would need 69.9% of the remaining delegates to catch up and win, compared to the 12.4% he would have gotten up to that point. This is also clearly beyond the range of the reasonably possible. So the question becomes if Gingrich can continue to get funding anyway to stay in and continue acting as a spoiler, with the hope that along with the other non-Romneys he can block Romney from getting to 1144. After this result Rick Santorum would need 61.7% of the remaining delegates to catch up and win, compared to the 28.0% he would have gotten up to that point. I am tempted to say this is ALSO clearly beyond the range of the reasonably possible, and I think it actually is. But for the sake of argument, you can imagine a situation where Gingrich and Paul both drop out (unlikely), Santorum picks up ALL of their support (unlikely) AND Romney has a series of major mistakes and his levels of support drop dramatically and significantly and those people decide they like Santorum after all (unlikely) then maybe Santorum can get to 61.7%. (If even more dramatically, on dropping out Gingrich instructed his delegates to vote for Santorum, and a bunch of them indicated they probably would, that would lower the 61.7% number, but still probably not enough.) After this result Mitt Romney would need 50.2% of the remaining delegates to get to 1144 and seal the deal, compared to the 49.7% he had gotten so far. Unlike the other three candidates, these numbers are actually very close to each other. If he continues just that level, he gets blocked, but Romney only has to do SLIGHTLY better than he had been doing up to that point in order to actually win. At this point, Romney would NOT yet have started breaking out to drive his “% of remaining needed to win” number down toward zero. At the same time, he has not had a disaster where this number starts moving dramatically upward. But would these results put Romney in a position where finally pushing “% of remaining needed to win” down in the next few contests gets a lot easier? If the actual result is anything like what Sabato and company predict for Super Tuesday, then it will be absolutely clear that Paul, Gingrich and Santorum are not on a path to win the nomination. (And frankly, even before Super Tuesday, this direction was clear, this would just hammer that home.) But the three of them will still collectively be in a position where if their ability to get delegates remains flat (or increases) they will block Romney. Their ability to keep this as something that remains possible (at least for awhile longer) will in large part depend on how Super Tuesday gets “spun”. If we start hearing from the talking heads about how Romney’s lead is now insurmountable and this is all over, then support for the other three will start to decline rapidly, and in the next contests Romney should be able to finally actually start closing in on a win and it really will be done. If on the other hand, the spin is all about Romney still not closing the deal and that Santorum has momentum out of winning the popular vote in Ohio or some such regardless of the delegate situation, then this drags out a bit longer. But that depends on people continuing to vote for the non-Romneys, even after it is clear they have no shot at winning. It truly does become a “non-Romney” vote specifically aimed at blocking Romney rather than a vote actually for any of these three guys directly. But will the Santorum, Gingrich and Paul people actually do that? Or will they just say “I guess it is Romney” and either vote for Romney or just stay home, finally letting Romney start getting the margins of delegates he needs to wrap this thing up? Given the overall situation, if pressed to make the prediction, I say the spin leans toward “Maybe Romney won the night on delegates… but look at all the shiny states won by the others… and Virginia doesn’t count because Santorum and Gingrich weren’t even on the ballot… Romney is having trouble closing the deal… we need to start looking at Kansas and Alabama and Hawaii and Mississippi and the rest of the states and territories in March (at least). And if this this and this happen, then… BROKERED CONVENTION! Wouldn’t that be AWESOME???” I predict this not because I think the numbers actually back up this case, but because it is in the interests of the press to drag this out as long as possible, so they will hype any ray of hope the non-Romneys have for as long as they can possibly get away with it, which will in turn lead people to continue to think it is a contest and vote for the non-Romneys as the process continues to drag on, which will continue to feed the Romney hasn’t locked it up narrative for awhile longer. They did this in 2008 with the Democrats, they will do it in 2012 with the Republicans. Then eventually it will get to the point where Romney’s lead is so overwhelming it will be hard to sustain that narrative, the support for the non-Romneys will finally start to dissipate, and Romney will slowly but surely make his way to 1144. Having said that, despite my prediction to the contrary, I still hope the non-Romneys can sustain enough between them to block Romney. That would be much more fun to watch. Chart from the Abulsme.com 2012 Republican Delegate Count Graphs page. When a candidate gets down to 0%, they have cinched the nomination. If they get up past 100%, they have been mathematically eliminated. Rather than the date on the x-axis, we show the “% of Delegates Already Allocated” as this better represents the progress through the race. Note that these numbers include estimates of the eventual results of multi-stage caucus processes which will be refined as the later stages occur. So, today’s update includes the preliminary estimates from the Washington caucuses. As always, is important to note that no actual delegates were allocated at this point. That will happen at later stages of the process. Our graphs reflect Green Paper‘s “soft count” estimate, which will change over time as the later stages of the process happen. By those estimates, the results were Romney 16, Paul 10, Santorum 10, Gingrich 4. Santorum also picked up a super delegate since yesterday’s update. So for the day: Romney 16, Santorum 11, Paul 10, Gingrich 4. Bottom line though, we have yet another day where EVERYBODY LOSES. Of course the narrative is all about how Romney has now “won” several in a row, and this gives him momentum going into Super Tuesday. And of course that is a very real effect. “Winning” and the media spin around it have a huge effect. People don’t just vote for their favorite candidate, they tend to want to vote for someone that can win. So things may change in future contests. But as of right now, Romney did the best of the night, but he needed to get 49.4% of the delegates to be “on pace” to get to 1144. He actually got 16/41, or only 39.0%. So the percentage of remaining delegates he needs to get to win actually increases from 49.4% up to 49.7%. This isn’t a big move, but it is a move in the wrong direction. To be wrapping this up, Romney needs to be winning by numbers that drive this metric down. So far, he continues to hover in the range where if he continues as he has been, he will eventually win, but if he starts to do even slightly worse, he can be blocked. For the non-Romneys, their path to the nomination continues to get more and more unlikely. Santorum is still in second place. He now needs 55.9% of the remaining delegates to catch up and win. This would be a remarkable change from the 20.4% of delegates he has managed so far. The more realistic goal for the non-Romneys at this point continues to be that they collectively get enough delegates to block Romney, not that any of them actually collect enough to win themselves. (Having said that, one of these guys catching up is not yet actually impossible if something major happens, it is just getting increasingly likely.) I’ll also note that according to our estimates (combining the Soft Green Papers count and the DCW super delegate count) Ron Paul has now caught up and tied with Newt Gingrich for 3rd in the delegate count. And now we have Super Tuesday. Although not as big as 2008, we’ll still have a large number of delegates awarded. The main thing to look out for: Does Romney’s “% of remaining needed to win” actually start to drop? If not, the possibility of him not getting to 1144 gets a lot more serious. Chart from the Abulsme.com 2012 Republican Delegate Count Graphs page. When a candidate gets down to 0%, they have cinched the nomination. If they get up past 100%, they have been mathematically eliminated. Rather than the date on the x-axis, we show the “% of Delegates Already Allocated” as this better represents the progress through the race. Note that these numbers include estimates of the eventual results of multi-stage caucus processes which will be refined as the later stages occur. So, first of all, that final congressional district in Michigan went for Santorum, so 2 more delegates for Santorum, making the final Michigan numbers 15 for Romney and 15 for Santorum, which was an exact match for my Scenario 2 in the post gaming out Arizona and Michigan. Secondly, we have Wyoming. It is very important with Wyoming (as with similar caucuses previously) to point out that no national delegates were actually allocated in Wyoming yet. There was a straw poll, which doesn’t matter, and local delegates were selected for the next stage in the caucus process that will eventually select delegates to the national conventions. Ideally, each local delegate who was selected would be polled for their presidential preferences, and that would be used to predict results at the next level, etc. But that would be a ton of work, and nobody is doing that. Our source for these things, The Green Papers is doing the estimating by using the straw poll numbers for all candidates who got more than 5%. These estimates WILL change (perhaps significantly!) when the later caucus stages happen, but for now that is what we have. Green Papers estimates Wyoming as: Romney 10, Santorum 8, Paul 6, Gingrich 2. And so when we pump this into the grinder and look at the “% of remaining needed to win” charts that I argue are the best way to see what is really happening… we find out… EVERYBODY LOSES. All four candidates in the race got delegates since my last update yesterday, but none of them got the delegates at the rate they would need to in order to get to 1144. Romney of course came closest. He got 10 out of 28 delegates today, or 35.7% of the delegates. But he needed to get 49.3% of the delegates (at least 14 of today’s 28) to actually be on pace to get to 1144. Romney is still way ahead though. Right now he needs 49.5% of the remaining delegates to win. Santorum is in second needing 55.2% of the remaining delegates to win. We are still fundamentally in a state where if Romney continues the way he has been, he will get to 1144, but very very late in the process… but with the possibility of the non-Romney’s blocking him still real. The non-Romney’s only have to do a little better than they have been to block Romney. One of the non-Romney’s actually catching up and winning gets to be an increasingly remote possibility as we move on though. Still not impossible. Just getting very hard. You would basically need consolidation around one non-Romney at the same time that Romney himself lost a significant amount of support. Chart from the Abulsme.com 2012 Republican Delegate Count Graphs page. When a candidate gets down to 0%, they have cinched the nomination. If they get up past 100%, they have been mathematically eliminated. The chart above is now the chart using the “% of delegates already allocated” as the x-axis rather than the date, because I think it more clearly shows what is actually going on at this point. Romney picks up all 29 delegates from Arizona. As of this update the best estimates at The Green Papers gives Romney 15 delegates from Michigan, Santorum 13, and 2 delegates still too close to call. Those of you who read my Gaming Out Arizona and Michigan post will recognize Scenario 2, which at the time I said was the most likely result, and indeed, that is what happened. If the last outstanding congressional district ends up going for Santorum, then it will actually match Scenario 2 exactly. Regardless though, the general outlines of Scenario 2 are met, and I’ll just quote my analysis from that earlier post:
Attention now moves to first Wyoming and Washington (although they are not getting much attention) and then of course Super Tuesday. Super Tuesday is not as super as it was in 2008, but there are still a big chunk of delegates at stake, and after it is over, we should have a better view of what the rest of the race looks like, and specifically if Romney is able to break out and start closing on 1144, or if the non-Romney’s still have a real shot at blocking him from getting there. (Let alone actually catching up and winning, which is a much further stretch.) I was asked a few hours ago about the possibilities of nobody getting enough delegates to wrap up the Republican nomination and somebody who isn’t running today jumping in. I answered by email, but thought it was worth posting as well. Also, I’d be remiss to not point out that Ivan and I also discussed how the next bit of the race might play out on this week’s Curmudgeon’s Corner, so take a listen to that too. Anyway, my answer:
OK, we have a couple states coming up in the next week, and a lot has been made about what happens if Santorum wins, etc. Now, a lot of that analysis is based on the momentum Santorum would gain going into Super Tuesday, but lets just look at the delegates for a minute, and see what would happen under various scenarios. First thing to remember for all this is the way the delegates are allocated. Arizona is winner takes all with 29 delegates at stake. Michigan is more complicated. 30 delegates are at stake. A grand total of TWO delegates are determined proportionately based on the state wide primary results. (So these will almost certainly just be 1 each to the top two candidates unless it is a blow out.) The other 28 delegates are allocated winner take all by congressional district. Michigan has 12 congressional districts, each district determines 2 delegates. So in Michigan, the delegate result depends quite a bit on how candidate’s support is distributed geographically, the overall statewide numbers will not tell the whole picture. Second item before we start looking at scenarios… where we are in the polls right now:
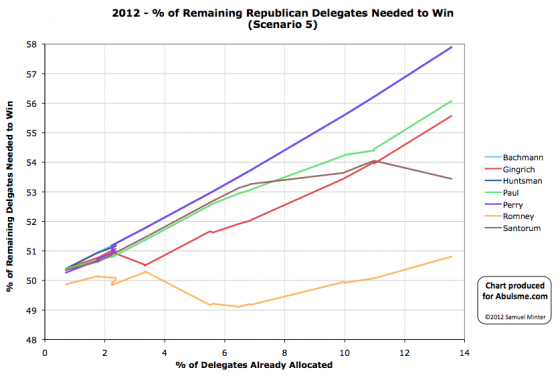
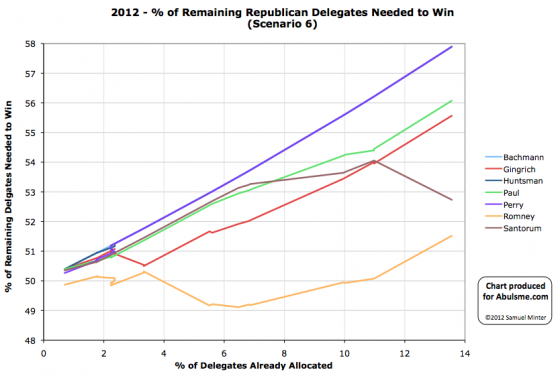
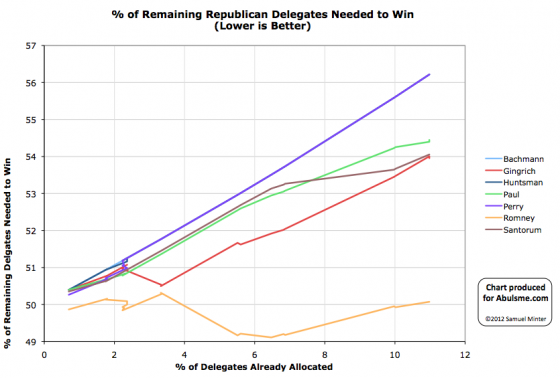
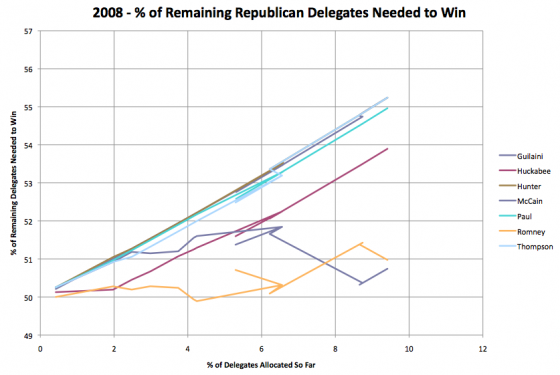
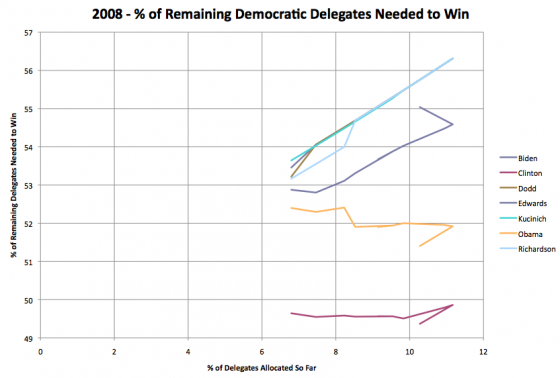
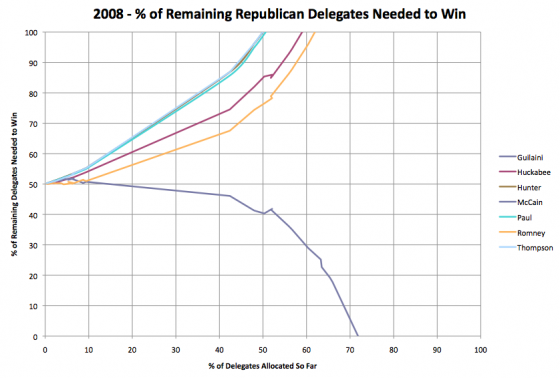
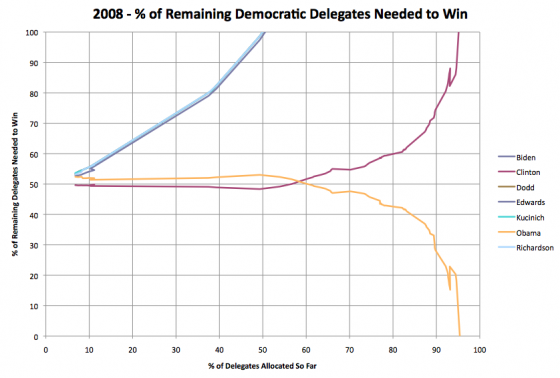
And of course the starting point for all this is the current state (as of February 25th) on my Delegate Count page. (Sources and methodology and such explained there.) OK, so now looking at a few possibilities, in order from best for Romney, to best for Santorum. Note that the actual results will not likely exactly match any of these scenarios, but rather these give several types of results that characterize the kinds of outcomes that might happen. Scenario 1 First up, current polling, plus Romney’s support in Michigan is uniform across the whole state, so he wins all of the congressional districts too. Result in this scenario, Romney gets 58 delegates for the night, Santorum gets 1. OK, obviously Romney is the big winner here. He moves down (toward the nomination) significantly. He only needs about 48.6% of the remaining delegates to win. The closest competition would still be Gingrich, although Santorum would only be one delegate behind. Gingrich and Santorum would both need about 55.6% of the remaining delegates to catch up and win. Still not an impossible number if Romney completely collapses, or even if one of them drops out and the other gets all their support (plus a bit). And with some wins in big winner take all states, it could be done. But 55.6% is starting to be a big number. And it is a LOT more than the 14.5% of the delegates these two would have gotten so far. The “catch up and win” possibility gets much further away with this result. And even the “Stop Romney from winning” possibility gets further away, as Romney continues to pile up the delegates. Scenario 2 OK, now lets take current polling, but pretend the results in the various districts is such that the districts divide in about the same way as the popular vote goes between the two top candidates. Essentially in this scenario, Romney and Santorum split Michigan with 15 delegates each. (And Romney still wins Arizona.) So for the night, Romney gets 44 delegates and Santorum gets 15. Please note, and this is important: You get essentially the same result here regardless of who actually wins the state popular vote! As long as it is close, and the candidates essentially split the congressional districts, you get this sort of result. Depending on how many CDs are actually won by each candidate, you move the numbers a little, but the essential result is the same. With this kind of result, the state popular vote bragging rights matter ONLY to the media narrative that will build (and therefore any effects on later contests)… but they do NOT matter to the actual delegate numbers. Romney is still the only winner here. It is clearly not as big a win, but Romney still makes his “% of remaining delegates needed to win” go DOWN, and go down to under 50%. Santorum, despite getting some delegates, is still in a worse position than when he started the night. Before he needed 54.1% of the remaining delegates to catch up and win the nomination, now he needs 54.9%. Santorum does pull ahead of Gingrich though, and put himself clearly into second place. But the three non-Romney’s in this situation are still all heading upward (toward being mathematically eliminated), none of them has started to actually move down toward catching up and winning. Romney in this situation does improve a bit here, but also still isn’t breaking out downward yet. He is still hovering in the zone where his opponents (collectively) only have to do a little bit better to block him from getting the nomination. Note that they do have to do better though. Paul, Gingrich and Santorum could keep getting delegates at the same rate, and Romney would still get the nomination, it would just take awhile. Scenario 3 OK, now lets say Santorum reverses the poll momentum and ends up winning the popular vote in Michigan. As mentioned above, if his support is “lumpy” around the state, and both Romney and Santorum end up getting significant numbers of delegates, then we just have Scenario 2, plus or minus a few delegates depending on exactly how many congressional districts each candidate wins. So for this scenario, lets pretend that Santorum actually wins with his support uniformly distributed across the state and Romney wins no congressional districts. Then we have Santorum getting 29 of the state’s delegates, and Romney getting only 1. So for the night that would make it 30 delegates for Romney, 29 for Santorum. Note that despite Santorum “winning” Michigan, Romney still gets more delegates for the night because of Arizona and the 1 proportional Michigan delegate. Romney is STILL the only actual winner in this situation… although just barely. He goes from needing 50.07% of the remaining delegates to win, to needing 50.05% of the remaining delegates to win. Essentially he is flat. Santorum, despite winning Michigan in a pretty convincing way, is still worse off than coming into the day. Going in he needed 54.1% of the remaining delegates to win, now he needs 54.2% of the remaining delegates. But essentially this is flat. Once again though, Santorum does pull head of Gingrich (by an even bigger margin than Scenario 2 of course) and plants himself solidly in second place. (Although still quite a long ways back from Romney). This scenario does however keep Romney hovering around the 50% of remaining delegates needed to win line, while having gotten just 50% of the delegates so far. This is the path to getting 1144 at the last possible moment before the convention. Obviously Romney would like to do a bit better than that as just the slightest misstep at this rate of delegate collection could cause him to end up just short of the magic number. Scenario 4 OK, now lets imagine that Santorum comes back from behind unexpectedly in Arizona, but at the same time Romney consolidates Michigan and wins there in every congressional district. Since this involves momentum going in different directions in different states, this seems unlikely, but lets include it for completeness. In this scenario EVERYBODY LOSES. Nobody gets enough delegates to actually be on a pace to win the nomination. Santorum does pull ahead of Gingrich, so there is that. And he does win the night. But just barely. And not by quite enough to actually be catching up fast enough to get to 1144. Scenario 5 Romney and Santorum split Michigan (either might win the popular vote, but they split the congressional districts), but Santorum does a come from behind victory in Arizona. So for the night we get 44 delegates for Santorum and 15 for Romney. We now for the first time have a situation where Santorum actually clearly wins the night. His “% of remaining delegates needed to win” actually drops… from 54.1% down to 53.4% of the remaining delegates. Meanwhile, Romney gets knocked backwards. Rather than needing just 50.1% of the remaining delegates he now needs 50.8%. Now, Romney is still in the lead here, and by a decent margin, but with a result like this for the first time since Gingrich won South Carolina, someone would actually be improving their position in the race versus Romney. Scenario 6 Once again we imagine the Santorum upset in Arizona, but this time combine it with the widespread win in all Michigan congressional districts. This is Santorum’s dream scenario. Here he gets 58 delegates for the night compared to only 1 for Romney. Here Santorum wins the night decisively. After a night like this, Romney would still be ahead, but would be back below 50% of the delegates allocated so far and he would actually be moving quickly away from the nomination rather than closer to it, and Santorum would be gaining at an alarming rate. Of course, winning a winner take all state, plus almost all of the delegates from another state will do that. Romney would be in deep trouble in this scenario and while sell behind, Santorum would now be nipping at his heels. Conclusion All the hype is about Michigan because it is close. And because a Santorum win there will get everybody excited about “momentum”. And indeed, that kind of victory followed by the media frenzy that followed, could indeed move poll numbers in the subsequent states, most critically the Super Tuesday states… But in terms of where the delegate race stands today, Michigan is not enough. For Santorum to actually get a substantive victory on Tuesday, not just one that he hopes will lead to bigger victories down the line, then he HAS to win Arizona too. The only situations where Santorum is actually on a pace to win the nomination himself are ones where he wins Arizona as well as a substantial number of the congressional districts in Michigan. Even with a widespread win in Michigan where Santorum wins all 14 congressional districts, if he loses Arizona, then Romney still gets more delegates for the night, and Santorum isn’t on a pace to catch up. Of all the scenarios above, my best guess is that we will be closest to Scenario 2 than anything else. Which would mean that regardless of the state wide popular vote winner, Santorum and Romney split the Michigan delegates, and Romney wins Arizona. Which is a win for Romney in the delegate race, and by a decent margin. Of course, if Santorum does win Michigan’s overall state popular vote, expect all the talk to be about that and the momentum he gets out of it. We won’t hear much about how actually Romney is closer to the nomination than he was before, even despite the Michigan result. If Santorum does pull off a surprise in Arizona though… well, that is a completely different story. Edit 2012 Feb 26 16:02 UTC for minor wording clarification. Edit 2012 Fev 29 14L57 UTC to fix typo. OK, beating a dead horse a bit, but I finally made graphs, so one more look. (Previous comments on this here and here, 2012 Delegate race here, 2008 Delegate races here.) The key is that while if you look at the calendar, and say where were things on February 22nd 2008… On the Republican side you’d see that McCain had for all intents and purposes wrapped things up. On that date 60.4% of the delegates had already been allocated. McCain had 63.9% of the delegates, while his closest competition (Romney) only had 19.9%. In order to get to his magic number McCain only needed 29.0% of the remaining delegates. For Romney to catch up, he would have needed 96.0% of the remaining delegates. Romney was just days away from being mathematically eliminated (that would happen on February 26th). Meanwhile on the Democratic side, 64.1% of the delegates had been allocated. Obama had 50.8% of the delegates to Clinton’s 48.2%. To win Obama needed 48.6% of the remaining delegates, Clinton needed 53.3% of the remaining delegates. Clearly the Democratic race was still close (although from here on out, Obama just increased his lead, Clinton never really made up any ground except when Florida’s delegates were reinstated near the end). But the Republican race was over. You’d then compare to Romney today and build a narrative of Romney not being able to close the deal, of wondering why he can’t just wrap this up, after all McCain had wrapped this up by this time, right? But this year, on the Republican side, as of today we only have 11.0% of the delegates allocated (and that counts estimates from caucus states, it is less without that). So how does this year look and compare with 2008 when you look at it by % of delegates allocated instead of by date? Well, here is the “% of remaining needed to win” chart with % of delegates allocated on the horizontal axis instead of date: You can see clearly that Romney is well ahead of his competition, and while he isn’t yet diving down toward zero (indicating he is heading quickly to the nomination) he is holding steady, while everybody else is trending upward toward being eliminated. Gingrich and Santorum are neck and neck for 2nd place and both need about 54% of the remaining delegates to catch up and win. 54% is not an impossible number in a two man race. It is a lot better than either has done so far, but if one of them stops getting delegates and the other picks up all of their support, it is in the realm of the possible. But it would be a significant change from what has happened so far. Note, for instance, that even when Santorum won states, he didn’t win by a big enough margin to actually be catching up. His line still went up. Now what did this look like in 2008? The closest comparison for the Republicans would be as of February 5th… the day before Super Tuesday. At that point 9.4% of the delegates had been allocated. What do we see here? A very different pattern. McCain had only recently (in terms of % of delegates) pulled ahead, but Romney was still close… and gaining! We had a two person race where both were within shooting distance of each other, and neither were yet heading either rapidly up or down on this chart, indicating that they were either on the way to elimination or to the nomination. In 2008 at this point, things really were still close. The very next day, on SuperTuesday, McCain would essentially run away with it, and that would be that. But comparing comparable points in the delegate race, Romney actually has a much bigger lead and advantage on his competition than McCain had in 2008. One more comparison though… The Democrats in 2008. The comparable date there is also February 5th, the day before Super Tuesday. 10.3% of the delegates had been allocated on that side on that day. There are a few oddities in the data from back then… my sources had allocated some delegates, then backtracked, causing the little bit of backtracking on the chart, and when my tracking started on January 1st almost 7% of the delegates were already in place because of Super Delegates who had declared their preferences)… but you can still see the trends. So, most important thing you see here… Clinton was still in the lead! Obama didn’t catch her in delegates until significantly later. But it is clear that both Obama and Clinton are still in contention. Their lines are basically horizontal, and they were pretty close to each other. Neither of them had started moving toward the nomination really, but neither was showing a pattern of getting eliminated either… like Edwards and all the rest were. In this year’s race, all of Romney’s competition are in worse positions than McCain’s competition was at the same time. It is not yet too late for one of them to mount a push and catch up… but it is getting close. Even with the vastly stretched out schedule, there is still a big enough chunk of states coming up on Super Tuesday that we’ll probably see that day be the do or die day for all the not-Romneys. At least for actually catching up and winning. Blocking Romney from 1144 is a lot easier task than actually winning at this point. We’ll know a lot more about how possible (or not) that scenario is after Super Tuesday as well. OK, long post, but finally, for reference, here are the two races in 2008 in full as they played out (rather than just looking at the first 12%). And here is this year’s Republicans at the same scale… Just a little ways left to go, huh? Chart from the Abulsme.com 2012 Republican Delegate Count Graphs page. When a candidate gets down to 0%, they have cinched the nomination. If they get up past 100%, they have been mathematically eliminated. A small change today. Maine revised its preference poll numbers to add some precincts whose results got lost in a spam folder (really). The result from this is that the delegate estimates give one less delegate to Paul, and one more to Gingrich. So Gingrich wins the day today. But Maine’s results will change again. First, there are still more precincts who haven’t done their votes yet (or are doing them today). So there may well be more straw poll Maine updates to come. More importantly though, these are only estimates based on the straw polls, in fact, no delegates have been selected at all yet. In fact, delegates to the state convention were selected, who in turn will select delegates to the national convention. That won’t happen until MAY. Estimates of what will happen in May really should be based on asking each of the delegates to the next level of the process who they intend to support. But nobody seems to be doing that sort of things, so instead we (well, Green Papers) base estimates on the straw polls. But the real results may be very different. You may have someone like Paul out organizing and getting an outsized number of delegates compared to the star poll (the Paul campaign claims they are on track to do this), or, you may have the nominee being a done deal by May, and get all delegates allocated to the obvious winner, regardless of what happened in February. Anyway, with the best estimate we have as of when I pulled the numbers a couple hours ago, today Gingrich gains a delegate and Paul loses one. Edit 2012 Feb 18 23:10 – Minor wording change |
||
