- 14:51:45 Poll Added: PPP in SC from 2015-02-12 to 2015-02-15 – Clinton 42% to Bush 49% http://t.co/oodUxgZLkT
- 14:51:53 Clinton vs Bush state category change: SC has moved from Solid Bush to Strong Bush http://t.co/oodUxgZLkT
- 14:53:59 Poll Added: PPP in SC from 2015-02-12 to 2015-02-15 – Biden 36% to Bush 53% http://t.co/p8hDE48L2A
- 14:56:06 Poll Added: PPP in SC from 2015-02-12 to 2015-02-15 – Warren 34% to Bush 50% http://t.co/ikCcOZEfAR
- 14:57:58 Poll Added: PPP in SC from 2015-02-12 to 2015-02-15 – Clinton 41% to Carson 48% http://t.co/uxD7lJv6Zj
- 15:01:02 Poll Added: PPP in SC from 2015-02-12 to 2015-02-15 – Clinton 41% to Christie 43% http://t.co/yzuPcTdlT3
- 15:03:13 Poll Added: PPP in SC from 2015-02-12 to 2015-02-15 – Clinton 43% to Cruz 46% http://t.co/tVh1zsrlJt
- 15:04:45 Poll Added: PPP in SC from 2015-02-12 to 2015-02-15 – Clinton 43% to Graham 45% http://t.co/xn7sYdrYAO
- 15:06:23 Poll Added: PPP in SC from 2015-02-12 to 2015-02-15 – Clinton 41% to Huckabee 49% http://t.co/Vp626LviPz
- 15:08:03 Poll Added: PPP in SC from 2015-02-12 to 2015-02-15 – Clinton 43% to Paul 45% http://t.co/ZPJ3CfWPOg
- 15:10:08 Poll Added: PPP in SC from 2015-02-12 to 2015-02-15 – Clinton 43% to Perry 48% http://t.co/23NBrfdXpC
- 15:11:40 Poll Added: PPP in SC from 2015-02-12 to 2015-02-15 – Clinton 42% to Walker 46% http://t.co/hPUIEQvf3L
- 15:11:49 Clinton vs Walker state category change: SC has moved from Solid Walker to Strong Walker http://t.co/hPUIEQvf3L
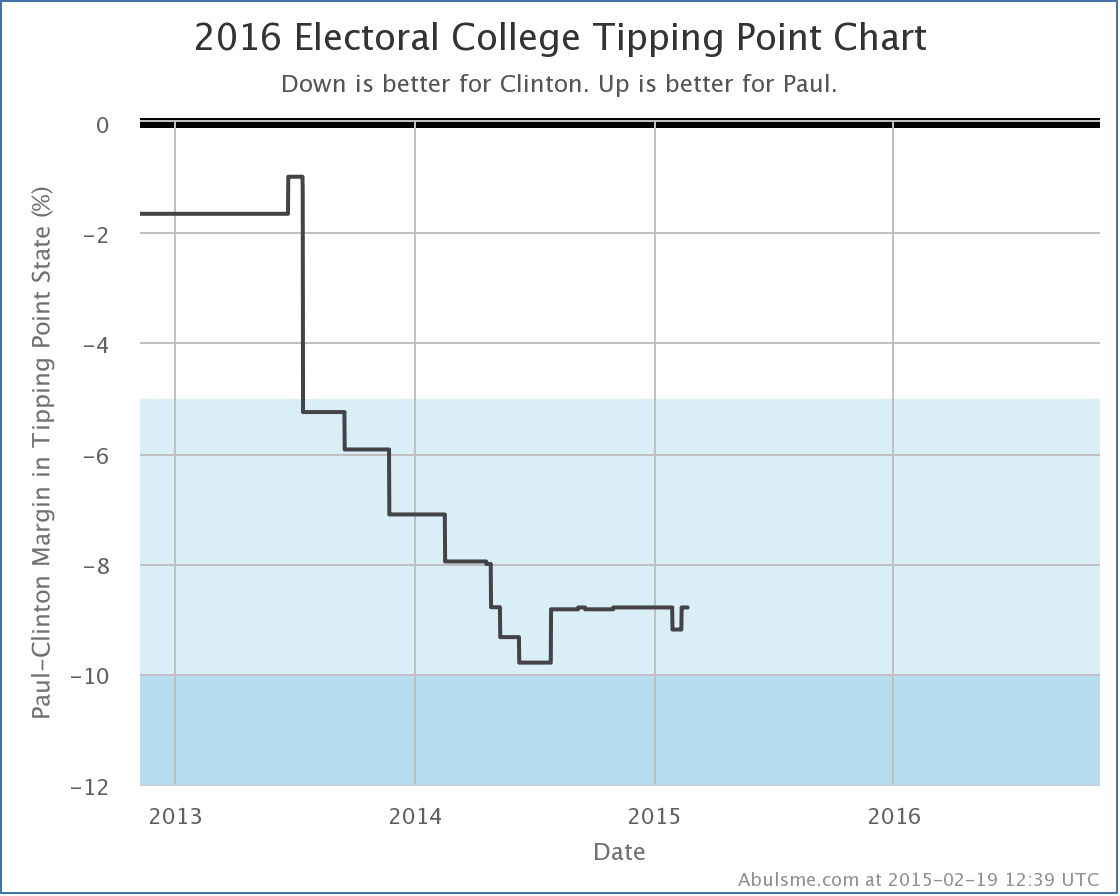
Another day and yet more polls moving things around. So lets go… As usual click on any of the charts for more detail. Clinton vs Paul First of all, the latest batch of polls has Clinton vs Paul once again the “best polled” candidate combination, pushing Clinton vs Bush out of that spot. Keep in mind this does NOT mean they are the frontrunners in their respective parties, just that there have been more polls in the closest states than there have been for other candidate pairs. This means the default view on election2016.abulsme.com is now Clinton vs Paul. But the gap between them on my polling quality metric is very small, so don’t be surprised if they switch places again. Next, a new poll in Virginia improved Paul’s standing slightly. No category change, Virginia is still a “Strong Clinton” state based on current polling against Paul. But the tipping point was moved:
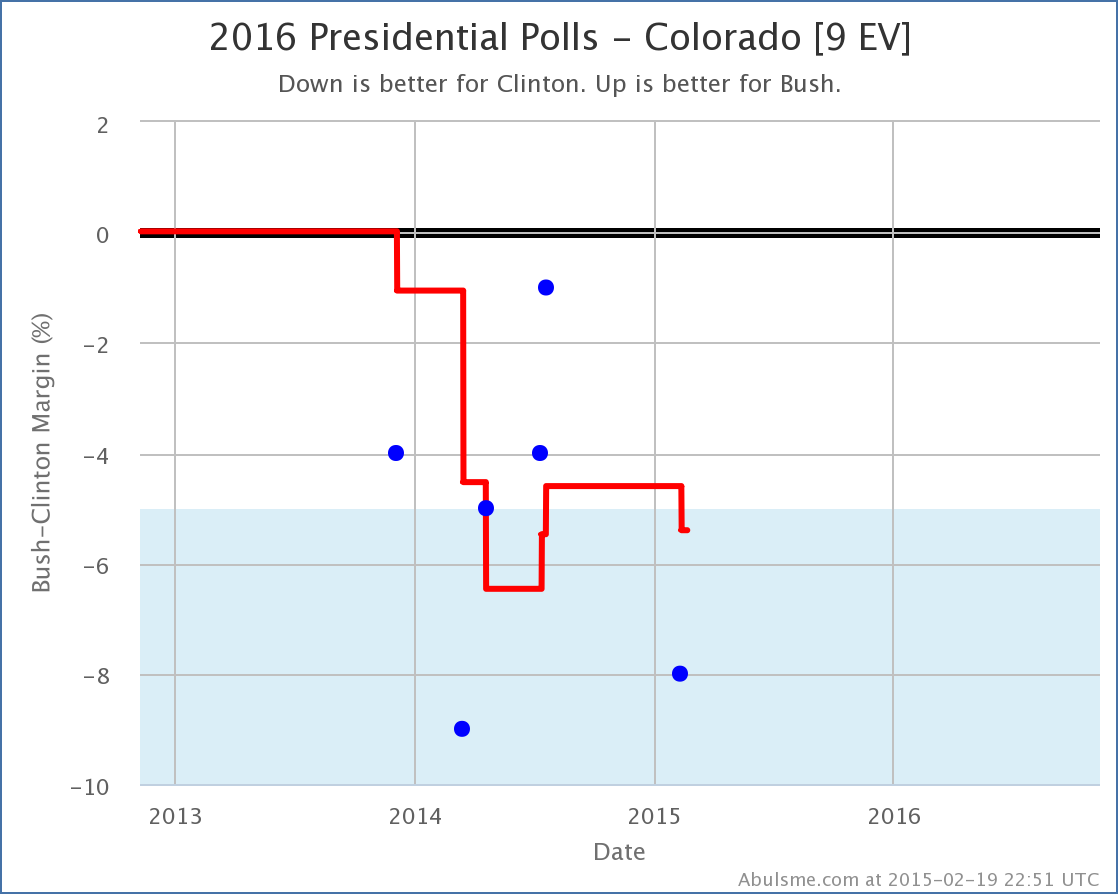
The tipping point moves from Clinton by 9.2% in Ohio, to Clinton by 8.8% in Virginia. This represents how big a uniform move in the polls across ALL states would have to happen to give Paul the edge in the Electoral college. This is basically because at the moment, to win, Paul would have to flip North Carolina (0.2% Clinton lead), Nevada (2.8% Clinton lead), Iowa (4.2% Clinton lead), New Hampshire (4.9% Clinton lead), Minnesota (7.0% Clinton lead), Michigan (8.6% Clinton lead), and Virginia (8.8% Clinton lead). [This is the list of states that are closest that would need to be flipped, there are of course other combinations that would do the trick if Paul flipped states with even bigger Clinton leads.] Since Virginia would be the state that would put Paul over the top, it is the tipping point state and the margin there is the amount everything would have to move to make this scenario happen. Clinton vs Bush This combination sees relevant changes in Colorado, Iowa and Virginia.
In Colorado, Clinton’s lead grows to over 5%, so this state moves out of contention and into “Strong Clinton”. (For now anyway, but do I really need to repeat just how early things are, and how relatively sparse polling still is too?)
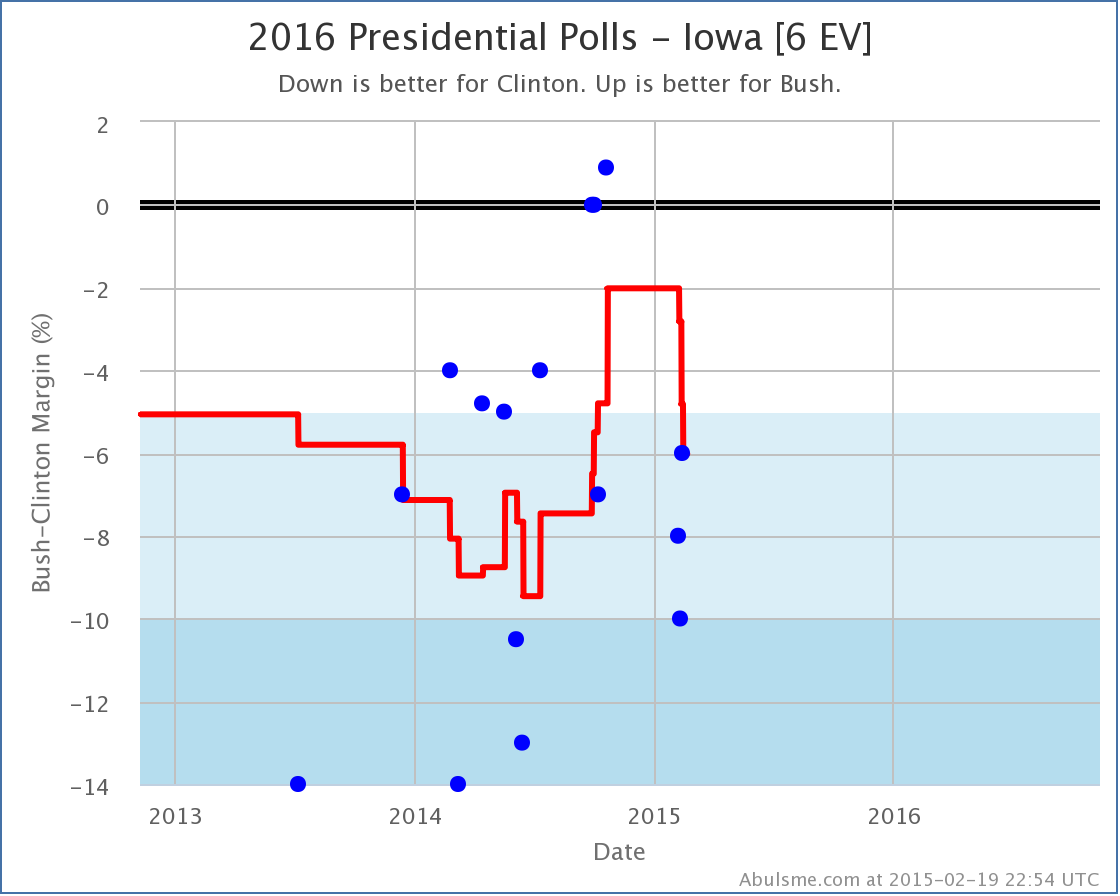
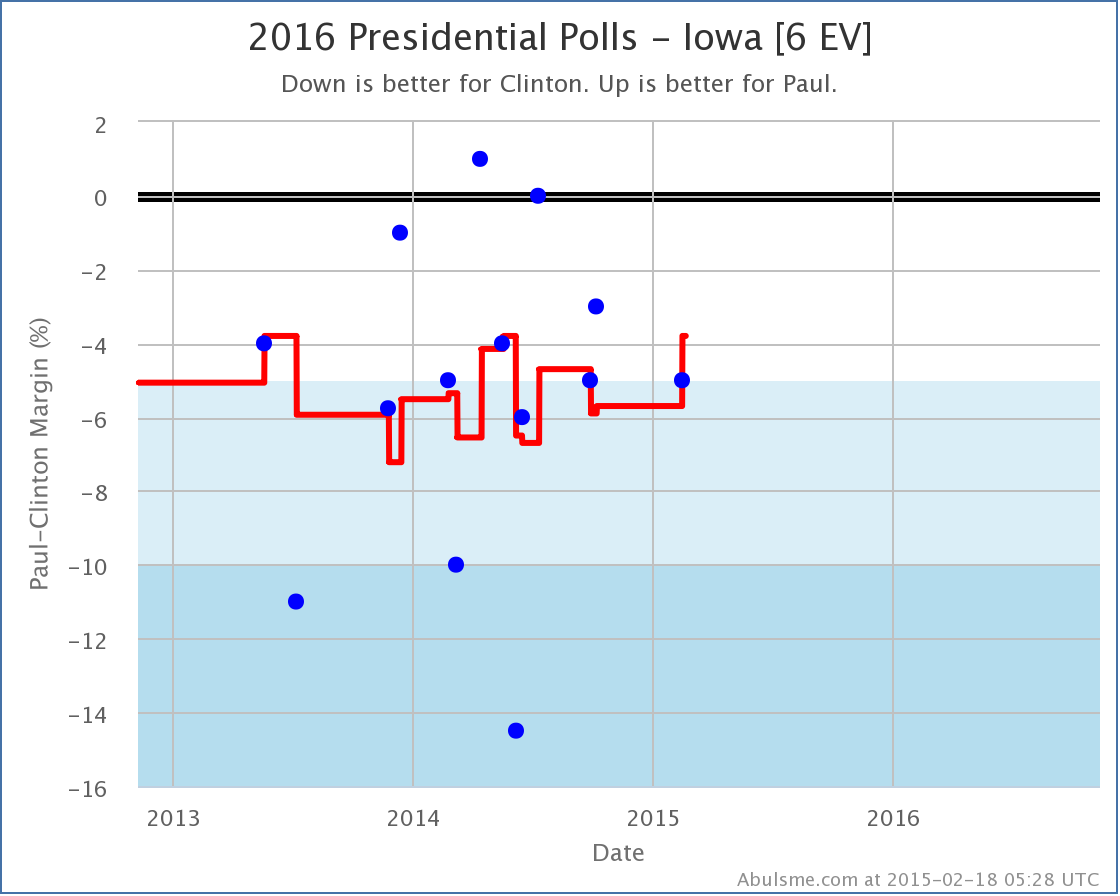
Same thing in Iowa. Although in Iowa, it looks like we might have a situation where the polling is returning to “normal” after a couple of outlier polls, while you could argue that in Colorado, the “true” state might just be bouncing around the 5% boundary line. In either case, we shouldn’t be too surprised if the states get closer again. With both of these states moving out of the “Weak Clinton” category, Bush’s overall best case against Clinton deteriorates a bit:
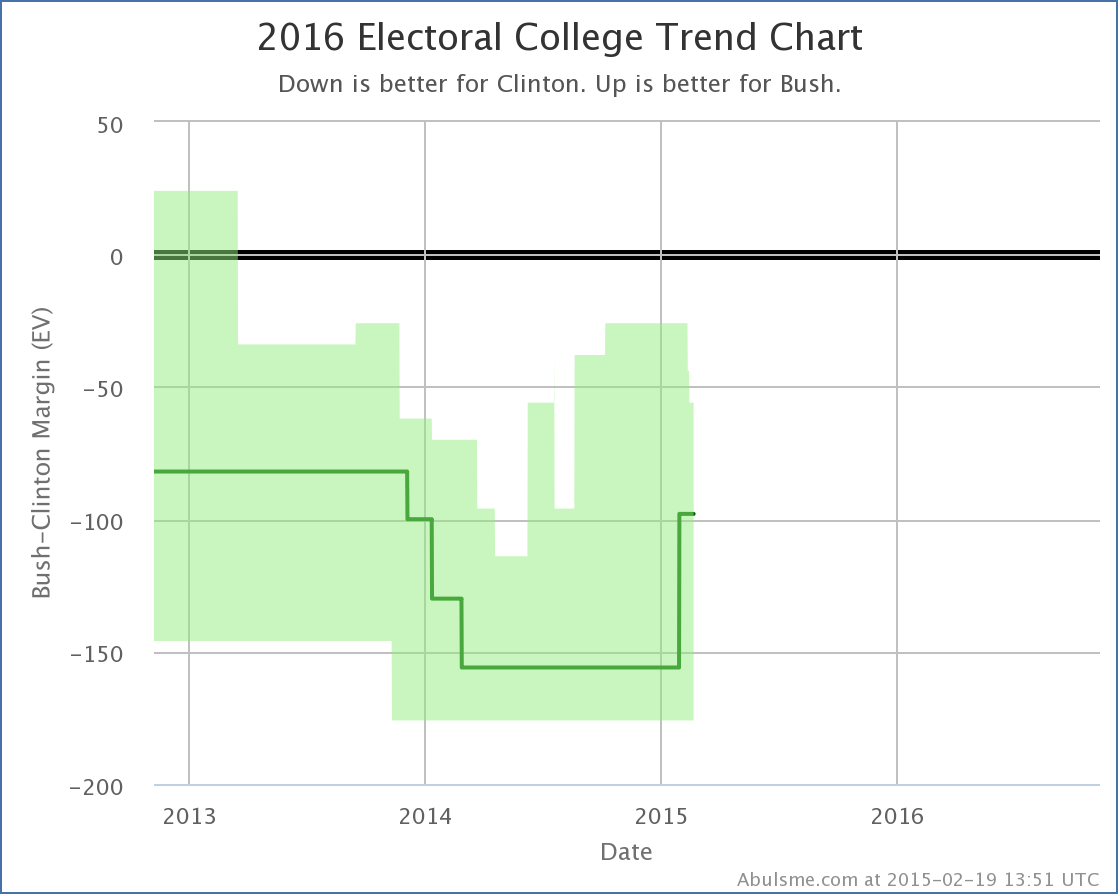
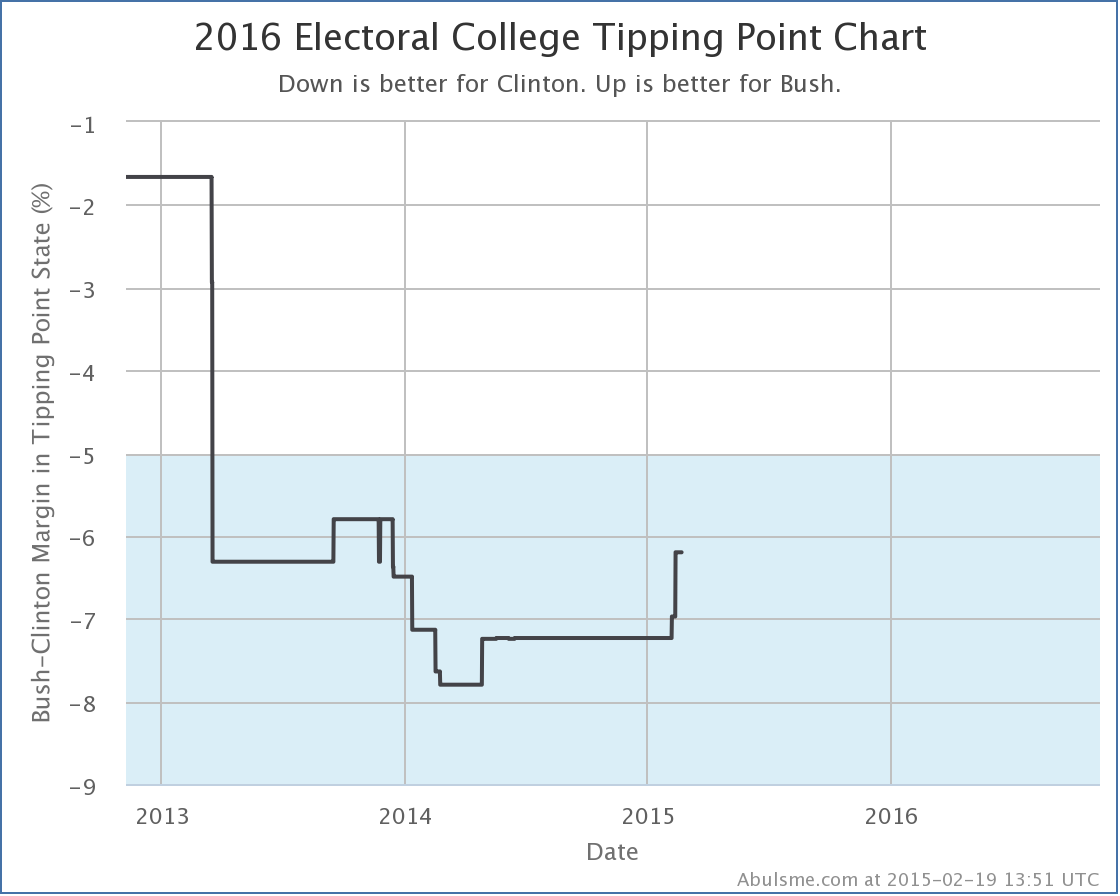
With this (plus another Iowa poll that was added yesterday) Bush’s best case against Clinton moves from losing by 26 electoral votes to losing by 56 electoral votes. But while things haven’t been moving his way in Colorado or Iowa, in Virginia the latest polls have actually been moving toward Bush. No category changes… Virginia moved from a 7.0% Clinton lead to a 6.2% Clinton lead. This was enough to move the tipping point in Bush’s direction:
Virginia was the tipping point before this move, and it didn’t leapfrog any other states, so the tipping point stays in Virginia as it moves. So Bush’s best case is getting worse, but his overall position is getting better? Yes, basically. With current polling Iowa and Colorado now look like they aren’t competitive. So that is worse for Bush. But in order to win, Bush would have to flip a LOT of states, and the one he needs that he is furthest behind in is Virginia… but he is now not quite as far behind there. So if he is going to move all the states he needs to in order to win, he’s actually got a little bit less to move overall, even though Iowa and Colorado just moved a little further away. Other folks Just yesterday I was noting that Clinton vs Walker, despite being talked about quite a lot was still #18 on the ranking of best polled candidate combinations. With todays polls, he burst into the Top 10, debuting at #9, pushing Biden vs Rubio out of the Top 10. Still a bit away from the Top 5 combinations that I highlight here as having enough polling to say something useful about the race, but getting closer. If he continues to get lots of polling attention, while Clinton vs Ryan and Clinton vs Cruz and such do not, then he may get there sooner rather than later.
If changes keep coming in at this rate, I may need to move to a once a week update format, at least until we get a bit closer to the election. In any case, with today’s batch of new polls, we get a couple of status changes in Iowa, which in turn shift the national picture a bit. Click on any of the charts to see more detail. Clinton vs Paul
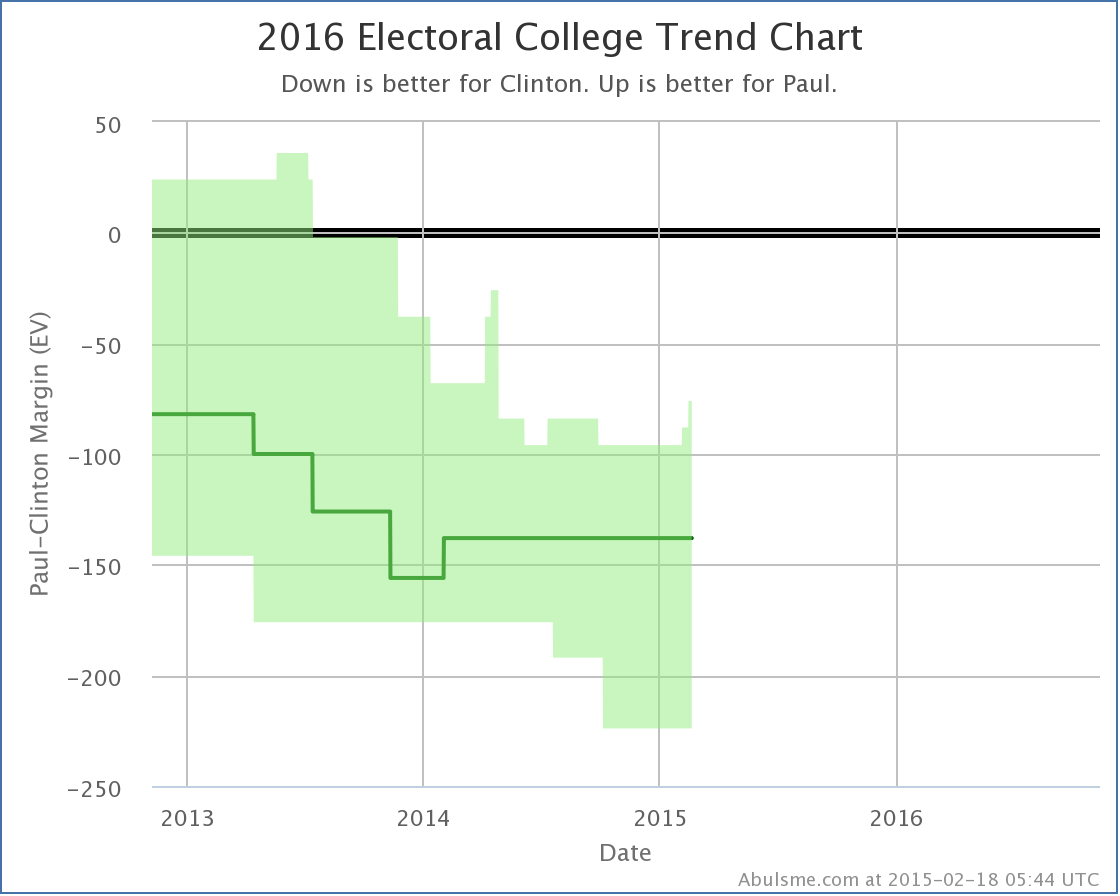
With today’s update, Iowa moves into the “Weak Clinton” zone, meaning that I consider it to be close enough to allow for the possibility of Paul winning. This improves Paul’s best case against Clinton to losing by 76 electoral votes. A couple of weeks ago, Paul’s best case was to lose by 96 electoral votes. So there does seem to be some movement here.
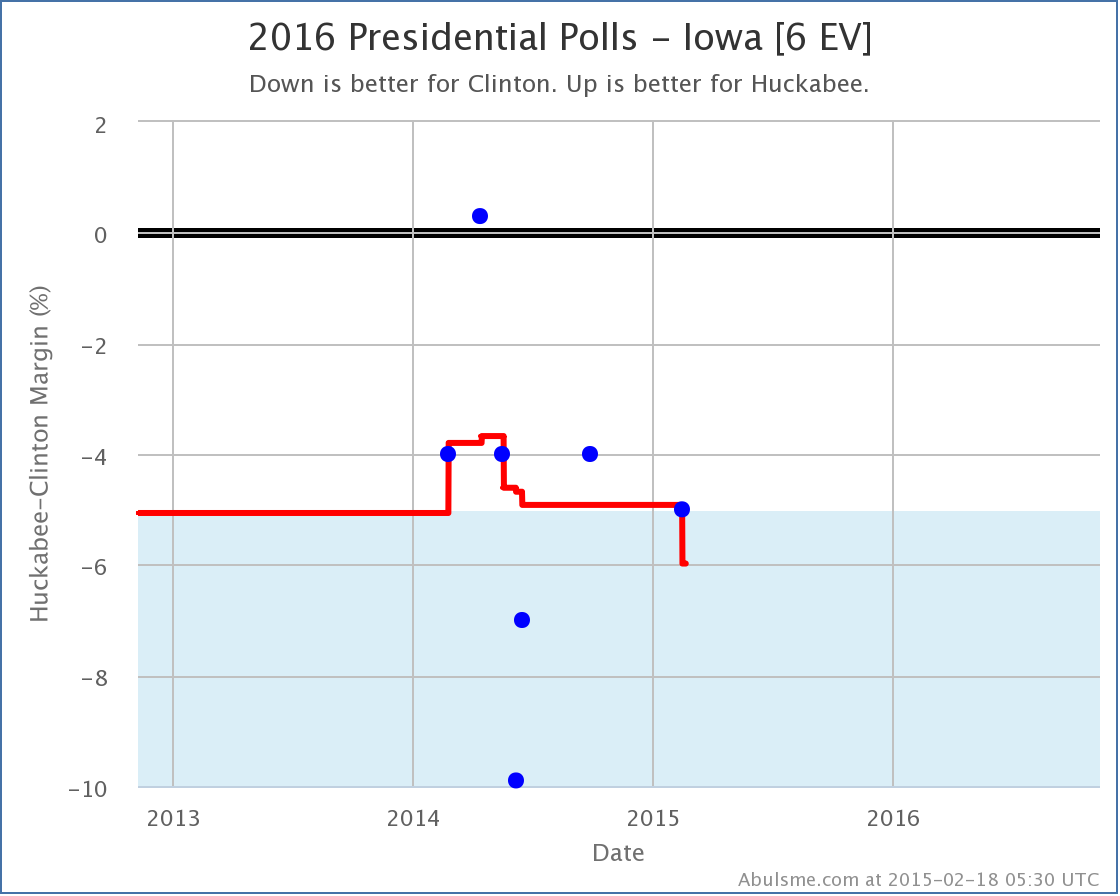
Looking at the actual polls in Iowa though, this trend is a little less clear. Iowa seems to have been bouncing back and forth over the 5% Clinton lead line for the last two years, spending more time with Clinton further ahead than 5%, but with occasional temporary movement toward Paul. Can we say that this time is a real “trend” rather than just another short term bump? Nope. Or maybe the average being further in Clinton’s direction is really just the result of a handful of outlier polls and really this “should” have been closer all along. Maybe. We’ll have to wait for more polls to see. For now though, my charts show movement toward Paul. Clinton vs Huckabee
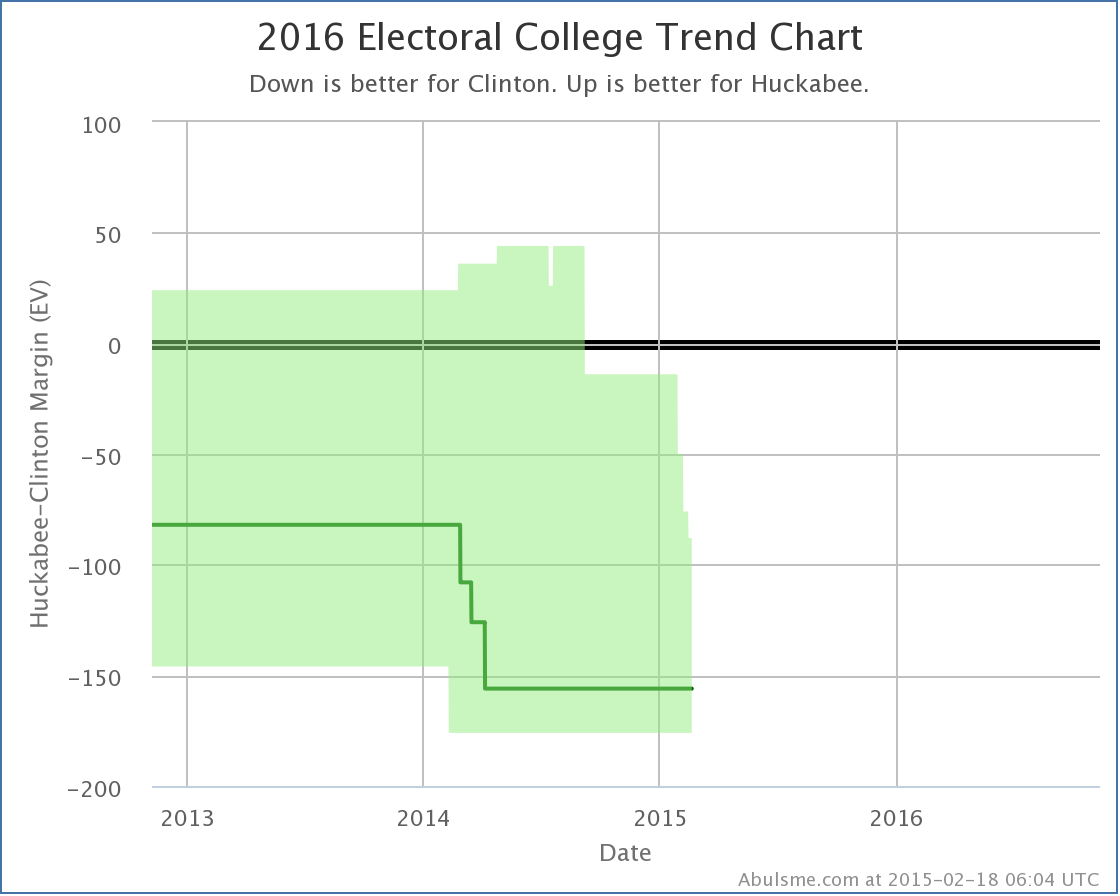
While Paul’s picture is improving, Huckabee’s continues to decline. In the latest update, Iowa slips out of Huckabee’s best case. Huckabee’s best case is now to lose to Clinton by 88 electoral votes. A month ago, his best case was losing by only 14 electoral votes, but states keep slipping away. Now, there has been a lot less Clinton vs Huckabee polling than there has been Clinton vs Paul polling, so there is a good chance a lot of this has simply been getting enough polling to get a good picture, rather than actual movement.
Specifically looking at the individual Iowa polls, you can see that we already did have five polls in Iowa, so the picture wasn’t dependent on previous election results, but there have only been 7 polls compared to the 14 for Clinton vs Paul. And there is quite a scatter between those polls (as there also was with Clinton vs Paul). The “movement” here is basically one extreme poll (the one showing Huckabee actually ahead in Iowa) falling out of the average, while another extreme point (the one showing Clinton ahead by 10%) remains in the average. As with the Paul situation, it is far from clear that this is a real trend as opposed to just a temporary bump in this direction, and the next polls could change the picture again. It is well within the realm of possibility that the “real situation” for both of these candidates is that Clinton is just about 5% ahead of them, and they will just bounce back and forth between my categories as new polls come in. Comparison
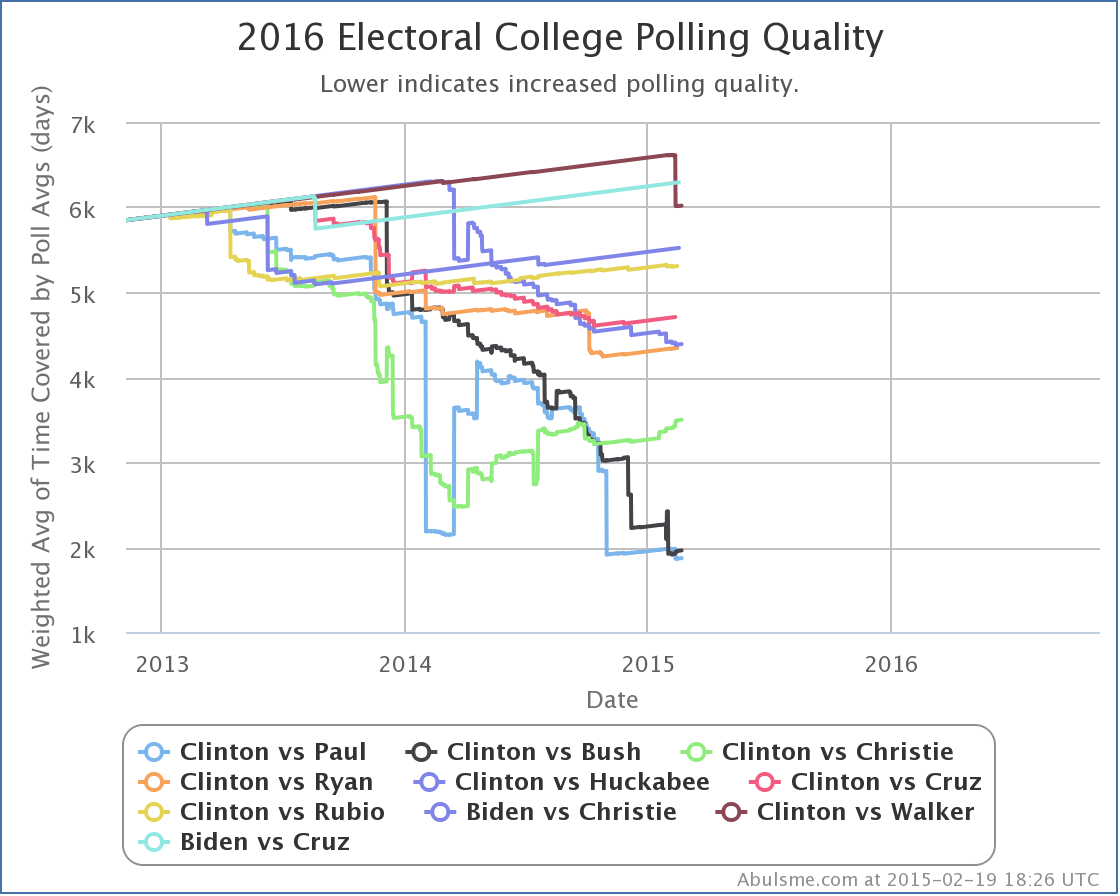
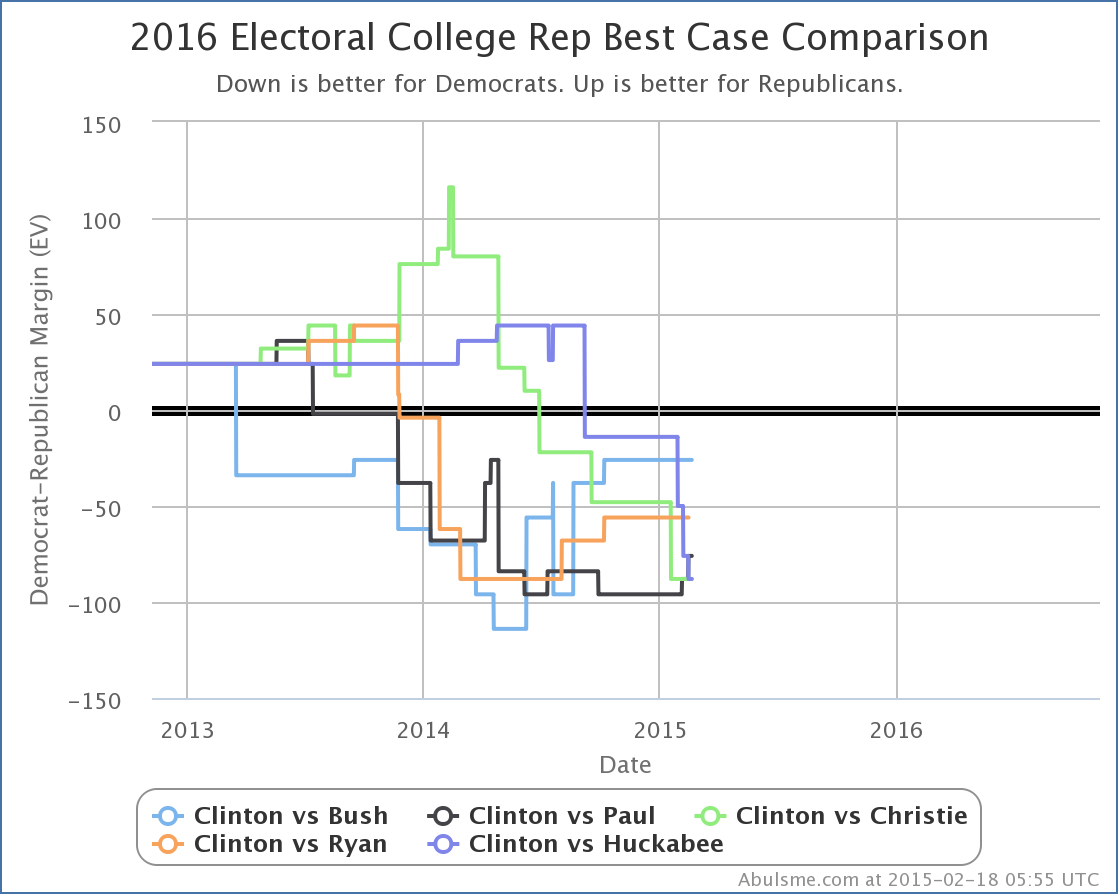
Since in both cases today, what has changed is the Republican best case, lets look at the trends there with the five best polled candidate combinations. Looking just since the 2014 elections, the movement on this specific metric has been Paul improving, Bush and Ryan flat, Christie and Huckabee declining. Other metrics show slightly different trends, but when all of the Republicans here are losing even when you give them all the close states, the first step is just to start making states close, and this chart measures that process. But wait, Ryan has said he isn’t running, and what about this Walker guy? A bunch of people have been talking about him lately. Well, I recently introduced this new chart on where the candidate combinations stand in my “polling quality” metric:
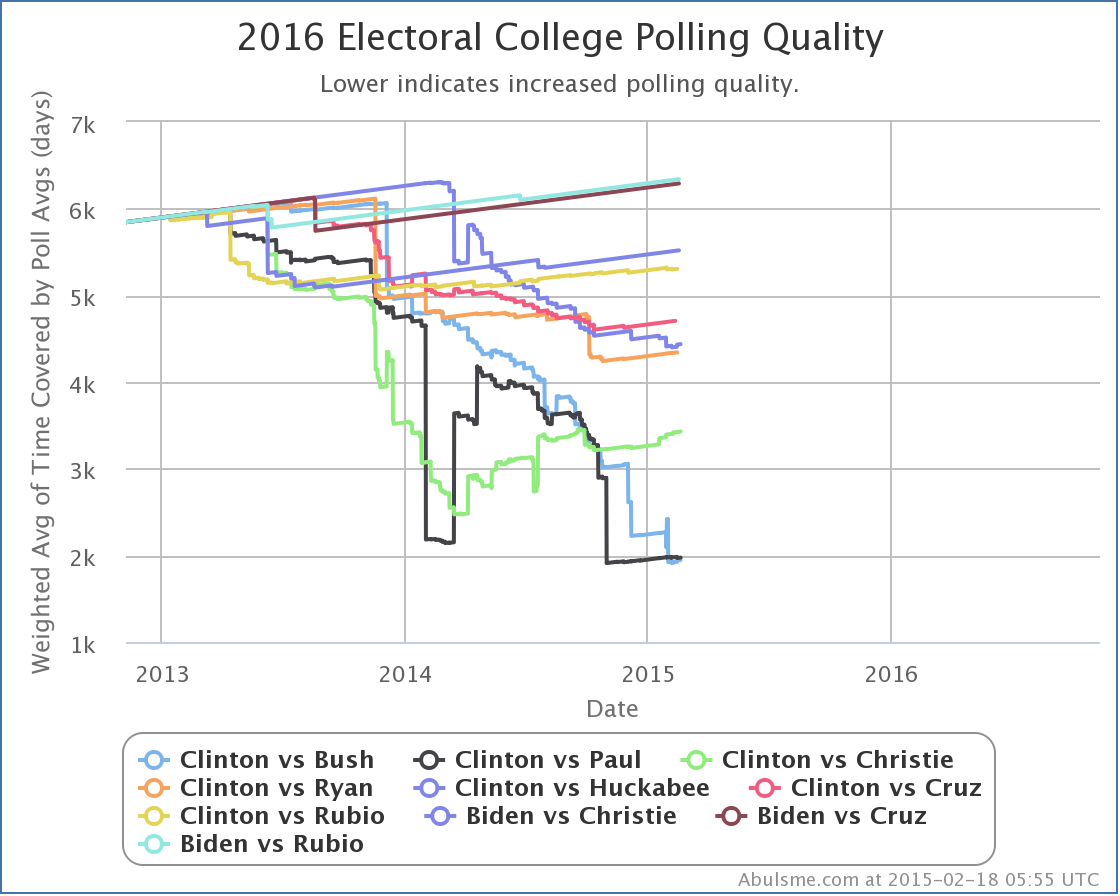
This shows the best TEN polled candidate combinations, not just the top five, so we can see if new candidate pairs are heading toward the top five. On this chart the lower the line, the better the polling quality. Poling quality is measured by the average amount of time used in the polling averages across the 56 jurisdictions that have electoral votes, weighted such that close states count a lot more than states where one candidates lead is large. A new poll may or may not improve polling quality, since if new poll makes a state less competitive than it was, the weight of that state also decreases in this metric. If there are no new polls for a candidate pair, the polling quality slowly gets worse as each day passes. Anyway, what do we see here? Well, if trends continue, looks like Clinton vs Huckabee may soon pass Clinton vs Ryan, and Clinton vs Bush and Paul are very close to each other so easily could flip back and forth, but Clinton vs Cruz hasn’t shown any signs lately of much life. Nor any of the others in the 6-10 zone. So we may not get any new combinations in the top five for a little while yet. How about Clinton vs Walker? Oh, yeah. that combination is still way out at #18 on this ranking. He stands at about 6616 on this metric, compared to 6340 for the worst of the top ten shown in the chart above and 4437 for the worst of the top five. We need a lot more state level polls of that combination before we have enough polls to meaningfully compare that scenario to the five we’re showing in the analysis here.
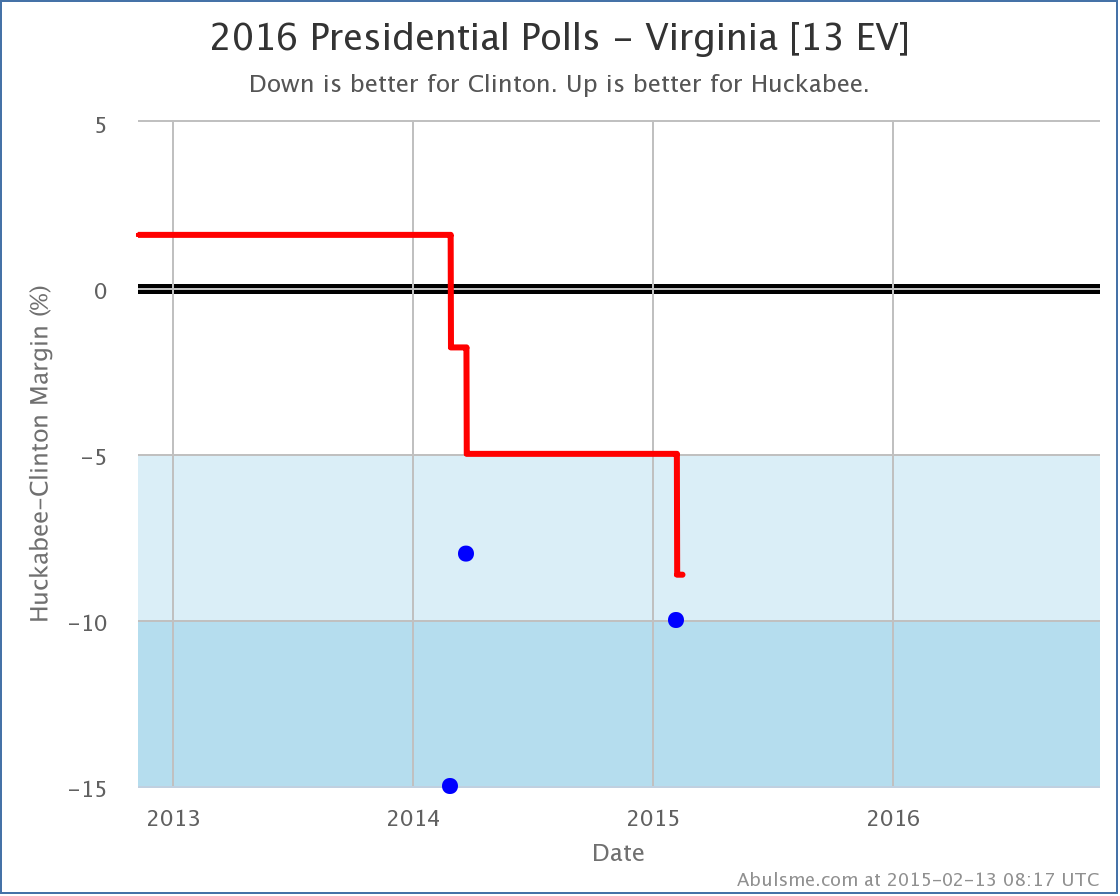
We are 634.6 days from the first polls closing as I write this message. But yet here I am with the fourth of these updates in a two week period. I honestly didn’t expect the polling to be picking up quite this fast. But it seems to be. So be it. Please keep in mind that everything here describes where things are now, and how things are trending NOW. We are far enough from the 2016 election that nothing here represents a prediction for what will happen in 2016. But knowing how things look now and observing the trends still provides interesting insight. Today I added new polls from CNU in Virgina and from Bloomberg / Saint Anselm / Purple in New Hampshire. These resulted in changes worth noting* for three candidate pairs. I’ll review them quickly in order of the magnitude of the change. Click on any of the charts to go to the election2016.abulsme.com site for more detail. Clinton vs Huckabee
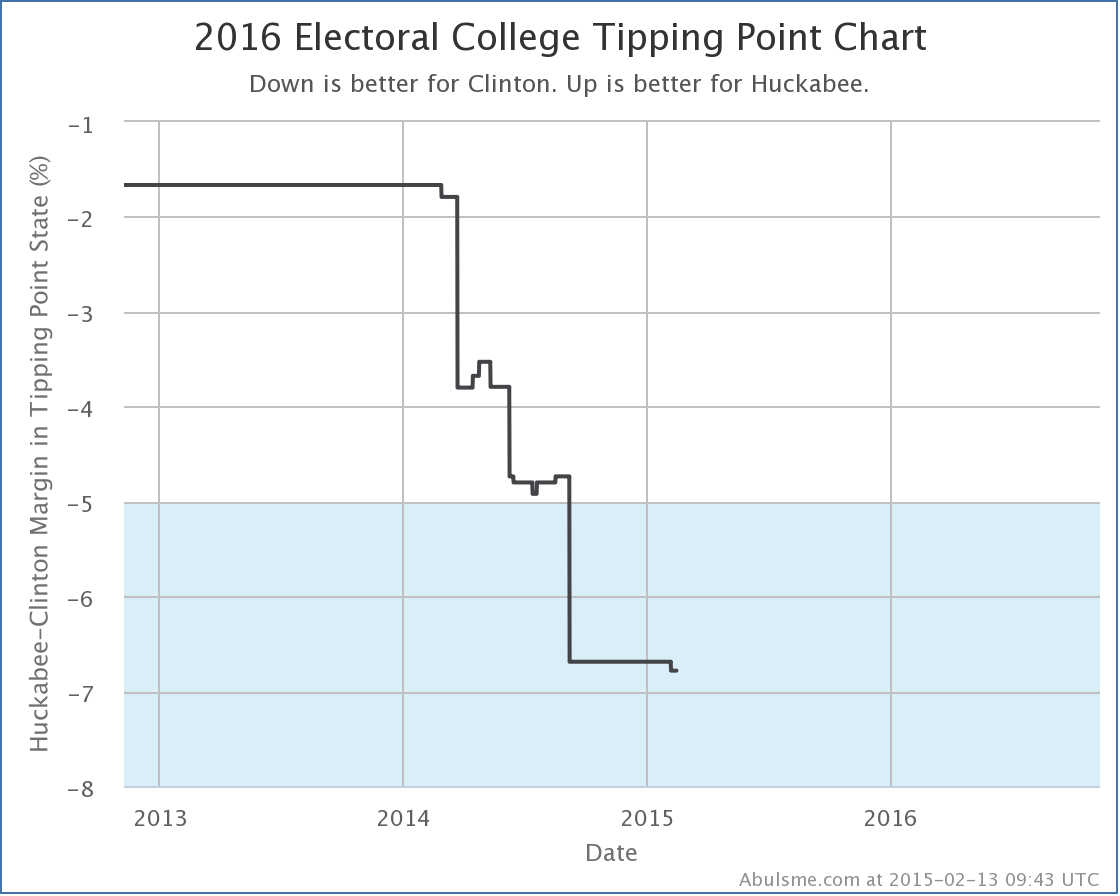
Huckabee had only been hanging on to the “Weak Clinton” category in Virginia by virtue of the fact that I pad my poll average with previous general election results if there are not yet five actual polls between the candidates in question. With the third poll directly pitting Clinton vs Huckabee in Virginia, Huckabee falls much further behind, and Virginia now seems to slip out of reach. Huckabee’s best case vs Clinton therefore gets worse. Without Virginia in the mix, Huckabee’s “best case” (where he wins all the states he is ahead in, plus all of the states where Clinton is ahead by less than 5%) is now to lose to Clinton by 76 electoral votes. This change also drops the “tipping point” (which represents how much of a uniform shift in polling across all states would be needed to flip the election) further in Clinton’s direction. The tipping point state for Clinton vs Huckabee is now Minnesota, where Clinton is ahead by 6.8%.
Clinton vs Paul
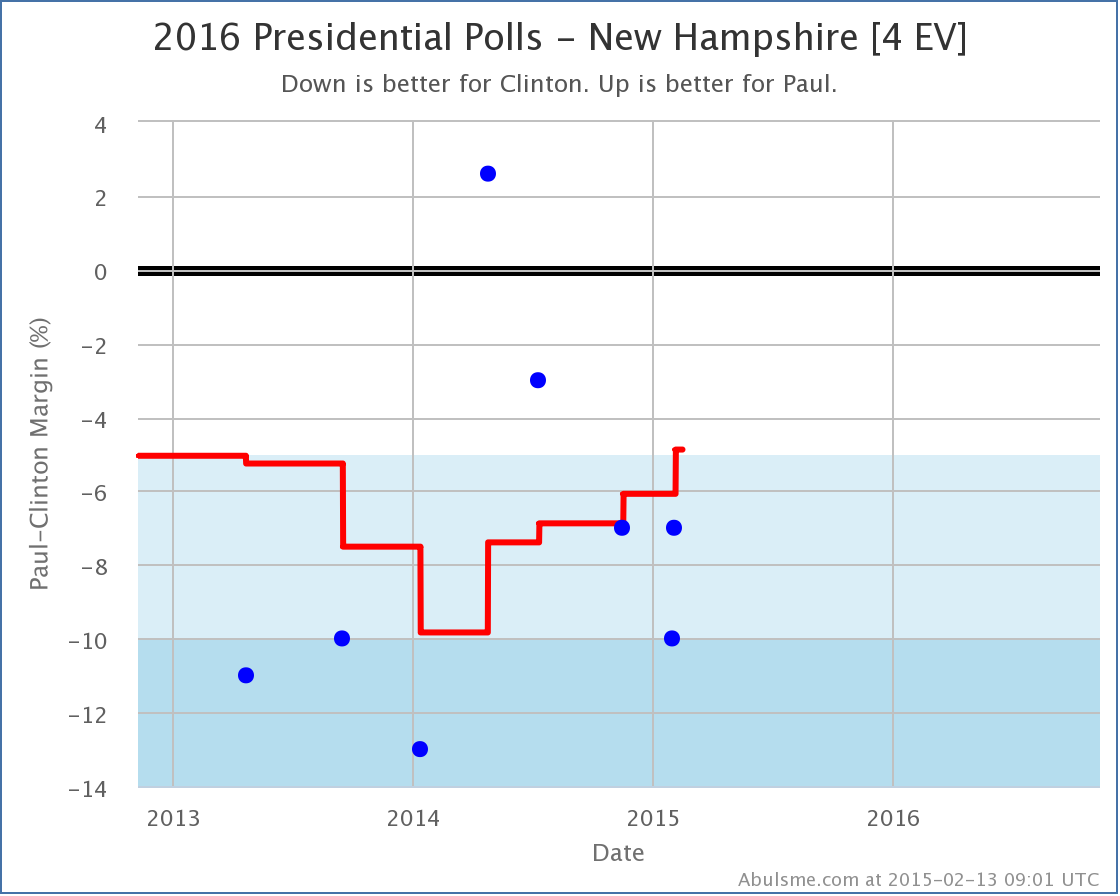
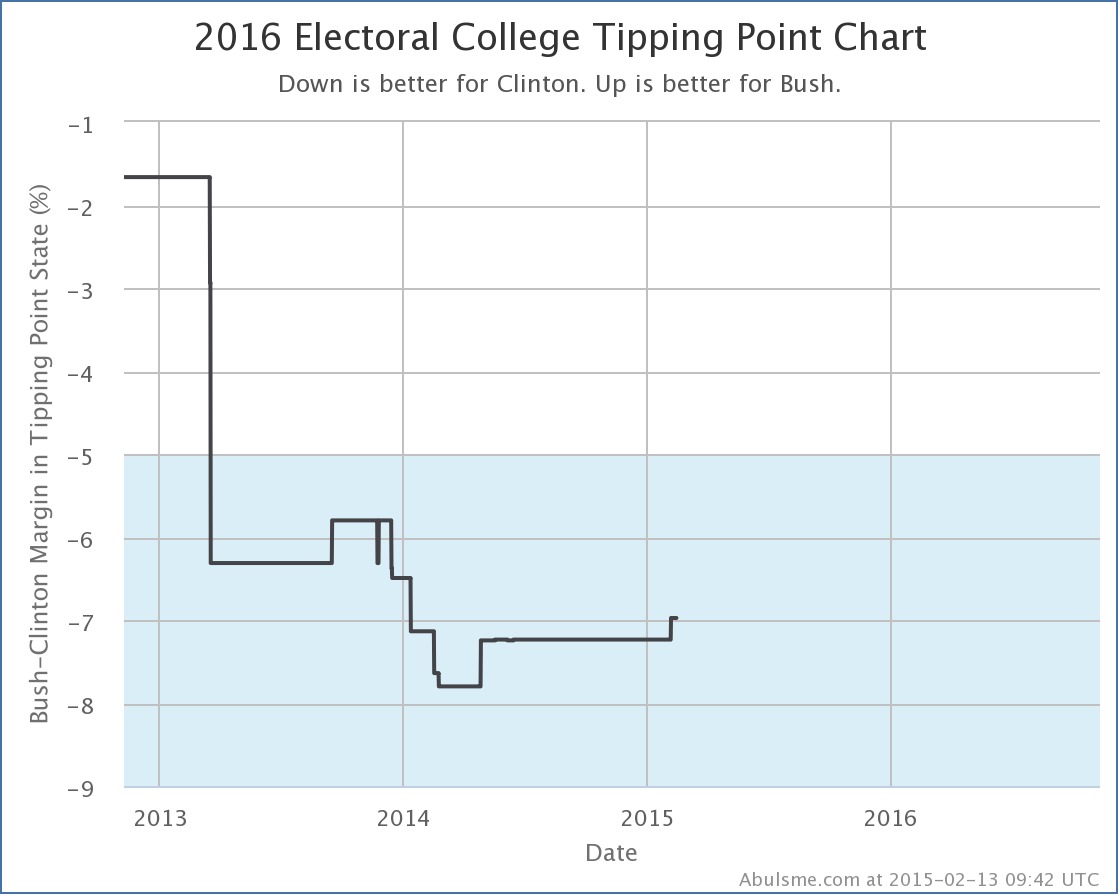
This chart of Clinton vs Paul polls in New Hampshire is interesting, and actually shows one of the disadvantages of using an average of the most recent polls, rather than some more sophisticated sort of trend smoothing. Paul’s average vs Clinton has been steadily improving for the last year. But if you look at the individual polls, you see that this is because some really bad polls for Paul from 2013 and early 2014 were “aging off” the average, being replaced by some relatively good polls for him from the last year, including one where he was actually ahead! But if you actually look at the trend of the individual polls since then, the trend has been back toward Clinton. With a straight up poll average, this trend in the last five polls is invisible. We just know that the average of the newest five is higher than that of the five most recent polls not counting the brand new one. Basically, a poll where Paul was behind by 13% was replaced by a poll where Paul was only behind by 7%, so the average moved toward Paul… even though there may be a different trend if you look within the five polls actually used in the average. If the trend in the last five polls is real (it may or may not be) then it would not be surprising to see New Hampshire fall back into “Strong Clinton” territory with the next poll. For now though, we grant Paul the possibility of winning New Hampshire in his “best case” which is now to lose to Clinton by only 88 electoral votes. Clinton vs Bush No changes in best, worst or expected case for Bush against Clinton, but since the tipping point in this case was Virginia, and we had polling in Virginia, it is not unsurprising that the tipping point here moved, if only a little.
The tipping point here remains Virginia, but Bush moves from being behind 7.2% there, to only being behind by 7.0%. And that is it for today’s update. Please explore election2016.abulsme.com to find more detail and interesting bits and pieces. * For now, “Changes worth noting” are when the best, worst, or expected cases for one of the five best polled candidate pairs changes, when the tipping point changes by at least 0.1% for one of those candidate pairs, or if a new candidate pair becomes “best polled” or replaces one of the current five pairs on the list.
|
||