This is the website of Abulsme Noibatno Itramne (also known as Sam Minter). Posts here are rare these days. For current stuff, follow me on Mastodon

Categories

Calendar

March 2025
S M T W T F S
 1
2345678
9101112131415
16171819202122
23242526272829
3031  

Electoral College: Huckabee continues to slip (vs Clinton)

Today’s update was new PPP polling in Wisconsin. PPP polled 11 candidate combinations. Of these only one produced a notable change in one of the “5 best polled candidate pairs” I track most closely here.

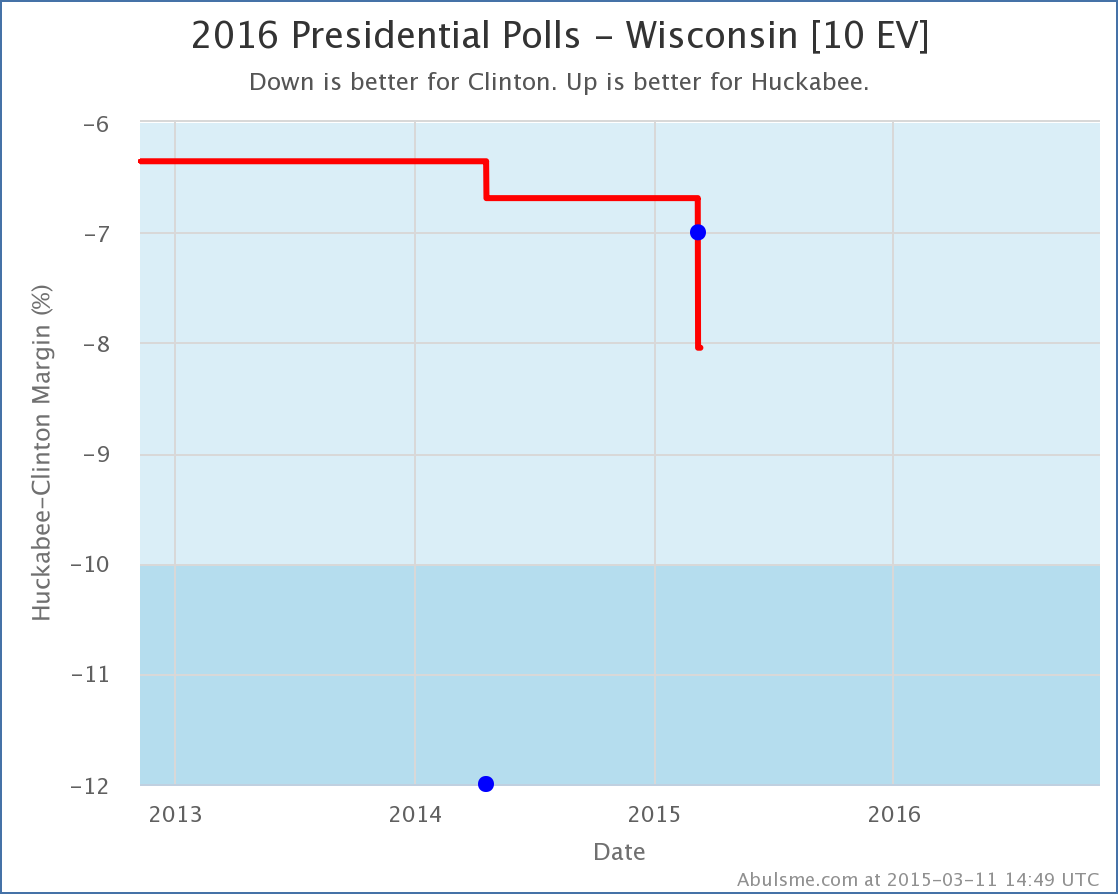
Specifically, this was the second poll of Clinton vs Huckabee in Wisconsin (the last was also by PPP, back in April 2014). This poll did not cause a category change in the average, it was Strong Clinton before, and it is Strong Clinton now:

chart (14)

So with no category change, why am I bothering with a post?

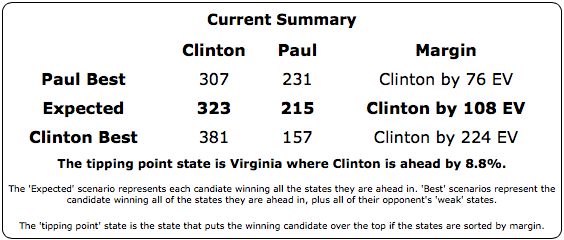
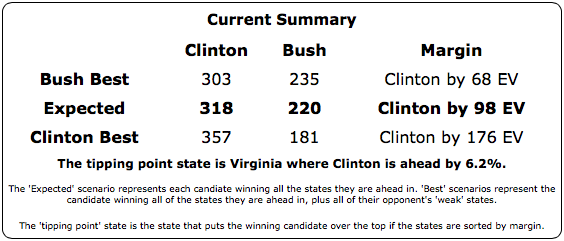
Well, Wisconsin slipping further into Clinton territory (from a 6.7% Clinton lead to a 8.0% Clinton lead) reshuffled the ordering of the states when sorted by margin and Wisconsin slipped past Minnesota (where Clinton leads by 6.8%). Minnesota had been the tipping point state. So Clinton doesn’t necessarily need Minnesota any more, because it is easier to get Wisconsin. This means the tipping point shifts to 8.0% in Virginia.

chart (15)

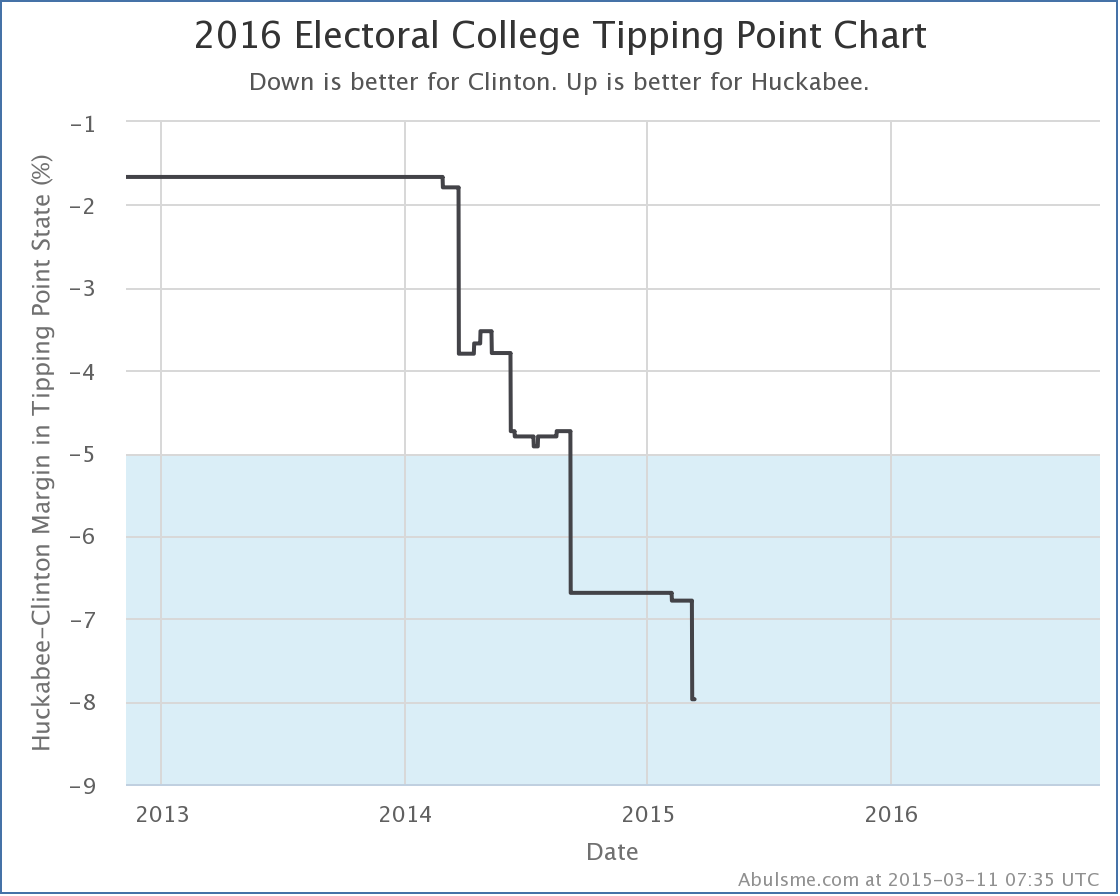
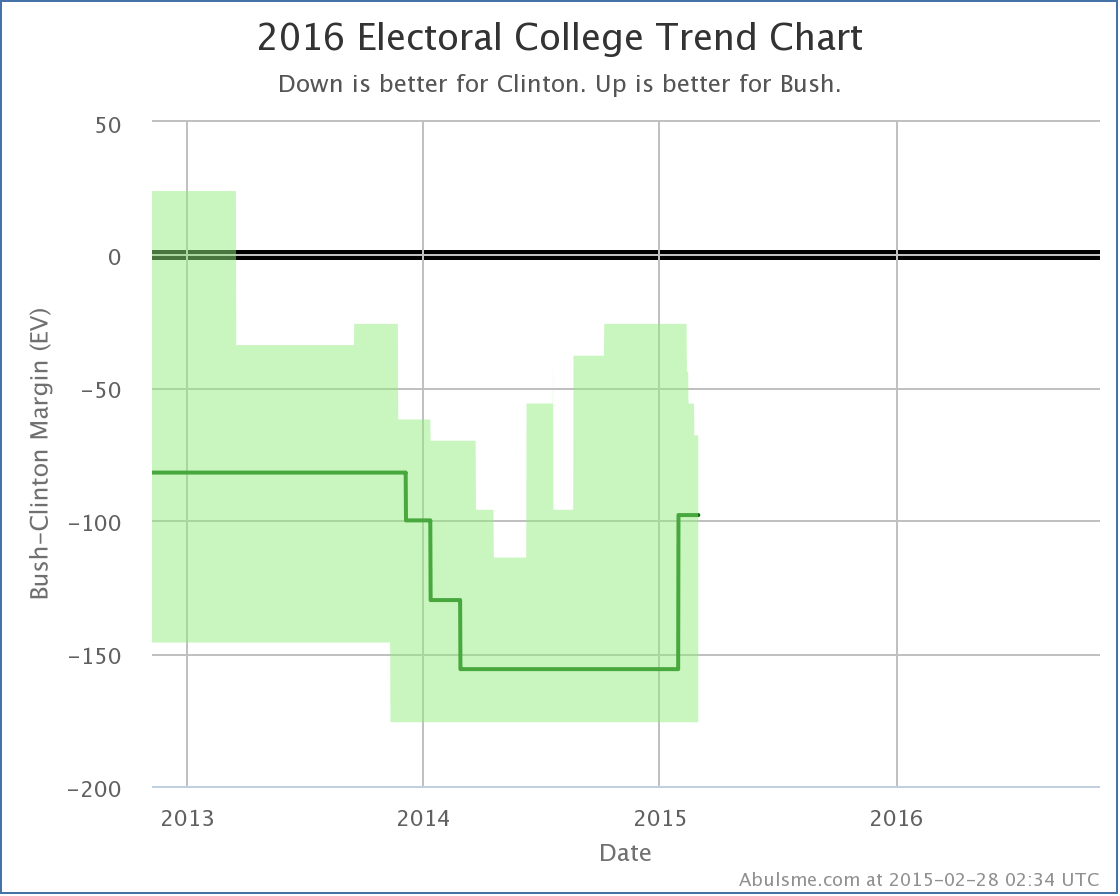
The last time the tipping point moved even briefly in Huckabee’s direction was last August, but as you can see, the general trend has been that the more polling there is on this combination, the worse it looks for Huckabee.

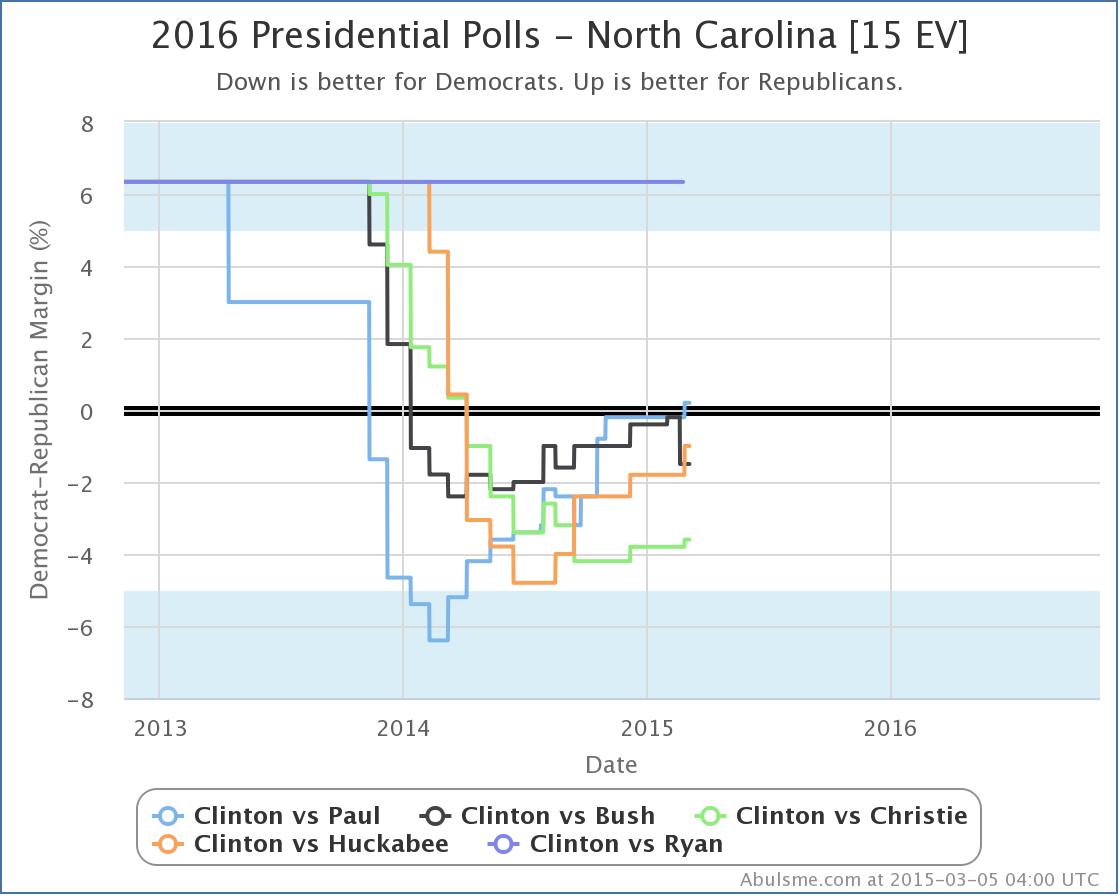
Since this is an otherwise short update, a quick look at how the tipping point looks across all five “best polled” candidate combinations at the moment:

chart (16)

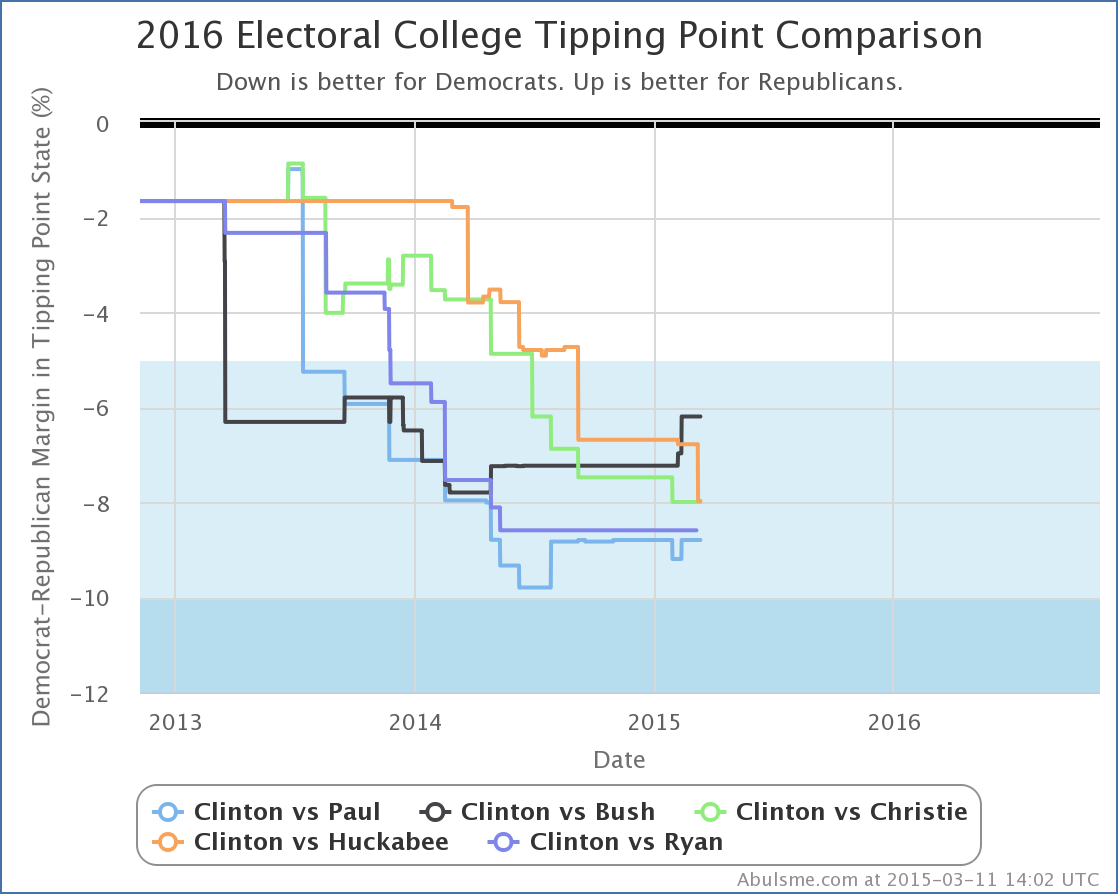
All of the Republicans are running way behind Clinton, but the trends are different.

Basically, we can group the five candidates (all vs Clinton) into three categories based on the last six months or so of tipping point movement:

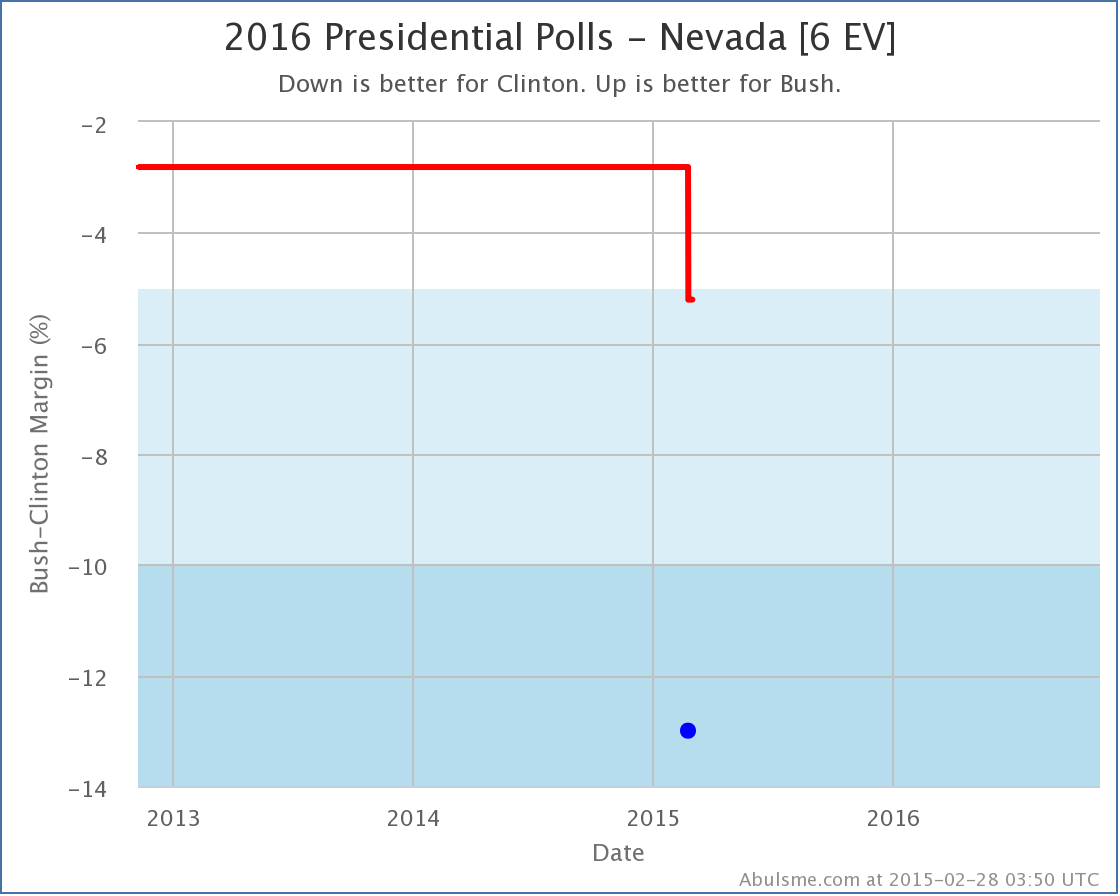
  • Republicans gaining strength against Clinton: Bush
  • Republicans basically flat against Clinton: Paul and Ryan
  • Republicans losing ground against Clinton: Christie and Huckabee

Ryan has said he is not running of course. There is also lots of talk about Walker, and sometimes of Cruz or Rubio, or even of combinations involving Democrats other than Clinton occasionally, but polling at the state level on all of those other combinations is still significantly more sparse than the five combinations here, and therefore the data less reliable, so we leave them out for now.

Note: This post is an update based on the data on my 2016 Electoral College Analysis Site. All of the charts and graphs seen here are from that site. Graphs, charts and raw data can be found there for the race nationally and in each state for every candidate combination that has been polled at the state level. In addition, comparisons of the best polled candidate combinations both nationally and each in each state are available. All charts above are clickable to go to the current version of the detail page the chart is from, which may contain more up to date information than the snapshots on this page, which were current as of the time of this post.

Edit 2015-03-16 17:44 UTC to add standard note to end.

@ElecCollPolls tweets from 2015-03-07 (UTC)

@ElecCollPolls tweets from 2015-03-06 (UTC)

Curmudgeon’s Corner: Can’t Dispense Ice

In the latest Curmudgeon’s Corner Sam and IvГЎn talk about:
* Ivan’s Refrigerator
* Clinton Emails
* Netanyahu Speech
* Nemtsov and Russia
* Lightning Round

CCCover20141121-bigheads-2
Recorded 2015-03-06

Length this week – 1:26:04

1-Click Subscribe in iTunes
Download MP3 File
View Podcast in iTunes
View Raw XML Feed

@ElecCollPolls tweets from 2015-03-05 (UTC)

Electoral College: Paul now ahead in North Carolina average vs Clinton

Today’s poll update consisted entirely of a new release of North Carolina data from PPP. They polled 11 different candidate combinations for 2016. Only one of these caused a category change for one of the top five “best polled” candidate pairs. That would be Clinton vs Paul:

Although the most recent poll has Paul behind by 3%, the poll it replaces in the average had Paul behind by 5%, so the average moves from an 0.2% Clinton lead to an 0.2% Paul lead.

Now, to be clear, just barely on one side of the line vs just barely on the other side of the line, either way this is about as close to a tie as you can get. (Especially since the way I calculate polling averages actually doesn’t allow ties, since it will pull in older polls to break any ties that might otherwise come up.)

The spread of the last five polls is from Clinton by 5% to Paul by 6%, so there is a lot of uncertainty here too. Basically, North Carolina is a toss up. But that’s what being “Weak” means in my model anyway. We allow the state to swing from side to side in calculating the range of possible outcomes.

But for now, this does push the “Expected Margin” in Paul’s direction:

chart-2

Screen Shot 2015-03-05 at 06.11.29779

Still way behind to be sure, but every change in the Clinton vs Paul margin range numbers in the last few months has been in Paul’s direction.

Bush, Christie and Huckabee were also in this latest batch of North Carolina polls, so lets look quickly at the comparison chart as well:

chart-4

Ignore Clinton vs Ryan, which has never been polled in North Carolina.

All of the candidates have been improving against Clinton in the last few months. Paul is just the first to flip the state. Bush was very close, but the last two polls including him didn’t go his way, so he pulled back a bit. But even Christie looks like he may have bottomed out and is now improving again. In North Carolina at least, the trend seems to be away from Clinton and toward the various Republican contenders.

As usual though, the usual caveats apply on how sparse polling still is, just how far away from the election we still are, and how the very next poll may change the trend.

Final thing to mention, with today’s new data Clinton vs Huckabee passed Clinton vs Ryan to take the #4 spot in my “Top 5 best polled” list. Given that Ryan has said he is not going to run, it probably won’t be that long until he drops off the top 5. Cruz, Rubio and Walker (all vs Clinton) have all gotten recent polling attention that is improving their polling situation. Given all the recent attention, my bet would be on Walker, even though of this bunch he is currently furthest behind in my polling quality metric, but we shall see…

Note: This post is an update based on the data on my 2016 Electoral College Analysis Site. All of the charts and graphs seen here are from that site. Graphs, charts and raw data can be found there for the race nationally and in each state for every candidate combination that has been polled at the state level. In addition, comparisons of the best polled candidate combinations both nationally and each in each state are available. All charts above are clickable to go to the current version of the detail page the chart is from, which may contain more up to date information than the snapshots on this page, which were current as of the time of this post.

@ElecCollPolls tweets from 2015-02-28 (UTC)

Electoral College: Bush slips in Nevada too

There were six states where the average margin over the last five presidential elections was less than 5%. Those states were Nevada, Ohio, Florida, Colorado, Virginia and Missouri. Since the 2012 election we’ve had lots of 2016 general election match up polls in Ohio, Florida, Colorado and Virginia. But nothing in Nevada or Missouri. No polls at all.

Today I added the first Nevada results for the 2016 cycle, a recent poll from Gravis.

The only category change coming out of this was for Clinton vs Bush.

chart-24

The margin over the past five elections in Nevada had ranged from the Republican by 3.5% (in 2000) to the Democrat by 12.5% (in 2008), but the average was Democrats by 2.8%, which gave Nevada an initial classification of “Weak Clinton”.

Gravis polled five different Republicans against Clinton. One of them (Sandoval) actually beat Clinton. The rest lost, and generally by a worse margin than the old average, but not by enough to push the average into a new category. Bush on the other hand did VERY badly in this poll, losing to Clinton 50% to 37%, or a 13% margin.

As the first actual head to head polling in Nevada, we’re still basing things primarily on old presidential election results, but that bad a result was able to single handedly move the the average to a 5.2% Clinton lead, and thus moved Nevada into the “Strong Clinton” category.

According to my simple model, this takes the state out of the list of possible Bush wins. At least for now… Perhaps this poll is an outlier and the next poll will make the state closer again. With one real poll, you wouldn’t want to feel too confident of what this stare really looks like quite yet.

For now though, this of course further lowers Bush’s “best case”:

chart-25

This makes the full national summary for Clinton vs Bush look like this today:

Screen Shot 2015-02-28 at 04.47.35922

Now, this doesn’t look great for Bush, but he may start improving in Nevada (and other states) as we start getting into real campaigning. Maggie Haberman is reporting in the New York Times that the first TV ads specifically targeting Clinton will air this weekend. These of course will not be the last. It will not be surprising to see things move toward the Republicans as this process gets into full swing.

And of course we still need polls in Missouri. :-)

So… stay tuned.

Note: This post is an update based on the data on my 2016 Electoral College Analysis Site. All of the charts and graphs seen here are from that site. Graphs, charts and raw data can be found there for the race nationally and in each state for every candidate combination that has been polled at the state level. In addition, comparisons of the best polled candidate combinations both nationally and each in each state are available.

[Edit 06:06 UTC to add note at end which will become standard on these update posts.]

Curmudgeon’s Corner: All Kinds of Noises

In the latest Curmudgeon’s Corner Sam and IvГЎn talk about:
* Bill O’Reilly vs Brian Williams
* Questioning Patriotism and Religion
* Iran and Israel
* Lightning Round

CCCover20141121-bigheads-2
Recorded 2015-02-26

Length this week – 1:14:36

1-Click Subscribe in iTunes
Download MP3 File
View Podcast in iTunes
View Raw XML Feed

@ElecCollPolls tweets from 2015-02-25 (UTC)