This is the website of Abulsme Noibatno Itramne (also known as Sam Minter).
Posts here are rare these days. For current stuff, follow me on Mastodon
|
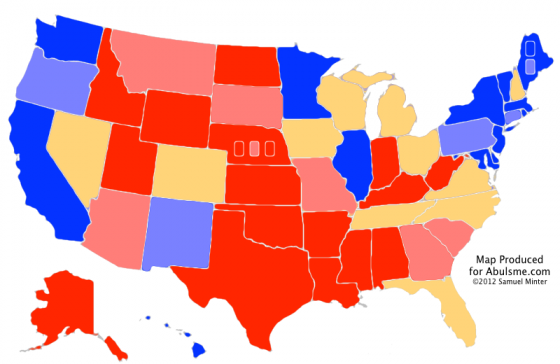
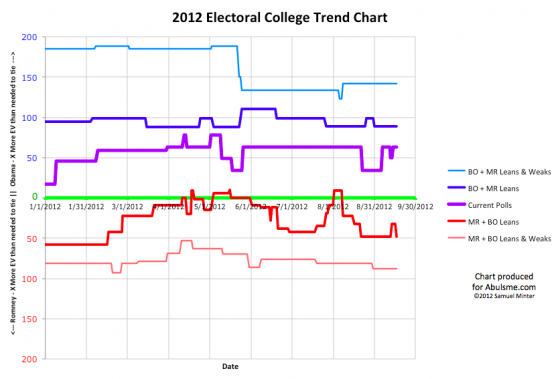
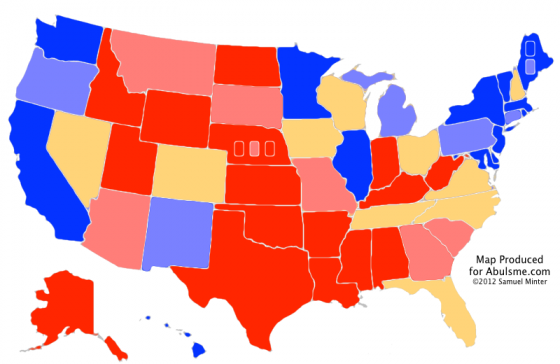
So that didn’t last long. Three days ago Michigan topped a 5% Obama lead in my five poll average… just barely, at 5.1%. Now with a new poll, that drops back down to 4.4%. So, once again, I consider Michigan in the “could go either way” category.
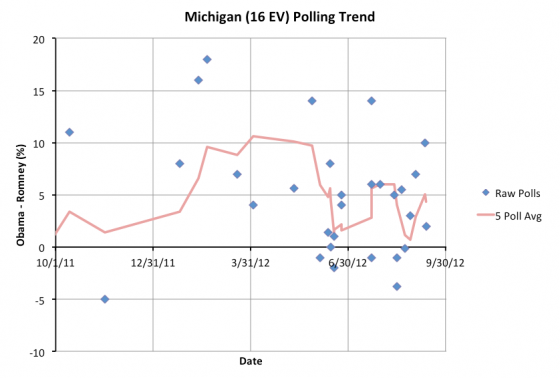
We’re still right around my arbitrary 5% line, so the next poll could easily move this back above 5%. Or of course it could move things further in Romney’s direction. For the moment though, back to being close enough that we consider it within the realm of possibility that Romney takes the state in November.
Having said that, although a few individual polls have shown Romney ahead, at no time in the last year has Romney been ahead in Michigan in the five poll average. This is not one of the “closest of the close” states where the lead has gone back and forth all year. This is a state that is relatively close, but Obama has been ahead all along.
With Michigan now once again included in Romney’s best case, the new summary is:
|
Romney |
Obama |
| Romney Best Case |
301 |
237 |
| Current Status |
206 |
332 |
| Obama Best Case |
180 |
358 |
So pretty much where we’ve been for awhile: Obama with a substantial lead. Romney still able to win if he sweeps almost all of the close states, most of which he is currently behind in.
To win Romney needs something big that changes the dynamics of the race. More of the same from both sides just ends up with a fairly comfortable Obama win.
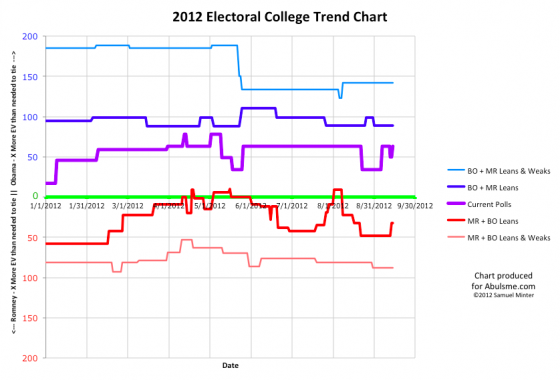
Note: Chart and map from the Abulsme.com 2012 Electoral College Prediction page. Both assume Obama vs Romney with no strong third party candidate and show polling as it currently exists. Things will change before election day. On the map red is Romney, blue is Obama, gold states are too close to call. Lines on the chart represent how many more electoral votes a candidate would have than is needed to tie under several different scenarios. Up is good for Obama, Down is good for Romney.
If this one stays as close as it is, it will be annoying to catalog the flips between now and election day between just barely one way and just barely the other way. In any case, Virginia, which moved from Leaning Obama to Leaning Romney in my five poll average on Wednesday, now moves right back where it was with the next new poll:
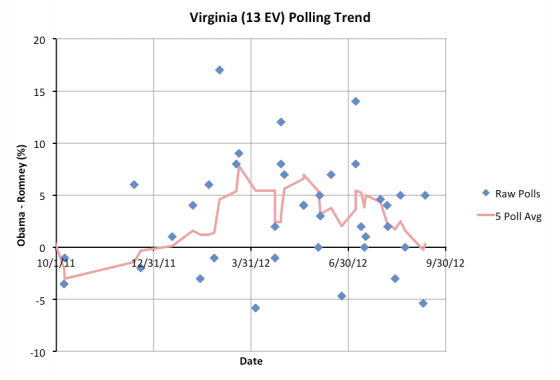
This represents a move in the five poll average from a Romney lead of 0.3% to an Obama lead of 0.3%. I can’t emphasize enough that both of these results just mean a super tight race in Virginia at the moment. It is too close to call. In general I say that any state where the lead is less than 5% should be considered a toss up, simply because that small a lead can disappear quickly. This is why I color all those states the same color on the map, regardless of who is slightly ahead. But 0.3%? For all intents and purposes, the state is tied at the moment.
Of course, you have to keep in mind what “the moment” is. My five poll average in Virginia currently goes back almost exactly a month. A lot has happened in that month. But we’ve only had five polls in Virginia. Two of the five polls have been since the conventions. If you average only those two… you get an 0.2% lead for Romney. Still too close to call. Virginia really does look like a toss up at this point.
Never the less, since the five poll average is slightly on Obama’s side at the moment, we move it to Obama’s side for the “Current” line of our summary, which assumes the candidates win every state where they lead even slightly in the five poll average.
|
Romney |
Obama |
| Romney Best Case |
301 |
237 |
| Current Status |
206 |
332 |
| Obama Best Case |
180 |
358 |
And where does this put us? It puts the current line right back at a 332 to 206 Obama win… Right where the model has been for all but a few scattered weeks since the beginning of April. More specifically 124 of the 167 days since April 1st have had the model at a 332 to 206 Obama win. That’s 74% of the time. The other 26% of the time things have looked a bit better for Romney, or a bit better for Obama… more often a little bit better for Romney… but then we’ve reverted right back to good ol’ 332 to 206.
Even when states have come and gone from the set of close states, changing either Romney or Obama’s “best case” where they win all the close states, the model line in the middle has stayed remarkably stable.
Compare this to my analysis exactly four years ago. If you look at the center line of that chart (a double pink/blue line rather than this year’s purple) you’ll see that between March and September it was moving all over the place. (In interpreting the old charts, keep in mind that last time around down was good for Obama, this time up is good for Obama.) This year things are just remarkably stable in comparison.
It is also interesting to note that by this time four years ago the “lead” in the race had changed hands five times. (And it would change hands two more times before the election.) In comparison this time the lead has changed hands… well, never. Obama has been ahead from the start.
But to show how things can change in the final stretch to November: On September 14th 2008, the current state of the polls was actually showing a 269-269 tie. Obama of course went on to win 365 to 173. In the last month and a half of the campaign, 96 electoral votes moved onto Obama’s side of the line. So big movements are possible in relatively short amounts of time.
Even having said that though, if I had to make a bet right now, I’d bet on a 332 to 206 Obama win. This time around even when the polls move from that spot, they seem like they keep wanting to go back there. :-)
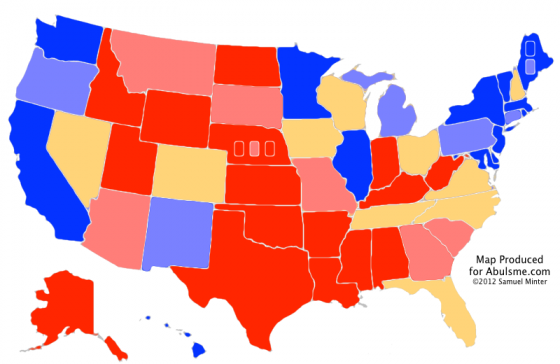
Note: Chart and map from the Abulsme.com 2012 Electoral College Prediction page. Both assume Obama vs Romney with no strong third party candidate and show polling as it currently exists. Things will change before election day. On the map red is Romney, blue is Obama, gold states are too close to call. Lines on the chart represent how many more electoral votes a candidate would have than is needed to tie under several different scenarios. Up is good for Obama, Down is good for Romney.
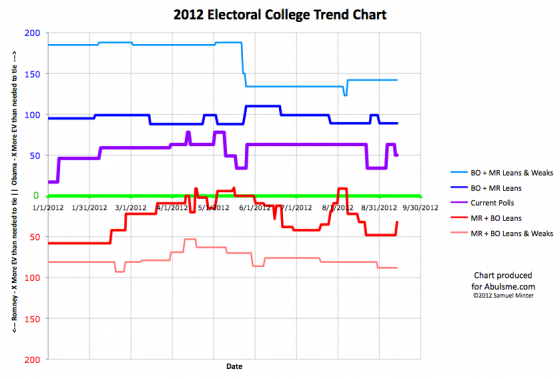
One change today. After flirting for awhile with the idea of being a close state that might actually be in contention this election, Obama’s lead in Michigan is once again starting to open up:
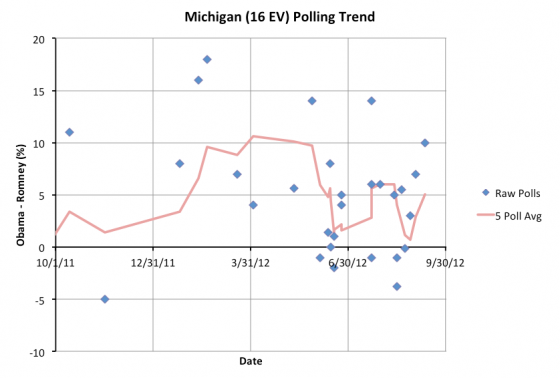
Obama’s lead in the state is now just barely over my 5% threshold, so I move the state from “Leaning Obama” to “Weak Obama” and color it light blue on my map. Basically, Obama is now far enough ahead in Michigan that it looks like a pretty safe bet that he will take the state in November. But his margins aren’t so high that he should be taking the state completely for granted. Given the right opportunity, Romney could still make it close again.
This means that I take the possibility of winning Michigan back out of Romney’s best case. This leaves the new model summary as follows:
|
Romney |
Obama |
| Romney Best Case |
301 |
237 |
| Current Status |
219 |
319 |
| Obama Best Case |
180 |
358 |
At this level, Romney’s best case has him with 32 electoral votes more than he needs to win. Looking at this, he still has no “must win” states mathematically. Theoretically he could lose Florida (27) and still win if he won every other close state. Realistically speaking of course, if he is in a position where he loses Florida, it is highly unlikely that Romney would simultaneously win the rest of the close states. His paths to victory are a lot narrower without Michigan as a possible win.
Although there was the move toward Romney in Virginia in yesterday’s update, so far my prediction from last week that the beginning of September would be Romney’s post-primary high water mark is holding. (I updated my post from yesterday to add a note that my original accidental implication that I had already been proved wrong was incorrect.)
It has only been a week though. And it has not been a great week for Romney. Romney may still have some good weeks left in him before this is all said and done.
Obama has a big advantage at the moment. Romney has a really hard road to go to make this really competitive. Being in a spot where you essentially have to sweep all of the close states (most of which you are behind in at the moment) in order to win is not where you want to be in mid-September. Especially as a challenger. But it is not over yet…
Note: Chart and map from the Abulsme.com 2012 Electoral College Prediction page. Both assume Obama vs Romney with no strong third party candidate and show polling as it currently exists. Things will change before election day. On the map red is Romney, blue is Obama, gold states are too close to call. Lines on the chart represent how many more electoral votes a candidate would have than is needed to tie under several different scenarios. Up is good for Obama, Down is good for Romney.
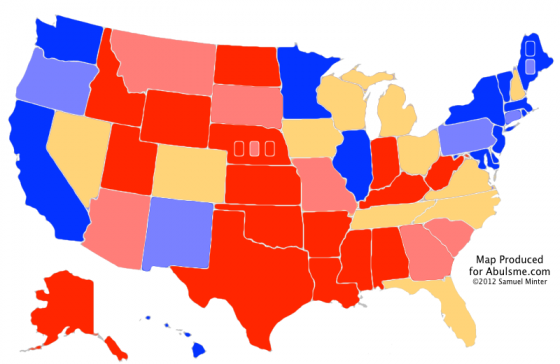
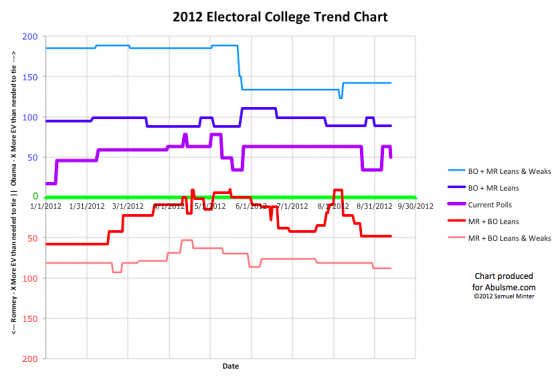
One state changes status today and it moves in a surprising direction given the overwhelming talk of the Obama bounce following the Democratic Convention. Virginia moves from just barely Obama, to just barely Romney:
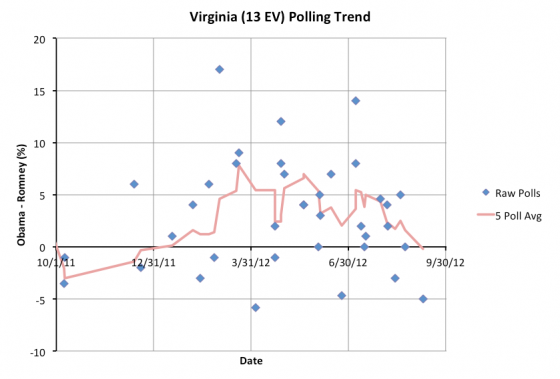
Since the Conventions ended, I’ve added polls in AL, AZ, FL, IL, MA, MN, NC, NJ, NM, OH, VA and WA. Twelve states. Eleven of these states didn’t change categories. Now the first one does, and it is Virginia. Not moving toward Obama, but moving toward Romney. But what about the bounce?? Aren’t all the polls showing a massive movement toward Obama right now? What is going on?
Well, the national polls have been showing that kind of move. The expectation is that the state polls will naturally follow. If the “bounce” lasts awhile and does not immediately fade, then they probably still will. But so far that just isn’t showing up. Now, since I use a five poll average, even if there is a move on one new poll, it might not cause a category shift right away. In most of these cases though, the new polls at the state level have been right in the same general range as the polls from before the conventions. Perhaps there has been some movement, just none that has moved any state to a new category in my model.
Until Virginia. Moving toward Romney. The five poll average moves from an Obama lead of 1.6% to a Romney lead of 0.2%. As usual when states move from “leaning” one way to “leaning” I will point out that any lead under 5% can disappear overnight with the right set of things in the news. I color all the states where the lead is less than 5% the same color on my map. These states really are close. They could go either way. And the states where the margin is less than 2%? Even more so. You might as well flip a coin.
So one should be very careful ascribing too much significance when one state flips back and forth across the line. The “current” model does move in this case… where every state goes the way the five poll average stands today. But I list the two “best case” scenarios here for a reason. To see where we really are, you need to look at that full range of possibilities. (Although of course we’re more likely to get a result “toward the middle” than near the edges of this range where one or the other candidate sweep all the close states… itself an unlikely scenario.)
In any case, the new update to the models:
|
Romney |
Obama |
| Romney Best Case |
317 |
221 |
| Current Status |
219 |
319 |
| Obama Best Case |
180 |
358 |
Bottom line, Obama is still ahead. He has a much stronger position. But Romney does have multiple ways to win. If the conventions have produced a bounce that improves Obama’s position substantially, it isn’t showing up in the electoral college yet.
My prediction from my last update that the beginning of September was going to be Romney’s peak in my model looks like it hasn’t come to pass though. My model shows Romney in a bit better position now than he was at the time of that update. Oh well! (Edit 2012 Sep 13 16:25… actually, my prediction was that the beginning of September would mark Romney’s peak. Although Virginia flipping did improve Romney’s position over the last update, it still isn’t as good as it was at the beginning of September, so my prediction has actually held so far…)
Conventional wisdom is that you have to wait for a couple weeks after the convention for public opinion to “settle down”. Add to that the fact that if you are looking state by state you have to wait for the critical states to get polled and you realize we’ve still got very incomplete information at the state level.
Since the conventions ended, of the close states Florida (29), Ohio (18), North Carolina (15) and Virginia (13) have been polled. Of these, only Ohio has been polled more than once. No new polls at all yet for Michigan (16), Tennessee (11), Wisconsin (10), Colorado(9), Iowa (6), Nevada (6), or New Hampshire (4).
So… we still need to wait for a bit more polling to see where things really stand in this post convention stage. Polling should be continuing to accelerate as we approach November, so with luck we won’t have to wait too long.
Note: Chart and map from the Abulsme.com 2012 Electoral College Prediction page. Both assume Obama vs Romney with no strong third party candidate and show polling as it currently exists. Things will change before election day. On the map red is Romney, blue is Obama, gold states are too close to call. Lines on the chart represent how many more electoral votes a candidate would have than is needed to tie under several different scenarios. Up is good for Obama, Down is good for Romney.
Edit 2012 Sep 12 11:13 UTC to correct the list of states with polls added since the convention to include AL and NJ, which I’d forgotten.
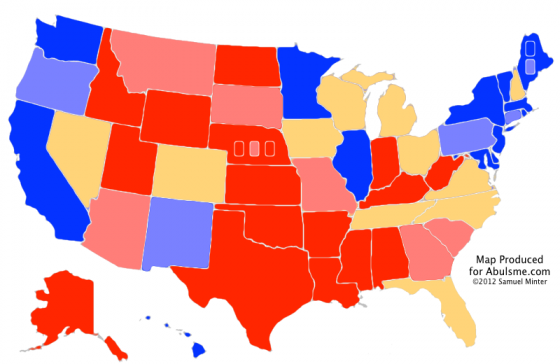
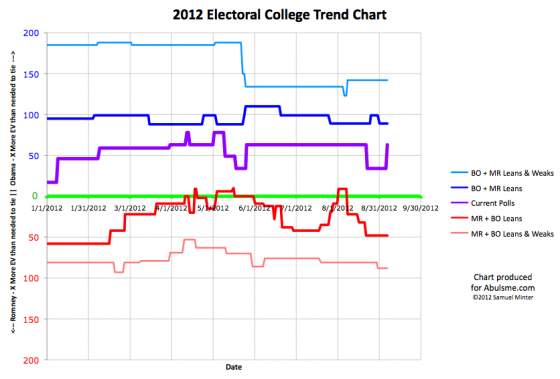
One change today. Just barely Romney Florida becomes just barely Obama Florida:
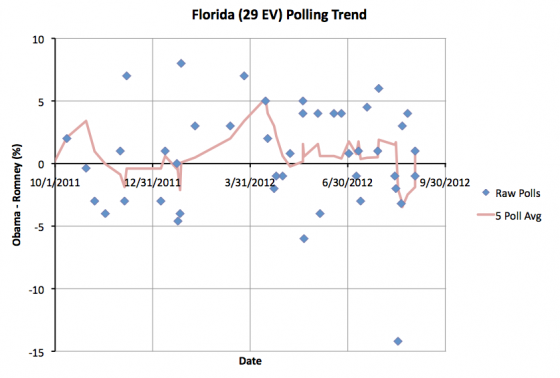
Now, some of you may remember my commentary on August 22nd when Florida moved to Romney. I mentioned that what pushed the average over to Romney was a poll showing a 14% lead for Romney… which was way out of line with any polling in the previous year… many sites that do poll analysis were just dropping it entirely as an outlier. I explained that I just leave everything in, and figure outliers will wash themselves out on their own before too long. That is exactly what happened here. As soon as the outlier poll aged out of the “Last 5 Polls” that I use for my average, Florida popped right back to being (just barely) leaning Obama. If I had simply excluded this poll, Obama’s lead in the five poll average would have dropped to 0.2%, but it would never have gone negative.
In any case, the five poll average now stands at an 0.8% Obama lead in Florida, so the state gets moved back into his column for the moment. I will caution, as I always do, that even leads up to 5% can be extremely ephemeral under the right circumstances. That is why I consider all states in that range as able to go either way pretty easily. A lead of less than 1%? That really is completely up for grabs. So nobody should read too much into Florida being just barely on one side of the line vs just barely on the other. Either way, Florida is still looking like a tossup.
This does put the “current” model right back to where it has been most of the year though:
|
Romney |
Obama |
| Romney Best Case |
317 |
221 |
| Current Status |
206 |
332 |
| Obama Best Case |
180 |
358 |
In the most recent episode of Curmudgeon’s Corner recorded yesterday and released today, I mentioned that my “gut feel” was that we have seen Romney’s post-primary high water mark, and that we’ll start seeing Obama gaining ground going forward from this point. Despite today’s Florida change, the numbers don’t show that yet. We only have a small amount of post-RNC state level polling, and of course no post-DNC state level polling since that event isn’t even done yet. The right set of things hitting the news and things could break rapidly in Romney’s direction.
In recent times though, challengers have usually lost ground between their convention and the election. Nate Silver recently looked at this in detail. Silver of course points out that this is not a universal rule. 1996 and 2008 both did not fit this pattern. There is still lots of room for the daily ebb and flow of national and international events… and campaign rhetoric… to change the shape of this race. Generally speaking though, if Romney follows the typical pattern, he is done. To date he has never been ahead in this race. He needs to be gaining ground to win. He has no room for the sort of “normal” decline that Silver describes.
Romney needs something big to vault him into a clear lead. His convention was one of the biggest chances for that, and so far it looks like if he got any boost, it was minimal. Assuming we don’t see a very unexpected negative effect coming out of the Democratic convention that ends up helping Romney, this means Romney’s next big chances are the debates… which usually don’t have much of an effect unless someone screws up… or to just hope that Obama just gets pounded by bad news, economic or otherwise, that ends up eliminating Obama’s lead.
Romney could indeed win the debates decisively, or Obama could get hit by those waves of bad news… and that would change things… but like I said, my gut is saying the beginning of September will have marked Romney’s post-primary high water mark in my models. So write that down. I’m going out on that limb. You can all call me on it when it proves to be completely wrong. Which now that I’ve said it “out loud”, will almost certainly happen. :-)
Note: Chart and map from the Abulsme.com 2012 Electoral College Prediction page. Both assume Obama vs Romney with no strong third party candidate and show polling as it currently exists. Things will change before election day. On the map red is Romney, blue is Obama, gold states are too close to call. Lines on the chart represent how many more electoral votes a candidate would have than is needed to tie under several different scenarios. Up is good for Obama, Down is good for Romney.
[Edit 2012 Aug 31 20:51 UTC to make it just “Sam talks about” instead of “Sam and Ivan”.]
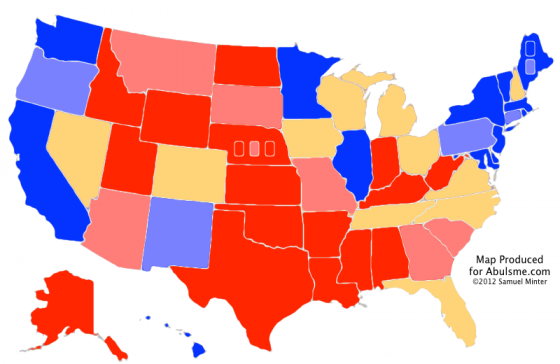
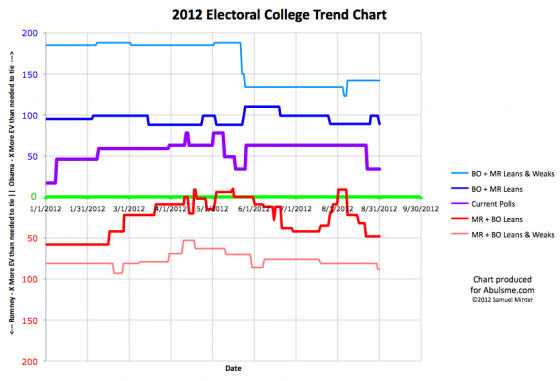
One update today, and it is Missouri reversing the move it made on the 25th:
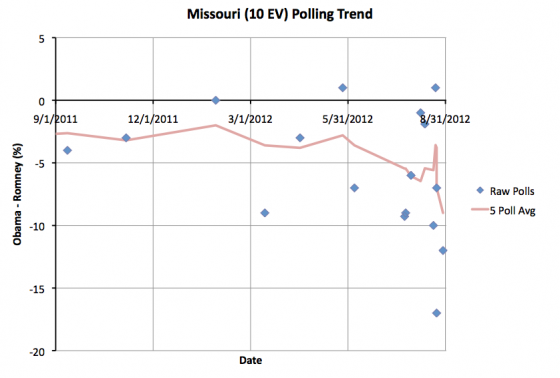
As you can see, polling in Missouri lately has been a bit, uh, wild. The last five polls, which only go back about a week and a half, have ranged from an Obama lead of 1%, to a Romney lead of 17%. That is just all over the place. I’m not sure that public opinion is really swinging quite so much so fast and there is something odd with the polls instead, but we have what we have. Before the two new polls I added today, the five poll average had a Romney lead of 3.8%. The two new polls were very good for Romney and we are now up to a Romney lead of a full 9%!
This is a very quick moment in Romney’s direction. I guess if there was indeed any movement away from the Democrats due to Akin, the backlash is now in full effect. Most of the last year Romney has been ahead in Missouri, but not by much. If the trend of the last few polls holds up, it looks like Obama’s support in Missouri pretty much collapsed and the state may even be heading toward my “Strong Romney” category.
With the polling as all over the place though, I’d reserve judgement on that. The next polls may move in the opposite direction. For the moment though, Missouri is very much in the “Weak Romney” category, meaning Romney has a pretty substantial advantage there, but not so large that he can feel safe completely ignoring the state.
This change once again reduces Obama’s best case:
|
Romney |
Obama |
| Romney Best Case |
317 |
221 |
| Current Status |
235 |
303 |
| Obama Best Case |
180 |
358 |
This means that even in his best case, Obama can’t reach his 365 to 173 victory margin from 2008. Even though Romney has had a good month in our models, Obama is still ahead… but the margins from 2008 are veery unlikely. This will be closer than 2008 unless something dramatic changes.
Note: Chart and map from the Abulsme.com 2012 Electoral College Prediction page. Both assume Obama vs Romney with no strong third party candidate and show polling as it currently exists. Things will change before election day. On the map red is Romney, blue is Obama, gold states are too close to call. Lines on the chart represent how many more electoral votes a candidate would have than is needed to tie under several different scenarios. Up is good for Obama, Down is good for Romney.
Edit 2012 Sep 6 09:34 UTC to add final note.
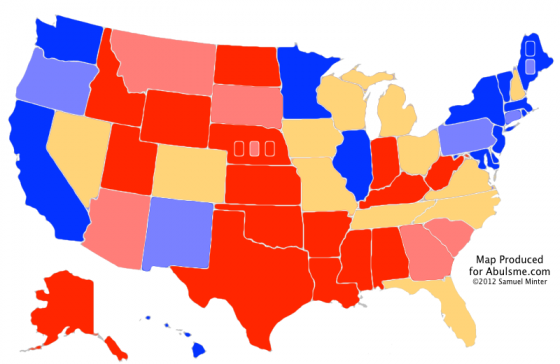
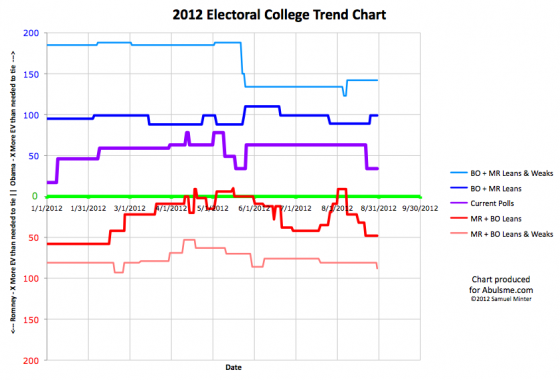
One state changing status today, and that is Connecticut, where Obama’s lead has diminished:
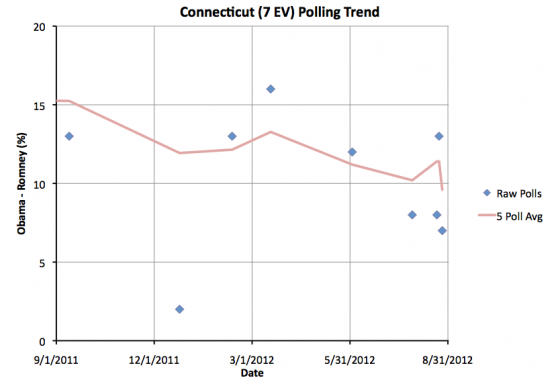
Connecticut has been fairly sparsely polled, being generally considered to be a pretty safe Obama state. But there have been a few new polls recently, and they have shown Obama’s lead somewhat diminished from the levels it had been at most of the last year. With today’s update, Obama’s lead in the five poll average drops to 9.6%.
Now, that is still a pretty substantial lead, but it moves Connecticut from my “Strong Obama” category to my “Weak Obama” category. In general, this represents states where the candidate has a definite lead, but not so large a lead that it is safe to ignore the state. The right set of events could potentially reduce the lead further and make the state competitive.
Having said that, it would take a pretty substantial change in the dynamics of the race to make Connecticut competitive, so that is not expected. But the slow deterioration of Obama’s margin in the state may still be something to watch.
Since Connecticut neither is nor was a “too close to call” state, the three models I track do not change:
|
Romney |
Obama |
| Romney Best Case |
317 |
221 |
| Current Status |
235 |
303 |
| Obama Best Case |
170 |
368 |
Note: Chart and map from the Abulsme.com 2012 Electoral College Prediction page. Both assume Obama vs Romney with no strong third party candidate and show polling as it currently exists. Things will change before election day. On the map red is Romney, blue is Obama, gold states are too close to call. Lines on the chart represent how many more electoral votes a candidate would have than is needed to tie under several different scenarios. Up is good for Obama, Down is good for Romney.
Edit 2012 Sep 6 09:33 UTC to fix link in final note.
|
|


