This is the website of Abulsme Noibatno Itramne (also known as Sam Minter).
Posts here are rare these days. For current stuff, follow me on Mastodon
|
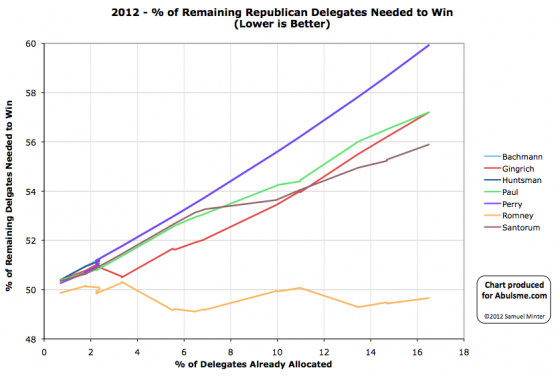
Chart from the Abulsme.com 2012 Republican Delegate Count Graphs page. When a candidate gets down to 0%, they have cinched the nomination. If they get up past 100%, they have been mathematically eliminated. Rather than the date on the x-axis, we show the “% of Delegates Already Allocated” as this better represents the progress through the race. Note that these numbers include estimates of the eventual results of multi-stage caucus processes which will be refined as the later stages occur.
So, today’s update includes the preliminary estimates from the Washington caucuses. As always, is important to note that no actual delegates were allocated at this point. That will happen at later stages of the process. Our graphs reflect Green Paper‘s “soft count” estimate, which will change over time as the later stages of the process happen. By those estimates, the results were Romney 16, Paul 10, Santorum 10, Gingrich 4. Santorum also picked up a super delegate since yesterday’s update. So for the day: Romney 16, Santorum 11, Paul 10, Gingrich 4.
Bottom line though, we have yet another day where EVERYBODY LOSES. Of course the narrative is all about how Romney has now “won” several in a row, and this gives him momentum going into Super Tuesday. And of course that is a very real effect. “Winning” and the media spin around it have a huge effect. People don’t just vote for their favorite candidate, they tend to want to vote for someone that can win. So things may change in future contests.
But as of right now, Romney did the best of the night, but he needed to get 49.4% of the delegates to be “on pace” to get to 1144. He actually got 16/41, or only 39.0%. So the percentage of remaining delegates he needs to get to win actually increases from 49.4% up to 49.7%. This isn’t a big move, but it is a move in the wrong direction. To be wrapping this up, Romney needs to be winning by numbers that drive this metric down. So far, he continues to hover in the range where if he continues as he has been, he will eventually win, but if he starts to do even slightly worse, he can be blocked.
For the non-Romneys, their path to the nomination continues to get more and more unlikely. Santorum is still in second place. He now needs 55.9% of the remaining delegates to catch up and win. This would be a remarkable change from the 20.4% of delegates he has managed so far. The more realistic goal for the non-Romneys at this point continues to be that they collectively get enough delegates to block Romney, not that any of them actually collect enough to win themselves. (Having said that, one of these guys catching up is not yet actually impossible if something major happens, it is just getting increasingly likely.)
I’ll also note that according to our estimates (combining the Soft Green Papers count and the DCW super delegate count) Ron Paul has now caught up and tied with Newt Gingrich for 3rd in the delegate count.
And now we have Super Tuesday. Although not as big as 2008, we’ll still have a large number of delegates awarded. The main thing to look out for: Does Romney’s “% of remaining needed to win” actually start to drop? If not, the possibility of him not getting to 1144 gets a lot more serious.
I am planning today to go to the Republican Caucuses here in Washington state. Doors open in about 30 minutes, you have to be signed in about 60 minutes from now, and 90 minutes from now the “action” should get started.
Assuming I am able to, I will be live tweeting as things progress. The tweets will appear on abulsme.com at a few minutes before 00:00 UTC in daily summary form, or you can follow me on Twitter to get updates in real time:
@abulsme
If I understand correctly, there will be a straw poll vote (which will be what is reported first by the press, but doest really matter), then there will be speeches and such, and then delegates will be picked for the county conventions. Those delegates will state their preferences most likely, but will not be bound in any way at the next level. Washington has 40 delegates, 30 will be winner take all 3 at a time by congressional district, and 10 will be proportional based on the state wide vote.
For the record, I plan on expressing my preferences (I hesitate to call what happens at a caucus actual voting) for Ron Paul. Of the four remaining Republican candidates, he is my preference by far. In terms of caucus participation, I am a Republican for the day, but at this point I am not ready to commit to what I will do in November. We shall see. And there will likely be other choices besides the Republican and Democrat, some of which may be interesting.
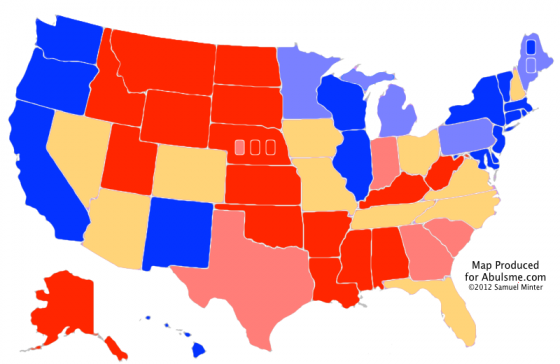
Map from the Abulsme.com 2012 Electoral College Prediction page. This map reflects Obama vs Romney. If any other candidate takes the lead in the Republican delegate race we’ll switch to making maps for them.
For a short time Romney’s last five poll average had dropped to less than a 10% lead in Montana, but the latest poll pushes that average back over 10%, so we color the state bright red again. Since either way Montana is not close to being a swing state (although the margin was only 2.3% in the 2008 election!) this does’t effect the overall summary of the race.
|
Romney |
Obama |
| Romney Best Case |
291 |
247 |
| Current Status |
210 |
328 |
| Obama Best Case |
159 |
379 |
This does represent the first state to move in Romney’s direction in a couple of weeks, which can be seen in our trend chart:
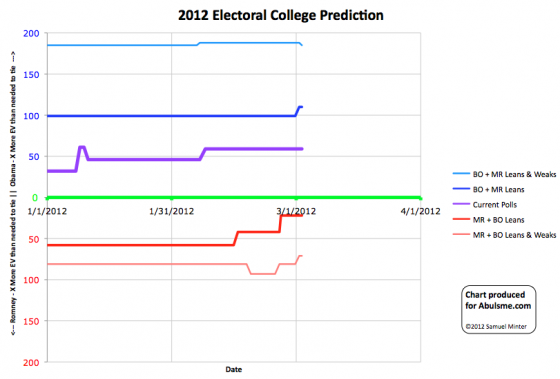
Chart from the Abulsme.com 2012 Electoral College Prediction page.
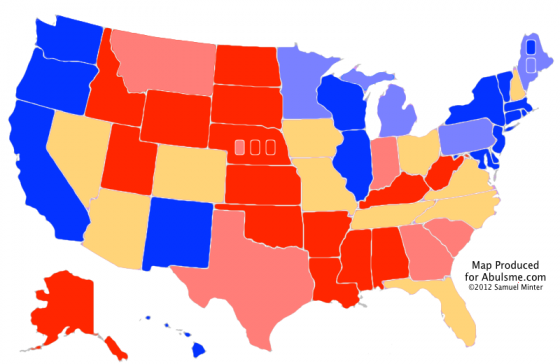
Map from the Abulsme.com 2012 Electoral College Prediction page. This map reflects Obama vs Romney. If any other candidate takes the lead in the Republican delegate race we’ll switch to making maps for them.
New polls in our last five poll averages move Obama’s lead in Wisconsin to over 10%, so that state moves into the “Strong Obama” category.
More interestingly perhaps, Romney’s lead in Tennessee drops to under 5%, moving that state to the “Lean Romney” category, which for purposes of our “best case” scenarios, puts the state into play for Obama. In 2008 McCain won Tennessee by a 15% margin, so this is somewhat surprising. We’ll see if this holds up as we move further into the year, but for the moment, that is where we are.
New Summary:
|
Romney |
Obama |
| Romney Best Case |
291 |
247 |
| Current Status |
210 |
328 |
| Obama Best Case |
159 |
379 |
And the trends since the beginning of the year…
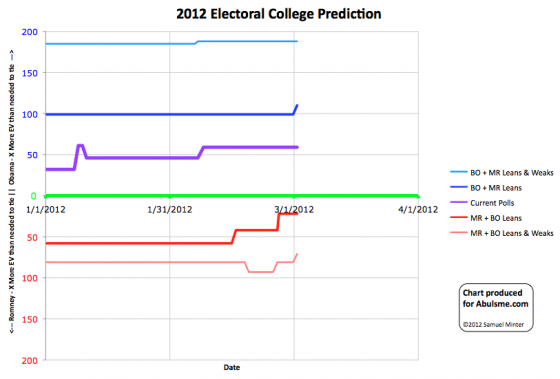
Chart from the Abulsme.com 2012 Electoral College Prediction page.
Up is better for Obama, so you can see that at least so far, things have generally been heading in his direction. It is of course still very early, so much will change between now and November.
Correction 2012 May 23 10:18 UTC: As it turns out, Wisconsin should NOT have flipped from Weak Obama to Strong Obama with this update on March 2nd. This change was influenced by the presence of a Washington State poll that I incorrectly included in my Wisconsin data. When this is backed out, Wisconsin does eventually go Strong Obama, but not until March 30th. Thanks to Darryl at HorsesAss for finding the error in my spreadsheet. The time series chart is corrected to reflect this starting with my May 23rd update.
Correction 2012 Jun 8 14:56 UTC: So, Tennessee shouldn’t have moved on this day either. The HorsesAss data included an old Tennessee poll from October 2011, that shows a strong Romney lead. The presence of this poll would have delayed the Tennessee move to “Lean Romney” until May 24th. This was noted and the historical graphs corrected starting with the June 8th update.
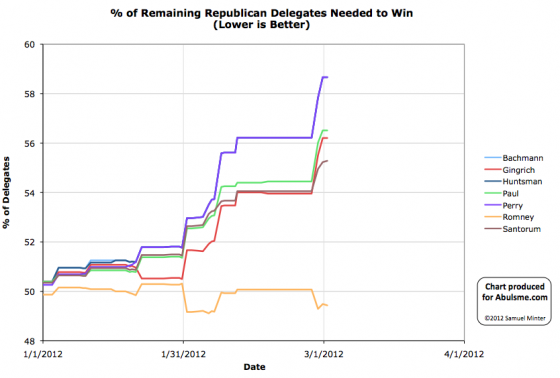
Chart from the Abulsme.com 2012 Republican Delegate Count Graphs page. When a candidate gets down to 0%, they have cinched the nomination. If they get up past 100%, they have been mathematically eliminated. Note that these numbers include estimates of the eventual results of multi-stage caucus processes which will be refined as the later stages occur.
So, everybody expected that 2 of Michigan’s delegates would be allocated proportionately, which meant that unless it was a complete blowout, you’d get one delegate each for the top two candidates statewide. But the Michigan GOP gave both delegates to Romney when they released the official results. They say that the proportional thing was a misunderstanding due to an error in an earlier memo and it was always going to be that way. The Santorum camp is calling shenanigans. More on this here and here. In any case, the result for the day is that Romney gains a delegate and Santorum loses one. It is just one delegate though, so the overall picture remains essentially the same.
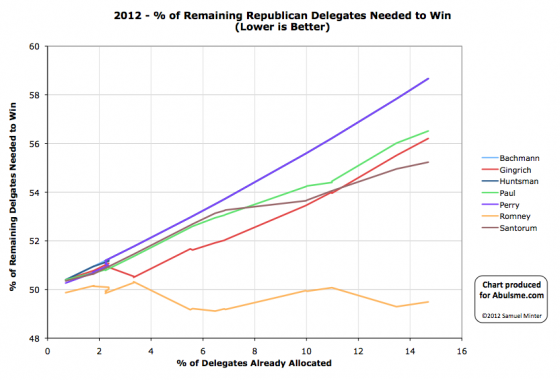
Chart from the Abulsme.com 2012 Republican Delegate Count Graphs page. When a candidate gets down to 0%, they have cinched the nomination. If they get up past 100%, they have been mathematically eliminated. Rather than the date on the x-axis, we show the “% of Delegates Already Allocated” as this better represents the progress through the race. Note that these numbers include estimates of the eventual results of multi-stage caucus processes which will be refined as the later stages occur.
So, first of all, that final congressional district in Michigan went for Santorum, so 2 more delegates for Santorum, making the final Michigan numbers 15 for Romney and 15 for Santorum, which was an exact match for my Scenario 2 in the post gaming out Arizona and Michigan.
Secondly, we have Wyoming. It is very important with Wyoming (as with similar caucuses previously) to point out that no national delegates were actually allocated in Wyoming yet. There was a straw poll, which doesn’t matter, and local delegates were selected for the next stage in the caucus process that will eventually select delegates to the national conventions. Ideally, each local delegate who was selected would be polled for their presidential preferences, and that would be used to predict results at the next level, etc. But that would be a ton of work, and nobody is doing that. Our source for these things, The Green Papers is doing the estimating by using the straw poll numbers for all candidates who got more than 5%. These estimates WILL change (perhaps significantly!) when the later caucus stages happen, but for now that is what we have. Green Papers estimates Wyoming as: Romney 10, Santorum 8, Paul 6, Gingrich 2.
And so when we pump this into the grinder and look at the “% of remaining needed to win” charts that I argue are the best way to see what is really happening… we find out… EVERYBODY LOSES. All four candidates in the race got delegates since my last update yesterday, but none of them got the delegates at the rate they would need to in order to get to 1144. Romney of course came closest. He got 10 out of 28 delegates today, or 35.7% of the delegates. But he needed to get 49.3% of the delegates (at least 14 of today’s 28) to actually be on pace to get to 1144.
Romney is still way ahead though. Right now he needs 49.5% of the remaining delegates to win. Santorum is in second needing 55.2% of the remaining delegates to win.
We are still fundamentally in a state where if Romney continues the way he has been, he will get to 1144, but very very late in the process… but with the possibility of the non-Romney’s blocking him still real. The non-Romney’s only have to do a little better than they have been to block Romney. One of the non-Romney’s actually catching up and winning gets to be an increasingly remote possibility as we move on though. Still not impossible. Just getting very hard. You would basically need consolidation around one non-Romney at the same time that Romney himself lost a significant amount of support.
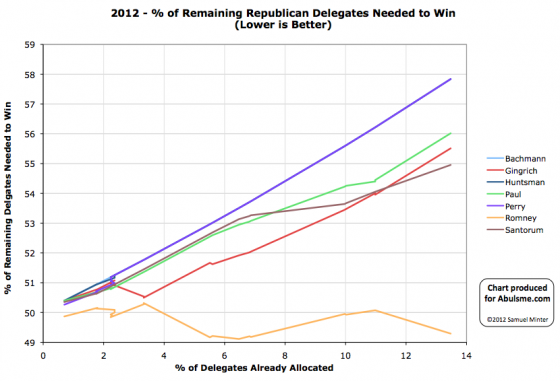
Chart from the Abulsme.com 2012 Republican Delegate Count Graphs page. When a candidate gets down to 0%, they have cinched the nomination. If they get up past 100%, they have been mathematically eliminated.
The chart above is now the chart using the “% of delegates already allocated” as the x-axis rather than the date, because I think it more clearly shows what is actually going on at this point.
Romney picks up all 29 delegates from Arizona. As of this update the best estimates at The Green Papers gives Romney 15 delegates from Michigan, Santorum 13, and 2 delegates still too close to call. Those of you who read my Gaming Out Arizona and Michigan post will recognize Scenario 2, which at the time I said was the most likely result, and indeed, that is what happened. If the last outstanding congressional district ends up going for Santorum, then it will actually match Scenario 2 exactly. Regardless though, the general outlines of Scenario 2 are met, and I’ll just quote my analysis from that earlier post:
Romney is still the only winner here. It is clearly not as big a win [as if he had won nearly all of Michigan’s delegates through a more geographically even win], but Romney still makes his “% of remaining delegates needed to win” go DOWN, and go down to under 50%. Santorum, despite getting some delegates, is still in a worse position than when he started the night. Before he needed 54.1% of the remaining delegates to catch up and win the nomination, now he needs 54.9% [actually 55.0% pending disposition of those last 2 delegates]. Santorum does pull ahead of Gingrich though, and put himself clearly into second place. But the three non-Romney’s in this situation are still all heading upward (toward being mathematically eliminated), none of them has started to actually move down toward catching up and winning. Romney in this situation does improve a bit here, but also still isn’t breaking out downward yet. He is still hovering in the zone where his opponents (collectively) only have to do a little bit better to block him from getting the nomination. Note that they do have to do better though. Paul, Gingrich and Santorum could keep getting delegates at the same rate, and Romney would still get the nomination, it would just take awhile.
Attention now moves to first Wyoming and Washington (although they are not getting much attention) and then of course Super Tuesday. Super Tuesday is not as super as it was in 2008, but there are still a big chunk of delegates at stake, and after it is over, we should have a better view of what the rest of the race looks like, and specifically if Romney is able to break out and start closing on 1144, or if the non-Romney’s still have a real shot at blocking him from getting there. (Let alone actually catching up and winning, which is a much further stretch.)
I was asked a few hours ago about the possibilities of nobody getting enough delegates to wrap up the Republican nomination and somebody who isn’t running today jumping in. I answered by email, but thought it was worth posting as well. Also, I’d be remiss to not point out that Ivan and I also discussed how the next bit of the race might play out on this week’s Curmudgeon’s Corner, so take a listen to that too. Anyway, my answer:
The most likely scenario is still that Romney gets to 1144, and does so without any special shenanigans. However…
A) The calendar is extremely spread out this year. We need to get to the end of March just to be where we were at the beginning of February in 2008. McCain pulled ahead by an uncatchable margin on Super Tuesday in 2008. We won’t have a comparable number of delegates selected for many more weeks now. So the story will be all about how Romney is having trouble closing, even though really we just aren’t as far along in the process yet.
B) So far Romney has been chugging along at a pace that will get him to 1144, but essentially at the last possible moment. We’re talking well into the Spring before he mathematically actually gets the magic number. If he continues at that pace, he will limp into the convention wounded and weak, and challenges may well be possible, causing fun drama. He desperately needs to start winning delegates by a wider margin than he has been, because…
C) While each of the non-Romney’s alone are not doing very well in the delegate race, collectively they just have to do SLIGHTLY better than they have been so far, not to win, but to block Romney from getting to 1144. For this to happen though, the collective non-Romney numbers have to improve… just a tiny bit, but they have to improve. So you have to have Santorum or Gingrich (and Paul) continue to pull delegates and just plain not collapse or run out of steam. Note, at this point some of the few Super Tuesday polls out there show this is a non-Trivial possibility. I’ve seen polls for Georgia (Newt ahead), Ohio (Santorum ahead), and Tennessee (Santorum ahead). And is it hard to believe that Alaska, Idaho, North Dakota, Oklahoma, and Wyoming won’t include a decent delegate haul for Santorum and/or Newt or Paul? (Even if we give Romney Massachussetts, Vermont and Virginia?) There has been light or non-existant polling in those places so far, but I look at them and think it is more than possible that even if Romney “wins” that night, he might do so with a plurality of the delegates rather a decisive over 50% margin. In that case, he’d still be way ahead in delegates, but the other three will have once again succeeded in not letting him get enough to be closing toward 1144 fast enough to get there. (Detailed gaming out of this from FHQ here: http://frontloading.blogspot.com/2012/02/very-rough-estimate-of-republican.html and here: http://frontloading.blogspot.com/2012/02/very-rough-estimate-of-republican_19.html )
D) Given the above, my actual position is what it has been for the last month or so… it will PROBABLY still be Romney, and he will PROBABLY win it outright, but the picture will be a lot clearer after Super Tuesday. We will then have over 35% of the delegates allocated, as opposed to only 11% like we do today. If after Super Tuesday, Romney’s “% of remaining delegates needed to win” number (the one I’ve been posting graphs about regularly) isn’t heading dramatically downward, then it will be very legitimate to start talking about the possibilities of him not getting to 1144. Right now it is fun to think about, but still unlikely. (Let alone the possibility of one of the others actually being on pace to catch up and win, which CAN STILL HAPPEN, but requires a complete Romney collapse.)
E) Unless Romney does a blow out win on Super Tuesday and crushes everybody else, assume that the press will make it out to be a race as long as anybody else is standing at all. Just like they did with Clinton vs Obama, they will pump it up and act like whoever is in 2nd has a chance to catch up long after they really don’t have any real chance of doing so at all. Watch my graphs. If after each contest Romney’s “% to win” goes down, and everybody else’s goes up, then Romney is walking toward the nomination, don’t let any of the hype delude you.
F) OK, lets say that Romney does NOT get to 1144, what then? Well, chances are, as long as he is way ahead in delegates compared to the others, he will probably still be the nominee. Deals will be made. Maybe none of the others actually drop out and throw their support before the convention, they get to get their votes in the roll call and make a big speech, but in the end, the deal is made. One or more of the other guys instruct their delegates to go for Romney on the 2nd or 3rd ballot or whatever in exchange for “something” and Romney gets it. This deal will probably be made before the convention, but worst case scenario, the deal is made by appealing directly to the delegates at the convention, and it ends up being Romney.
G) If the convention is indeed deadlocked, and decides to go with none of the four currently in the race, well, that would just be crazy fun chaos. But the big name candidates that everybody wanted to get in but didn’t will be running away from it as fast as they can. There are good reasons they decided to sit out 2008. Are they going to suddenly decide to want to come into that situation starting way late, starting way from behind, and inheriting a divided and discouraged party? Any reasons they had not to run earlier will be even stronger then. Maybe one could be “called to duty” and reluctantly accept, but would they really be doing anything other than making themselves weaker for 2016? And would a third or fourth tier possibility really be any better to all the assembled delegates? It would be a delightful mess to watch though. Still very unlikely though. There is a path to get to this, but it is very narrow, and all of the above are much more likely…
H) Oh, and of course the only thing even more fun than that kind of chaos, would be the convention not being able to select a candidate even after many ballots, breaking up into multiple conventions selecting different candidates… and splitting the party into two or more pieces. Of course, there are even MORE things that would prevent that, so that is too crazy for even me to contemplate right now. :-)
| In the latest Curmudgeon’s Corner…
Sam and Ivan talk about:
- Michigan and Arizona / Stupid things Candidates Say
- Decline of the PC / Windows 8
- Google and Privacy
Just click to listen now:
[wpaudio url=”http://www.abulsme.com/CurmudgeonsCorner/cc20120226.mp3″ text=”Recorded 26 Feb 2012″]
or
 1-Click Subscribe in iTunes 1-Click Subscribe in iTunes
 View Podcast in iTunes View Podcast in iTunes
 View XML Feed View XML Feed
|
 |
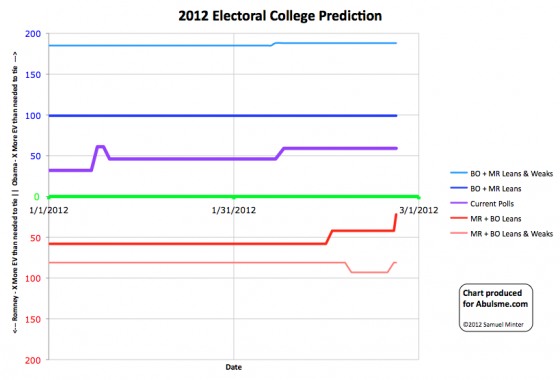
Chart from the Abulsme.com 2012 Electoral College Prediction page. Lines represent how many more electoral votes a candidate has than is needed to tie under several different scenarios. This chart reflects Obama vs Romney. If any other candidate takes the lead in the Republican delegate race we’ll switch to making charts for them.
This is a big one today. Obama’s 5 poll average in Pennsylvania is now more than a 5% lead. This means I take Pennsylvania out of swing state status. It is no longer “too close to call”, it is blue. This reduces Romney’s best case (win all the swing states scenario) to only a 291 to 241 win. It is still a win, but his best case is now a vey narrow win, only 22 electoral votes past the 269 needed to tie. That turns Florida into a “Must Win”, as without winning Florida, there is no longer a way to get to 269. (At least without reaching past the swing states and pulling back states where Obama is even further ahead.)
New summary:
|
Romney |
Obama |
| Romney Best Case |
291 |
247 |
| Current Status |
210 |
328 |
| Obama Best Case |
170 |
368 |
And new map…
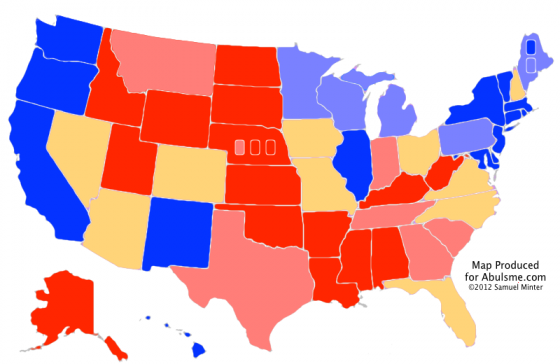
Map from the Abulsme.com 2012 Electoral College Prediction page.
|
|


