This is the website of Abulsme Noibatno Itramne (also known as Sam Minter).
Posts here are rare these days. For current stuff, follow me on Mastodon
|
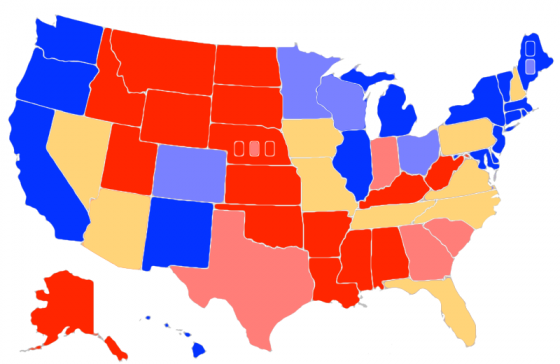
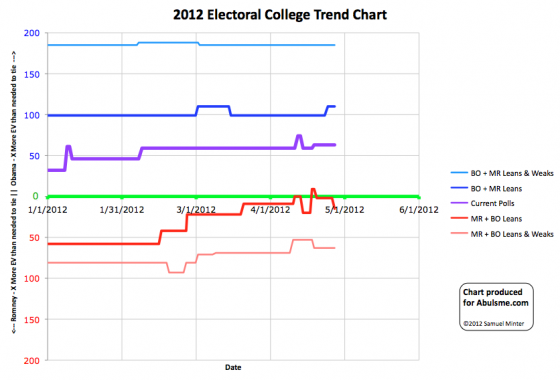
Chart and map from the Abulsme.com 2012 Electoral College Prediction page. Both assume Obama vs Romney with no strong third party candidate. Both show polling as it currently exists. Things will change before election day. On the map red is Romney, blue is Obama, gold states are too close to call. Lines on the chart represent how many more electoral votes a candidate would have than is needed to tie under several different scenarios. Up is good for Obama, Down is good for Romney.
One state changing categories today. Virginia.
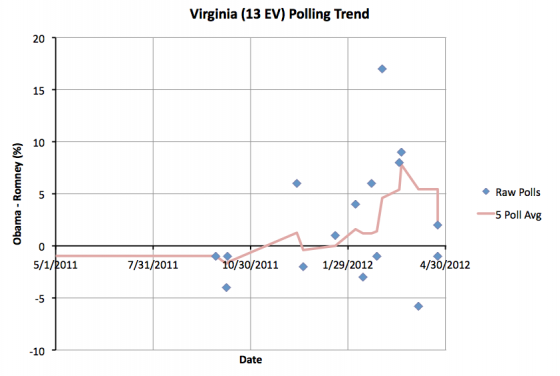
As you can see, The 5 poll average once again drops below 5%, moving the state from “Weak Obama” to “Lean Obama” and making Virginia once again one of the states we consider to be a swing state. The big effect here is the March 2nd Marist poll which showed Obama up by 17 in Virginia rolling off the 5 poll average. That poll was clearly an outlier. Even without it, we see a trend toward Obama around that time, but it wouldn’t have been large enough to move the average over a 5% lead without that one poll. In addition, the more recent polls have been moving in Romney’s direction. In any case, as of now the new 5 poll average has Obama up in Virginia by 2.4%. Clearly in the swing state category.
This change improves Romney’s best case scenario (where we give him all the swing states):
|
Romney |
Obama |
| Romney Best Case |
284 |
254 |
| Current Status |
206 |
332 |
| Obama Best Case |
159 |
379 |
Since Santorum dropped out on April 10th, there have been 11 changes to state categories. In the case of Florida (29 ev) and North Carolina (15 ev), they changed categories, but already changed back to where they were… so no net change. Ohio (18 ev), Arizona (11 ev), Colorado (9 ev) and New Hampshire (4 ev) moved toward Obama. Pennsylvania (20 ev), Virginia (13 ev) and Wisconsin (10 ev) moved toward Romney. The main net effect is slightly more electoral votes in the swing state category, so a bit larger range between Obama’s best case and Romney’s best case.
Comparing to my last update before Santorum dropped out…
- Romney has improved his best case from 278 electoral votes to 284 electoral votes
- Obama has improved his best case from 368 electoral votes to 379 electoral votes.
- The “everybody gets every state they are ahead in even slightly” result changes from Obama winning 328 to 210 to Obama winning 332 to 206.
All in all, the main result here is the race opening up since the last small doubts of Romney being the nominee were put to rest. The polls are tightening and more states are up for grabs. Obama still has a big advantage in the electoral college… for the moment. It has only been 17 days since Santorum dropped out. My expectation is that this race becomes closer as events play out over the next few months.
Edit 2012 May 2 13:10 UTC – Adjusted horizontal scale on Virginia Graph
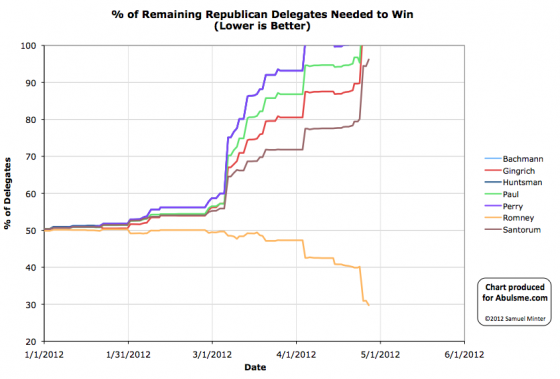
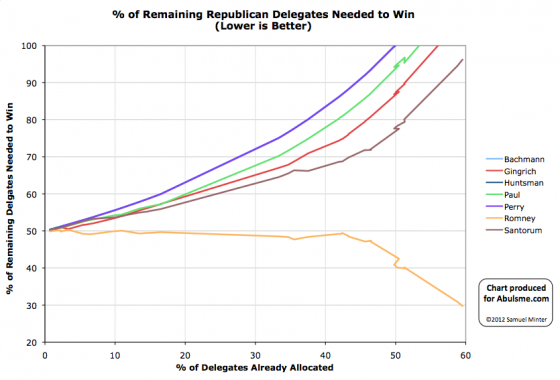
Charts from the Abulsme.com 2012 Republican Delegate Count Graphs page. When a candidate gets down to 0%, they have clinched the nomination. If they get above 100%, they have been mathematically eliminated. The first chart is by date, the second is by “% of Delegates Already Allocated”. These numbers include estimates of the eventual results of multi-stage caucus processes which will be refined as the later stages occur.
First of all, I just updated Wednesday’s post to add a correction. I had made the mistake of doubting Green Papers. I thought they had missed a delegate in their count. In fact, I had misinterpreted their statement about the change. I read their new total as a delta from the election, leading me to add an extra non-existant delegate to Romney’s total in Pennsylvania. My bad. Not theirs. Worse, my first draft of Wednesday’s post actually had it right, but I switched it to the wrong answer right before posting. Bleh. Today’s updates build off the corrected numbers for Wednesday rather than the original incorrect numbers I posted. (OK, it was only off by one delegate, which is tiny in the big scheme, but still, I’m annoyed at myself. :-) ) Anyway…
Three states with updates today, all via Green Papers as usual:
- Pennsylvania: Continued updates as more sources get indication on the preferences of the delegates elected in Pennsylvania. The previous Pennsylvania totals, after my correction mentioned above, had been… Romney 11, Paul 5, Gingrich 4, Santorum 3, 49 TBD. They are now Romney 27, Paul 5, Gingrich 3, Santorum 3, 34 TBD. Net for the day… Romney +16, Gingrich -1.
- Colorado: 2 delegates previously listed as uncommitted move to the Paul column. Net for the day, Paul +2. New total for the state Romney 14, Santorum 6, Paul 2, 14 TBD.
- Virgin Islands: 1 previously uncommitted delegate moves to the Romney column. So Romney +1
So total for the day: Romney +17, Paul +2, Gingrich -1
In terms of “% of remaining delegates needed to win”:
- Romney: 31.0% -> 29.7%
- Santorum: 94.4% -> 96.2%
More updates from Pennsylvania and other locations as they come in. Next batch of actual contests are North Carolina, Indiana and West Virginia on May 8th. I’m guessing Romney will get the 29.7% of delegates he needs there. Yawn.
You may have heard some reports that this already happened back at the beginning of April (CNN reported it for instance), but I can’t figure out any math to back that up other than someone mistakenly thinking that since more than 50% of the Republican delegates had been allocated, the same must have been true for the Democrats. Not true. Different calendars.
Anyway, while the fun has been on the Republican Side I have been diligently tracking the Green Papers numbers for the Democrats too. Their soft count does not include Democratic Superdelegates, but I think it is a pretty safe bet that 100% of the Democratic Superdelegates will vote for Obama at the convention, so I have been including those in my own counts for the Democrats. Given that assumption, plus Green Papers’ tally of the results from primaries and estimated results from caucuses, as of yesterday’s contests we have this delegate count:
Sorry Randall and Jim. I don’t think this year is going to be your year.
Anyway, 2776 delegates are needed to win the nomination on the Democratic side, and as of today, Obama exceeds that number.
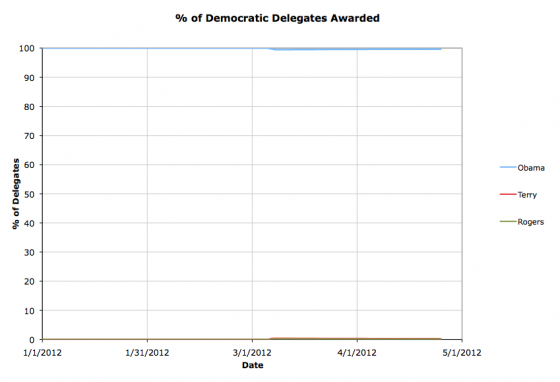
This is of course no surprise to anybody. If anything, it is surprising 10 delegates went to someone else.
The chart’s of Obama’s walk to victory follow, but they aren’t as interesting as the equivalents on the Republican side this year.
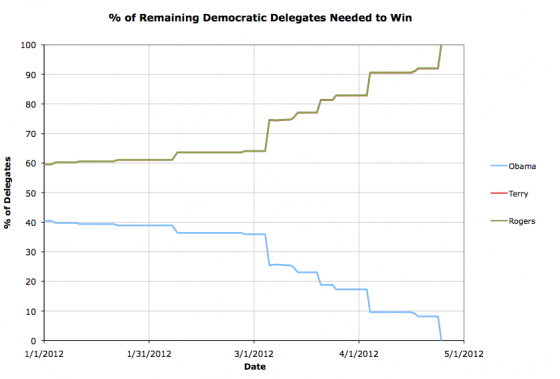
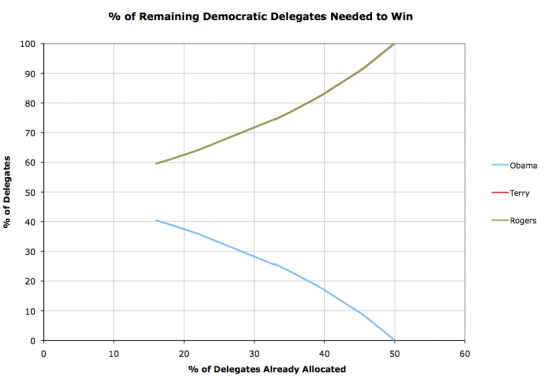
And two bonus charts I include for the Republicans on the 2012 Republican Delegate Count Graphs page but not on my blog updates…
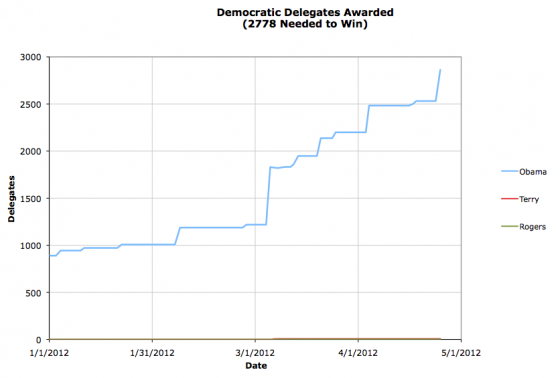
Of course, nothing is actually official until the convention. But I think we have a Democratic nominee. :-)
Note added 16:28 UTC: To be absolutely strict, if you look at Green Paper’s “Hard Count” which only includes delegates officially bound to Obama, and not estimates from caucuses, and not officially uncommitted delegates who unofficially are identified Obama delegates, and not any of the super delegates, Obama only has 1940 delegates, so still has some ways to go. But I think including the superdelegates, estimates from caucuses, and officially uncommitted delegates known to support Obama is completely reasonable. So I’m willing to call this clinched. :-)
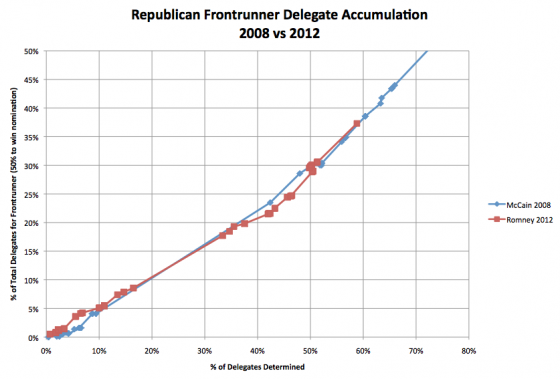
Not much to say here. The small gap between Romney’s rate of accumulating delegates compared to McCain’s in 2008 has completely closed. It is absolutely clear that any differences in perception on how fast Romney was “closing the deal” vs McCain were 100% due to the elongated calendar. When you look at things by % of delegates accumulated vs % of delegates allocated, the two years track each other very closely. In the early days of the campaign (before about 20% of the delegates) Romney was actually a bit ahead of McCain’s pace. From there though 50% or so, Romney was slightly behind McCain’s pace. The key word being slightly. And now they once again very closely match.
So that whole narrative about Romney not matching McCain’s performance in 2008… just completely not true in terms of the delegate races. It just seemed that way because everything happened in a comparatively compressed timeframe in 2008.
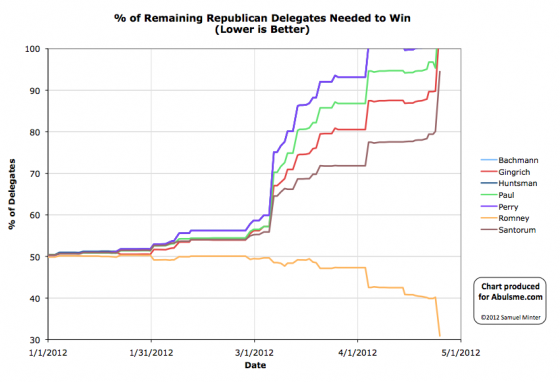
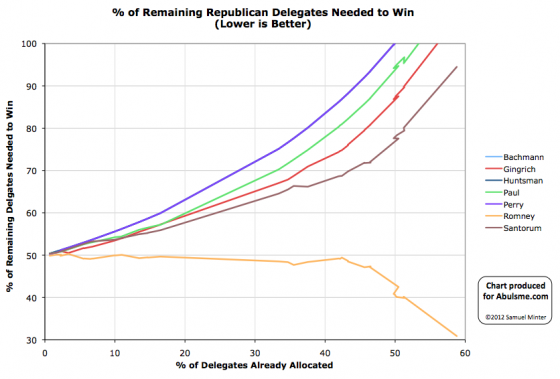
Charts from the Abulsme.com 2012 Republican Delegate Count Graphs page. When a candidate gets down to 0%, they have clinched the nomination. If they get above 100%, they have been mathematically eliminated. The first chart is by date, the second is by “% of Delegates Already Allocated”. These numbers include estimates of the eventual results of multi-stage caucus processes which will be refined as the later stages occur.
First big primary day in awhile, and of course Romney dominates.
- New York: Romney gets all 92 delegates from today. Total in NY now Romney 94, Gingrich 1
- Pennsylvania: This is the only tricky one of the day. Delegates were elected by name, not by presidential preference. So they are all officially uncommitted, but in general these delegates do support someone, it just takes more work to figure out who. Green Papers’ initial estimate from the primary is Romney +11, Paul +5, Gingrich +4, Santorum +3, and 39 uncommitted or unknown. That is obviously a lot of uncommitted/unknown, so there will probably be future updates as the preferences of those delegates become known. Also 10 at-large delegates won’t be chosen until June and two superdelegates have yet to publicly express a preference. The total in PA is now Romney 12, Paul 5, Gingrich 4, Santorum 3, TBD 48. (GP has Romney 11, TBD 49, but I think they forgot the one Romney superdelegate.)
- Connecticut: Romney wins all 25 delegates from the primary. New CT total: Romney 26, TBD 2
- Rhode Island: Romney gets 12 delegates from the primary, Paul gets 4. New RI Total: Romney 15, Paul 4
- Delaware: Romney gets all 17 delegates from the primary. No delegates had been allocated previously and none are left, so total is just Romney 17
So, for the day… Romney +157, Paul +9, Gingrich +4, Santorum +3. Romney gets 90.8% of the delegates today. Way more than the 40.2% he needed to stay on track to get to 1144.
And with this, Ron Paul and Newt Gingrich are both mathematically eliminated. More specifically, if they were now to get 100% of the remaining delegates they would still not get to 1144. In order to get to 1144, they would actually need to take delegates away from the other candidates, either through final results in caucus states being better for them than earlier estimates, or through actual defections. Both are possible. However, neither will happen in large enough numbers to change anything, absent something catastrophic that causes Romney to actually drop out. Uh, which is highly unlikely.
For the remaining two candidates, in terms of “% of remaining delegates needed to win”:
- Romney: 40.2% -> 30.9%
- Santorum: 80.1% -> 94.5%
So, theoretically Santorum could still catch up and win by getting 95% of the remaining delegates. Needless to say that won’t happen. His already long odds were made worse by suspending his campaign.
Meanwhile, neither Gingrich or Paul have suspended their campaigns. There are indications Gingrich might do so soon despite previous vows to stay in until Tampa. Paul has shown no signs of stopping.
The 31% of the remaining delegates Romney needs to wrap this up should be very easy for him to get. But we still have to wait for the calendar. So the march goes on…
Update 2012 Apr 27 12:34 UTC:
I was incorrect about the Pennsylvania count above and had misread Green Paper’s statement. In fact the new total in Pennsylvania was indeed Romney 11, not Romney 12. There were 10 new Romey delegates added to the count, not 11. They did not forget the one superdelegate. I just got twisted around thinking the 11 was a delta from the election instead of a new total, which would have left one delegate out. But it was indeed the new new total.
This makes the total for this day Romney +156, Paul +9, Gingrich +4, Santorum +3.
That gives Romney 90.7% of the delegates for the day instead of 90.8%.
This also changes Romney’s “% needed to win” to 31.0% instead of 30.9%. Santorum’s becomes 94.4% instead of 94.5%.
These changes are too small to be visible on the graph above, but will be reflected on future updates.
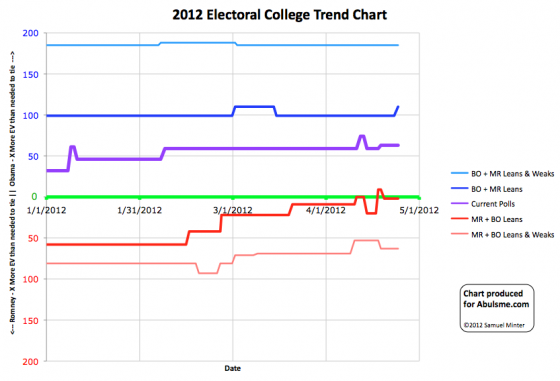
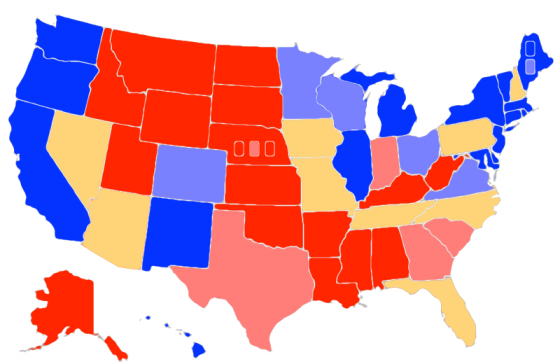
Chart and map from the Abulsme.com 2012 Electoral College Prediction page. Both assume Obama vs Romney with no strong third party candidate. Both show polling as it currently exists. Things will change before election day. Lines on the chart represent how many more electoral votes a candidate would have than is needed to tie under several different scenarios. Up is good for Obama, Down is good for Romney. On the map red is Romney, blue is Obama, gold states are too close to call.
Today Arizona moves from “Weak Romney” to “Lean Romney”, which makes it a swing state in our model.
Starting with this update, when a state changes status, I’ll also show the polling history for that state, so the trend is visible.
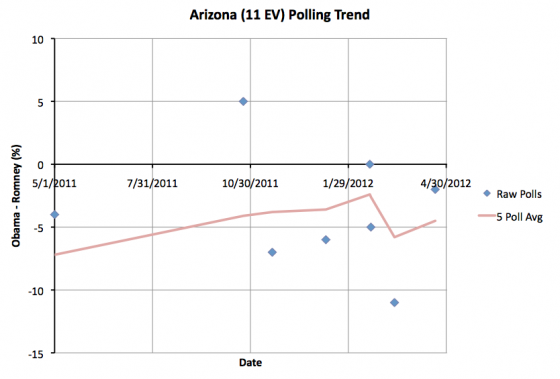
Looking at the above you can see that the last five polls goes back more than three months. You can see the spread within those five polls. Seeing this information visually can help interpret the movement being discussed. In this case, Arizona goes back into the swing state category after a relatively short period as a “Weak Romney” state (since March 16th). There are a couple data points that look like they might be outliers but which still affect the average. And of course you can see that the 5 poll average is just barely in the less than 5% swing state zone. The next poll could easily change the category again.
This change improves Obama’s “best case” where we give him all of the swing states.
|
Romney |
Obama |
| Romney Best Case |
271 |
267 |
| Current Status |
206 |
332 |
| Obama Best Case |
170 |
368 |
I’ll also note that movement in the national level polls toward Romney we talked about in previous updates seems to have been short lived. Looking at the RCP Poll Average Obama dropped from a lead of 5.3% on April 11th to a lead of only 1.7% on April 18th, but as of April 24th has rebounded to a lead of 3.7%. If the move toward Romney had been sustained, I would have expected to see a lot of state polls moving in Romney’s direction over the next few weeks. With the current trend that is no longer a safe assumption.
As things ebb and flow we will probably see movement toward Romney, but it won’t be the state polls catching up to the Romney spike of last week. It would be new changes based on new events.
But my general philosophy is that while the national polls are a leading indicator for the state polls and there is a strong correlation between the national popular vote and the electoral college, the real race is still the 50 separate state elections. That is how presidential elections work. So one gets a better picture of the dynamics by looking at the state numbers… although you need to be cognizant of the slower pace of state polling and interpret things accordingly. So we shall not speak of national level polls again.
Uh, unless there is something really interesting there to talk about. :-)
Edit 2012 May 2 13:08 UTC – Adjusted horizontal scale on Arizona graph
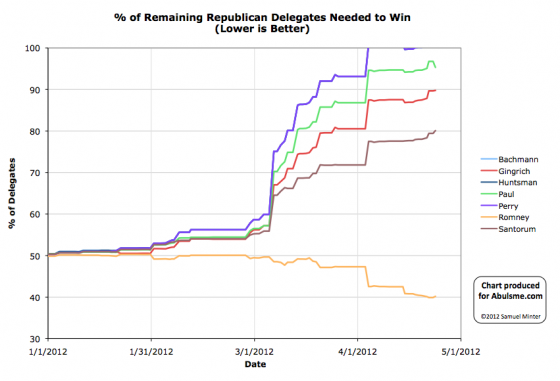
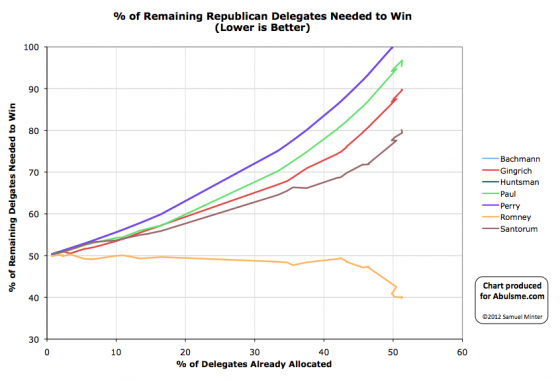
Charts from the Abulsme.com 2012 Republican Delegate Count Graphs page. When a candidate gets down to 0%, they have clinched the nomination. If they get above 100%, they have been mathematically eliminated. The first chart is by date, the second is by “% of Delegates Already Allocated”. These numbers include estimates of the eventual results of multi-stage caucus processes which will be refined as the later stages occur.
As I mentioned Sunday, Minnesota finished up Congressional District Conventions over the weekend. These determine 24 of the 40 delegates for Minnesota. (13 more will be determined at the state convention in a few weeks and the last three are superdelegates.) Of those 24 delegates, 20 went to Ron Paul, 2 went to Santorum, and the other 2 were filled by delegates with unknown preferences.
The Green Papers estimate for Minnesota’s 40 delegates prior to these results was Santorum 17, Paul 10, Romney 6, Gingrich 5 and 2 yet to be determined. Obviously given the CD Convention results, this estimate needed to be revised.
The way Green Papers did this was to use the CD results then allocate the 13 delegates which will be determined at the state convention according to the February caucus results. (Then add in the one super with a known preference.) I would have allocated by analogy to the CD results instead, but this works.
With that, the new estimate is Paul 24, Santorum 8, 2 Romney, 2 Gingrich, with 4 yet to be determined. This makes Minnesota the first state where Paul has “won” the state… meaning he has more delegates than anyone else according to current estimates. (He is also currently tied in the estimates for Iowa, but may pull ahead by the time that process finishes.)
In any case, these new estimates give us a net change for the day of Paul +14, Gingrich -3, Romney -4, Santorum -9.
This is a big enough victory for the day that Paul actually improves his position in the race… which is a pretty tall order for any non-Romney at this stage. For today anyway, Paul is on a pace to catch up and win the nomination! Of course, most days won’t be like today. Structurally they can’t be. But hey… Good day for Ron Paul! Just a bit too little and too late to actually do much other than embarrass Romney a little.
So, in terms of “% of Remaining Needed to Win”:
- Romney: 39.9% -> 40.2%
- Santorum: 79.4% -> 80.1%
- Gingrich: 89.7% -> 89.8%
- Paul: 96.8% -> 95.3%
Next up… actual new primaries! New York, Pennsylvania, Connecticut, Rhode Island and Delaware should all have results in my next update. It will be interesting to see how big the non-Romney delegate haul is. At this point, votes for non-Romneys are essentially anti-Romney protest votes and Paul die-hards. Romney needs 40.2% of the delegates to be on pace to win. With Santorum out and Gingrich’s campaign in sleeper mode, this should be a fairly easy target. If he doesn’t manage that… he’ll still be the nominee… but people would call out his continued failure to wrap this up.
He will almost certainly get the 40% he needs though. Who are we kidding, this is over.
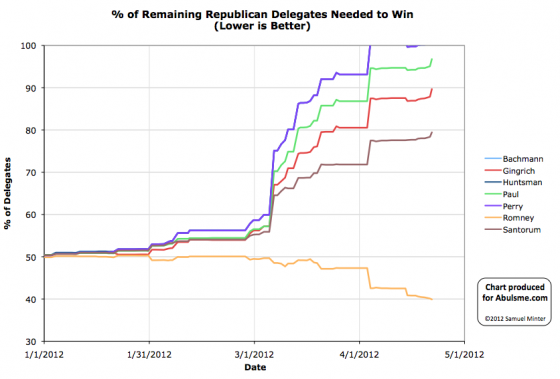
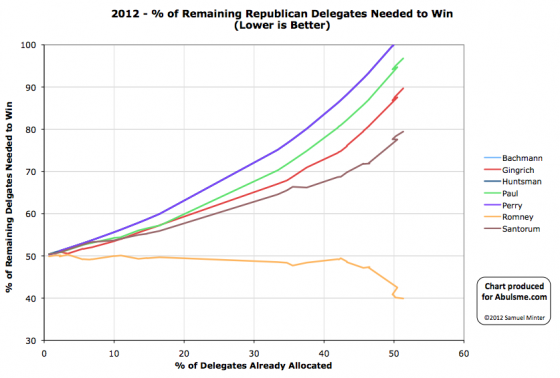
Charts from the Abulsme.com 2012 Republican Delegate Count Graphs page. When a candidate gets down to 0%, they have clinched the nomination. If they get above 100%, they have been mathematically eliminated. The first chart is by date, the second is by “% of Delegates Already Allocated”. These numbers include estimates of the eventual results of multi-stage caucus processes which will be refined as the later stages occur.
We finally have some results that aren’t just a handful of superdelegates, or minor revisions to a previous state’s tentative results. We have actual new results coming out of a state’s process. In this case, Missouri just finished its Congressional District Conventions, which allocate 24 of the state’s 52 delegates. (The rest will be determined at the State Convention on June 2, or are superdelegates.)
So… how did it turn out?
Romney 12, Santorum 7, Paul 4, Gingrich 1
With 50% of the delegates, Romney exceeds the 40.1% of the delegates he needed to be on pace to get to 1144. None of the rest come even close to the percentages they needed.
In terms of “% of Remaining Needed to Win”:
- Romney: 40.1% -> 39.9%
- Santorum: 78.4% -> 79.4%
- Gingrich: 87.9% -> 89.7%
- Paul: 95.1% -> 96.8%
Now, I’m sure Romney would have liked to have gotten significantly more than 50% here. But 50% will do. He’s comfortably on track to get to where he needs to be, and of course everybody else is still racing toward elimination.
Having said that, we should have the results from Minnesota’s Congressional District Conventions soon. Green Papers hasn’t finalized their results for Minnesota yet, and they haven’t been updating their totals based on the partial results that have been trickling out since March 31st, but they have been updating their notes on the process and all the indications are that… wait for it…
Ron Paul will walk away with more than 83% of the delegates from this stage of the Minnesota process… with Romney completely shut out, getting no delegates at all. Of course, Paul would need to be getting about 97% to be on a pace to catch up and win, but still… 83% is pretty impressive.
That is getting ahead of things though. We’ll talk about Minnesota once Green Papers updates their delegate total from the initial estimates they made after the caucuses in February. For the moment, that hasn’t happened yet.
(Edited 2012 Apr 24 05:44 UTC to add my standard intro paragraph which I had forgotten when I first posted this.)
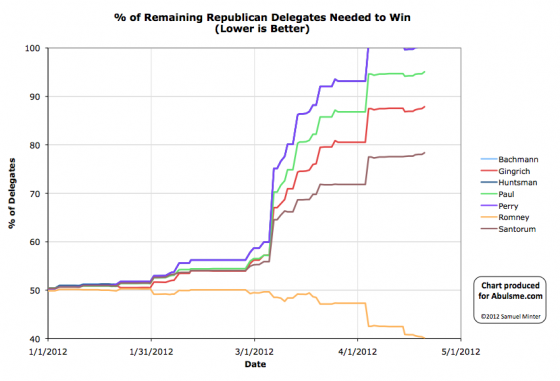
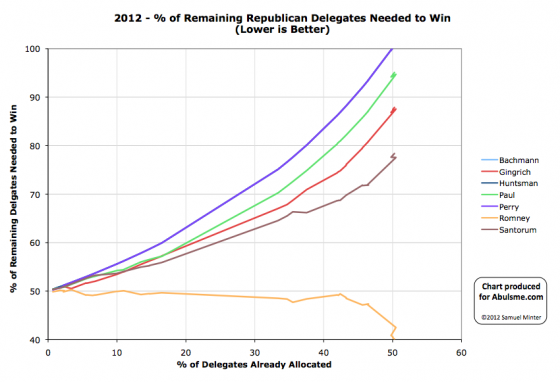
Charts from the Abulsme.com 2012 Republican Delegate Count Graphs page. When a candidate gets down to 0%, they have clinched the nomination. If they get above 100%, they have been mathematically eliminated. The first chart is by date, the second is by “% of Delegates Already Allocated”. These numbers include estimates of the eventual results of multi-stage caucus processes which will be refined as the later stages occur.
On Friday Romney had a meeting with the RNC, all of whom are automatic delegates to the convention and most of whom are superdelegates. (Some are not because their votes are bound by the primary or caucus results in their states.) If they wanted a picture with Romney, they had to sign a form saying they promise to support Romney at the convention. There are reports that over 100 of those present signed the form. Some of them checked a box asking that this fact not be made public because of elections they are running in, etc. Others said this could be made public. The Romney campaign hasn’t released those names yet. Maybe next week. So potentially there will be a big jump in Romney’s superdelegate numbers sometime very soon. In the mean time, DCW was able to verify five more superdelegates publicly endorsing Romney.
In terms of “% of remaining delegates needed to win”:
- Romney: 40.4% -> 40.1%
- Santorum: 78.0% -> 78.4%
- Gingrich: 87.5% -> 87.9%
- Paul: 94.7% -> 95.1%
And the march to 1144 continues. Romney now has 688. We still have a decent way to go.
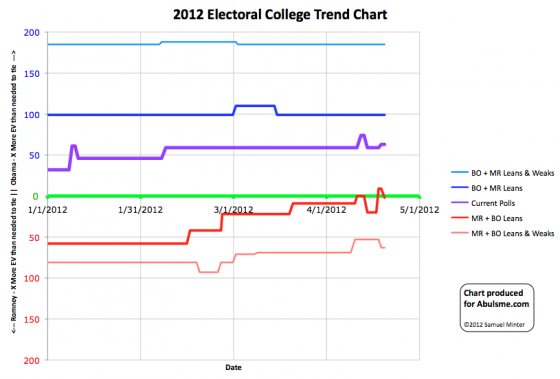
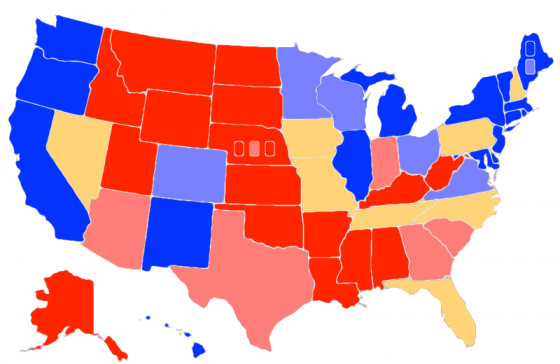
Chart and map from the Abulsme.com 2012 Electoral College Prediction page. Both assume Obama vs Romney with no strong third party candidate. Both show polling as it currently exists. Things will change before election day. Lines on the chart represent how many more electoral votes a candidate would have than is needed to tie under several different scenarios. Up is good for Obama, Down is good for Romney. On the map Red is Romney, Blue is Obama, Gold States are too close to call.
Two changes today based on new polls added to my master spreadsheet. And they both change the inventory of swing states, so important changes at that! Here are the details:
Florida (29 electoral votes): Just two days ago the five poll average moved Obama’s lead in Florida to over 5% (5.2%) and thus moved the state out of swing state status and into the “Weak Obama” category. Well, that didn’t last very long. Today’s update puts Obama’s 5-poll lead at 4.0%, so the state goes back into the “Lean Obama” category and is once again classified as a swing state for our model. Florida is big at 29 electoral votes, so makes a big difference in the electoral math.
Ohio (18 electoral votes): Meanwhile, Obama’s lead in Ohio goes above 5% to 5.2% in the five poll average. This removes Ohio from the swing state pool and moves it into the “Weak Obama” group. This means Obama has a decent lead at the moment, but not so big that it wouldn’t be worth Romney’s time to try to attack that lead and pull Ohio back to being a close contest. Ohio is one of those states that everyone expects to be close, so don’t be surprised if, like Florida, Ohio doesn’t stay in this status too long.
All and all since Florida is “worth more” than Ohio, today’s moves are good for Romney. And in fact, this once again makes it so if Romney wins all the swing states, he wins the election…
|
Romney |
Obama |
| Romney Best Case |
271 |
267 |
| Current Status |
206 |
332 |
| Obama Best Case |
170 |
368 |
While some states have moved in both directions, if we look at all the changes in April so far, Obama is still in a better position than he was at the beginning of the month. We still haven’t had enough state polls to detect the recent move in Romney’s direction over the last week and a half. If Romney hold his position in the national polls, expect more states to move in Romney’s direction over the next few weeks.
|
|


