This is the website of Abulsme Noibatno Itramne (also known as Sam Minter).
Posts here are rare these days. For current stuff, follow me on Mastodon
|
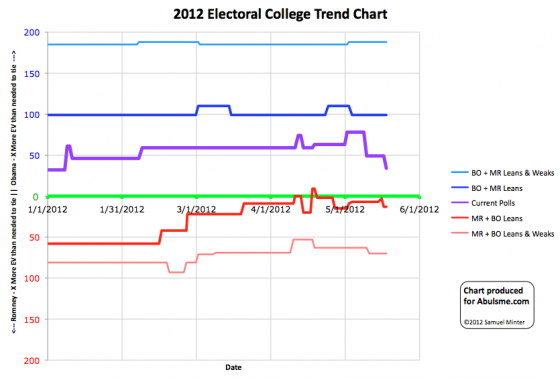
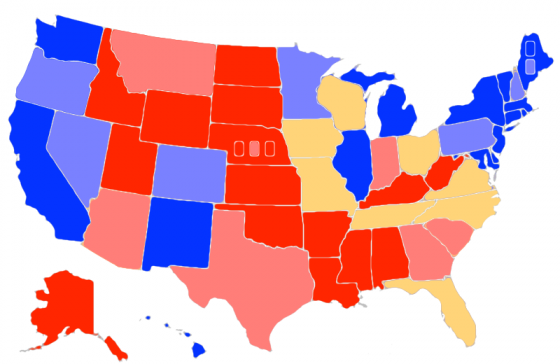
Chart and map from the Abulsme.com 2012 Electoral College Prediction page. Both assume Obama vs Romney with no strong third party candidate. Both show polling as it currently exists. Things will change before election day. On the map red is Romney, blue is Obama, gold states are too close to call. Lines on the chart represent how many more electoral votes a candidate would have than is needed to tie under several different scenarios. Up is good for Obama, Down is good for Romney.
One state changes status today:
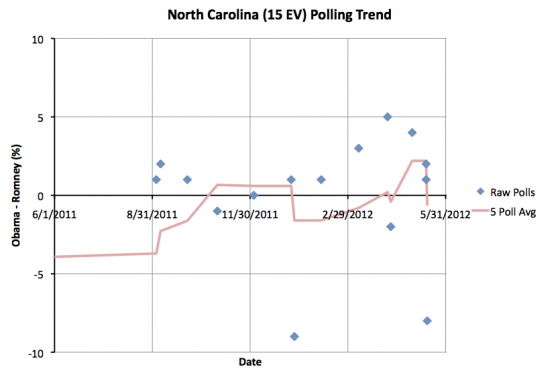
North Carolina moves from Obama up by 2.0% to Romney up by 0.6%. Either way, this is too close to call. North Carolina remains a swing state. Now, the latest poll actually has Romney ahead by 8%. This might be the start of a larger move toward Romney. Or maybe it is an outlier. It is too early to tell. For now, North Carolina is now a swing state that leans ever so slightly to Romney.
Since North Carolina remains too close to call, this doesn’t change either candidate’s best case scenarios, which represent the range of reasonably possible results based on current state polling. The current line drops a nice ways in Romney’s direction though.
|
Romney |
Obama |
| Romney Best Case |
276 |
262 |
| Current Status |
235 |
303 |
| Obama Best Case |
170 |
368 |
Glancing at the chart, it looks like there has been a nice move in Romney’s direction lately. Lets look at some specific numbers and compare to one month ago. One month ago was the first time that the state polls showed Romney’s best case being to lose. Things clearly look much better for him today.
On April 18th, Romney’s best case showed him losing 260 to 278. Now he wins 276 to 262. He has moved 16 electoral votes (net) back into contention that a month ago seemed out of reach.
On the current line, a month ago Obama was winning 328 to 210. Now he is only winning by 303 to 235. Over the last month Romney has pulled a full 25 electoral votes (net) over the line toward him.
As for Obama’s best case… no change. The needle hasn’t moved at all. Obama hasn’t managed to pull more electoral votes into being competitive, nor have any moved out of reach.
So the movement has definitely been in Romney’s direction. If he keeps it up, we’ll start to see the map looking much more competitive soon.
By comparison, look at 4 years ago… the two best cases were much more symmetric around the tie line. The candidates were more evenly matched and the range of possibilities was not really favoring either candidate. It was clearly a wide open race four years ago. Having a lot more swing states helped.
The “current” status looked very similar to today’s though… we had McCain 302, Obama 236. Reverse the parties, and we are almost exactly in the same place we are today. Of course McCain did not go on to win. One should look at Obama’s current lead in the model with that in mind. There is still a long time until November.
Edit 2012 May 20 06:39 UTC – Fixed Map, SC was incorrectly colored as a swing state, it is now correctly colored as “Weak Romney”.
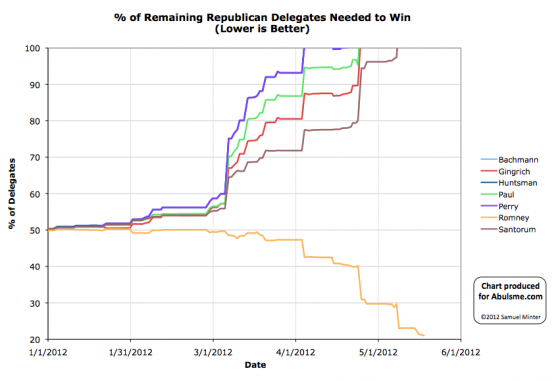
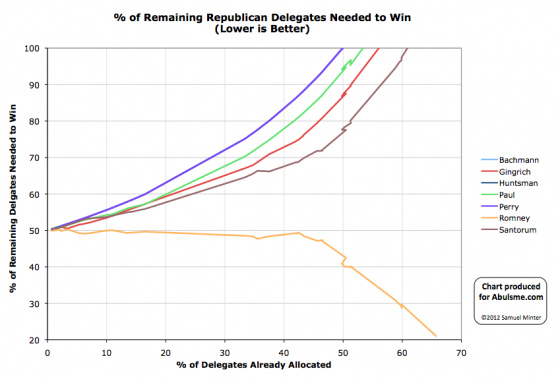
Charts from the Abulsme.com 2012 Republican Delegate Count Graphs page. When a candidate gets down to 0%, they have clinched the nomination. If they get above 100%, they have been mathematically eliminated. The first chart is by date, the second is by “% of Delegates Already Allocated”. These numbers include estimates of the eventual results of multi-stage caucus processes which will be refined as the later stages occur.
Via DCW we have two more superdelegates for Romney today.
This moves Romney’s % of remaining needed to win from 21.2% to 21.0%.
He needs 165 more delegates to wrap this up.

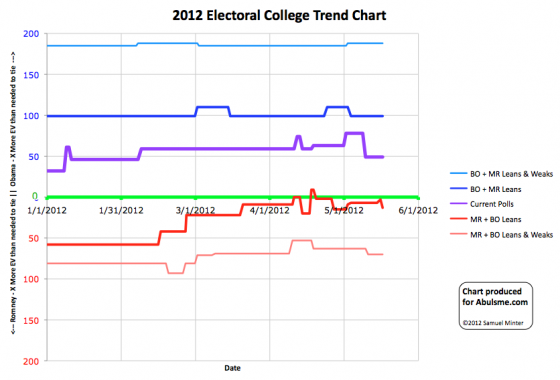
Chart and map from the Abulsme.com 2012 Electoral College Prediction page. Both assume Obama vs Romney with no strong third party candidate. Both show polling as it currently exists. Things will change before election day. On the map red is Romney, blue is Obama, gold states are too close to call. Lines on the chart represent how many more electoral votes a candidate would have than is needed to tie under several different scenarios. Up is good for Obama, Down is good for Romney.
One state changes status today, and it is a move in Romney’s direction:
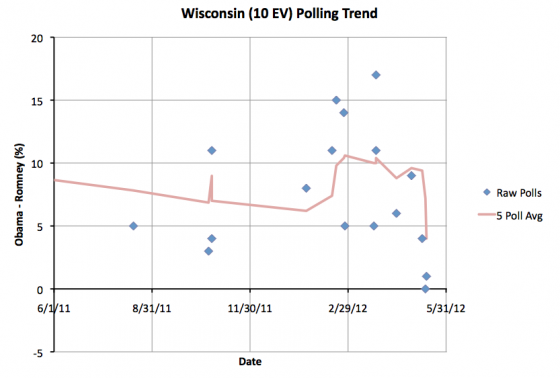
It seems like it was just yesterday when I was saying that if Romney pulled Wisconsin back toward being competitive it would open up more paths for victory to him. And boom, today Obama’s lead in the five poll average in Wisconsin drops from 7.2% down to 4.0%.
Looking at the history here, this is a veritable collapse for Obama in Wisconsin. Up through mid-April I’d classified Wisconsin as “Strong Obama” because his leads there were over 10%. There was even one poll showing him up by 17%! On April 19th the lead dropped to below 10% and I reclassified Wisconsin as “Weak Obama”. But the trend in May has been decidedly and dramatically toward Romney. The two most recent polls show a tie and a 1% Obama lead. There haven’t yet been any Wisconsin polls showing Romney actually ahead, but the margin is now clearly small enough that Wisconsin could easily go either way.
So we add Wisconsin into Romney’s best case scenario:
|
Romney |
Obama |
| Romney Best Case |
282 |
256 |
| Current Status |
220 |
318 |
| Obama Best Case |
170 |
368 |
This makes Romney’s path to victory much more flexible. Florida (29), Ohio (18) and North Carolina (15) are still “must win”. If any one of those went to Obama, Romney would be done. If he lost Virginia (13) we’d have a 269-269 tie, which would probably result in a messy Romney victory in the House of Representatives. But with the new set of swing states, he could afford to lose any one of Tennessee (11), Missouri (10), Wisconsin (10), or Iowa (6) and still win.
This move in Wisconsin is by far the most dramatic move we’ve seen toward Romney yet in the state polls. As more polls come in for other states, the question will be if this move in Wisconsin is the first sign of more general moves toward Romney in many states, or if there is something Wisconsin specific going on here… perhaps spillover from the Walker recall battle or some such.
A state moving all the way from “Strong” support of a candidate to being a swing state in less than a month though is a pretty dramatic move. If Romney can produce that kind of motion in a few more states, this analysis will very quickly start showing a much more competitive race!
Edit 2012 May 20 06:38 UTC – Fixed Map, SC was incorrectly colored as a swing state, it is now correctly colored as “Weak Romney”.
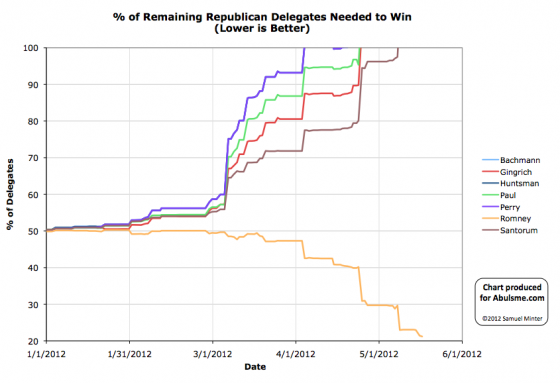
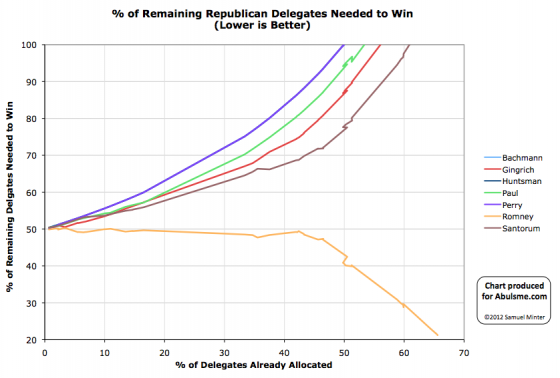
Charts from the Abulsme.com 2012 Republican Delegate Count Graphs page. When a candidate gets down to 0%, they have clinched the nomination. If they get above 100%, they have been mathematically eliminated. The first chart is by date, the second is by “% of Delegates Already Allocated”. These numbers include estimates of the eventual results of multi-stage caucus processes which will be refined as the later stages occur.
Today we have some updates to yesterday’s Oregon results.
First of all, it turns out Santorum gets one more delegate than it looked like yesterday, and Gingrich gets one less.
Second, the remaining two Oregon superdelegates stated they will echo the primary results and support Romney.
New summary for Oregon: Romney 21, Santorum 3, Paul 3, Gingrich 1
So net for the day: Romney +2, Santorum +1, Gingrich -1
So Romney’s % of remaining needed to win drops from 21.4% to 21.2%.
He needs 167 more delegates to get to the 1144 magic number by my estimate.
(My estimate uses the Green Papers Soft Count plus the DCW Superdelegate Count).
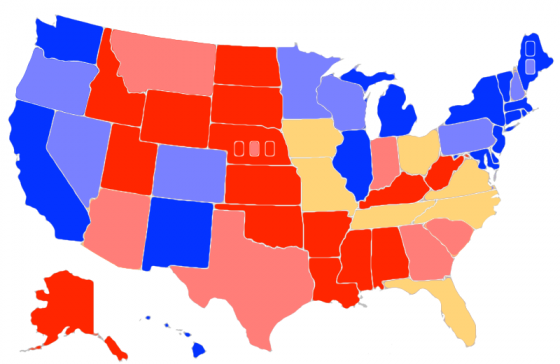
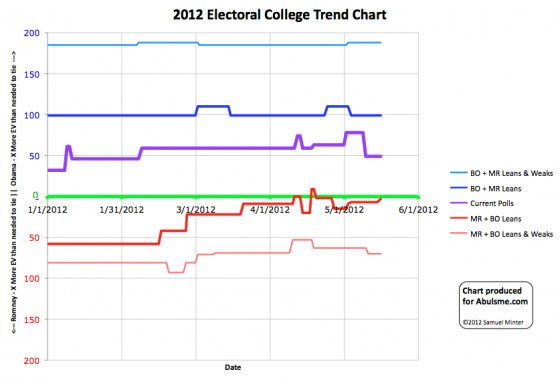
Chart and map from the Abulsme.com 2012 Electoral College Prediction page. Both assume Obama vs Romney with no strong third party candidate. Both show polling as it currently exists. Things will change before election day. On the map red is Romney, blue is Obama, gold states are too close to call. Lines on the chart represent how many more electoral votes a candidate would have than is needed to tie under several different scenarios. Up is good for Obama, Down is good for Romney.
One state changes status today. This time it is a move toward Obama:
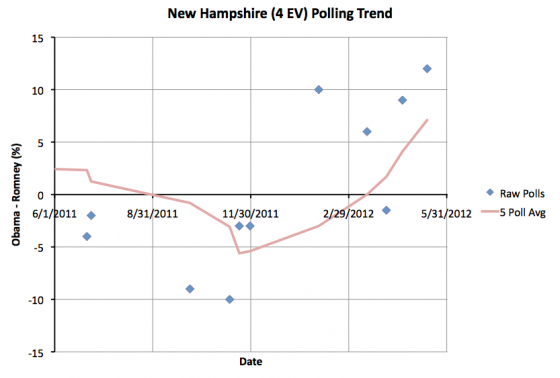
The five poll average goes from an Obama lead of 4.1%, which we consider close enough to call the state a swing state, to a 7.1% lead, which we consider large enough to call New Hampshire a “Weak Obama” state. So it gets colored blue for now.
Since New Hampshire is no longer in our swing category, we take the possibility of winning it out of Romney’s Best case. This leaves us with:
|
Romney |
Obama |
| Romney Best Case |
272 |
266 |
| Current Status |
220 |
318 |
| Obama Best Case |
170 |
368 |
Romney’s new best case has him with just 3 more electoral votes than a 269-269 tie. This leaves his path to victory very narrow indeed. Assuming he retains all of the states he is ahead by more than 5% in, he would then have to still win ALL of the swing states that are currently too close to call. Florida (27), Ohio (18), North Carolina (15), Virginia (13), Tennessee (11), Missouri (10), and Iowa (6) all become must win states. Lose any one of those, and the election is lost.
Of course, there is still plenty of time to pull more states that are currently “Weak Obama” states back into the swing state category. Pull Pennsylvania (20), Minnesota (10) or Wisconsin (10) back from Obama and make them competitive, and all of a sudden there would be a lot more ways to win. Colorado (9), Oregon (7), Nevada (6) or New Hampshire (4) would help too, just not as much. I suppose a play might even be made at Maine’s 2nd Congressional District (1). At the moment though, Obama has healthy leads in those states (and the CD).
Edit 2012 May 20 06:35 UTC – Fixed Map, SC was incorrectly colored as a swing state, it is now correctly colored as “Weak Romney”.
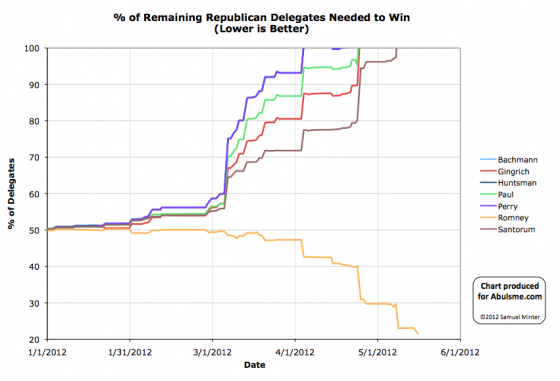
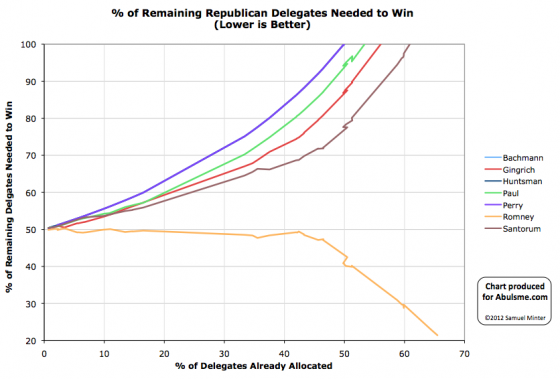
Charts from the Abulsme.com 2012 Republican Delegate Count Graphs page. When a candidate gets down to 0%, they have clinched the nomination. If they get above 100%, they have been mathematically eliminated. The first chart is by date, the second is by “% of Delegates Already Allocated”. These numbers include estimates of the eventual results of multi-stage caucus processes which will be refined as the later stages occur.
Today we have results from Oregon. Prior to today we had one superdelegate in Oregon for Romney and 27 TBD. We now have Romney 19, Paul 3, Santorum 2, Gingrich 2, TBD 2. So for the day Romney +18, Paul +3, Santorum +2, Gingrich +2.
Romney got 72.0% of today’s delegates, way more than the 23.0% he needed in order to be on track to clinch the nomination. So the march goes on.
Overall totals at this point: Romney 975, Santorum 260, Gingrich 145, Paul 117, TBD 789
I should also mention that a couple days ago Paul announced he would not be campaigning in the remaining primary states. Contrary to some of the headlines, he did not suspend his campaign like Santorum and Gingrich have. His campaign is still actively working the delegate process in the states where that is possible. He just isn’t dedicating any resources to trying to win votes in the remaining states where he has no chance of winning. Any efforts are concentrated on the actual process of delegate selection, which has basically been his strategy all along. Effectively though, by the nature of the memo the campaign put out, regardless of what was intended, the effect is that what little attention was still being given to him now fades away too. Especially since he also essentially promised to “behave” at the convention and not cause trouble.
So we now just wait for Romney to finish collecting the last 169 delegates he needs to win. Next up, Kentucky and Arkansas on the 22nd.
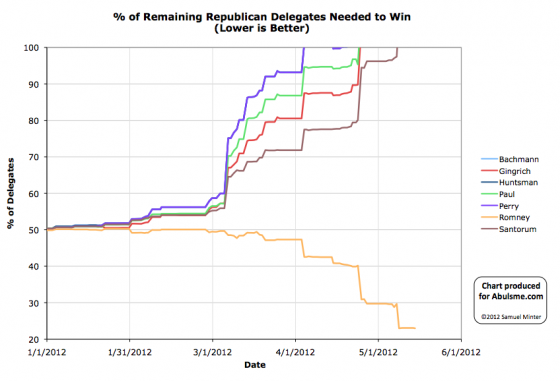
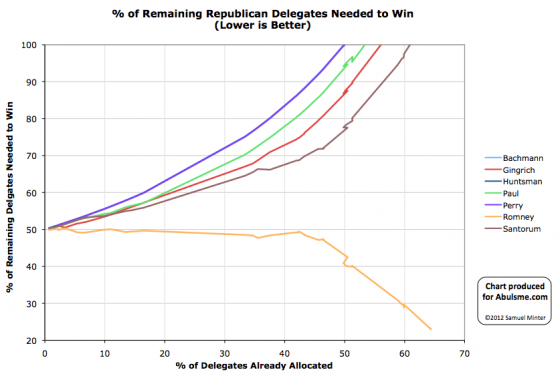
Charts from the Abulsme.com 2012 Republican Delegate Count Graphs page. When a candidate gets down to 0%, they have clinched the nomination. If they get above 100%, they have been mathematically eliminated. The first chart is by date, the second is by “% of Delegates Already Allocated”. These numbers include estimates of the eventual results of multi-stage caucus processes which will be refined as the later stages occur.
Very minor one delegate update in West Virginia. In fact, today’s update is the mirror image of the update we made on May 10. On that day a delegate listed as Romney moved over to the TBD column. Today, a delegate from the TBD column moves to the Romney column. West Virginia is now Romney 24, Santorum 2, TBD 5.
So +1 delegate for Romney today. He must be thrilled.
In terms of % of remaining needed to win, Romney goes from 23.1% to 23.0%.
Oregon is voting in a few hours, so there may be an ever so slightly more interesting update tomorrow.
Edit 2012 May 15 15:43 UTC – Nebraska too!
Edit 2012 May 16 14:33 UTC – Although Nebraska’s vote was non-binding and thus no delegates were awarded.
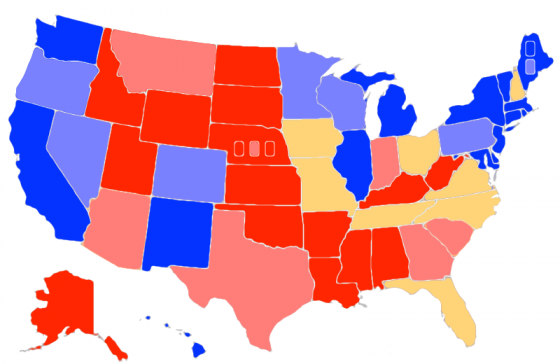
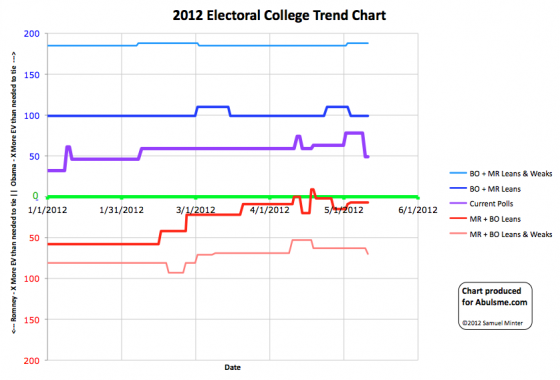
Chart and map from the Abulsme.com 2012 Electoral College Prediction page. Both assume Obama vs Romney with no strong third party candidate. Both show polling as it currently exists. Things will change before election day. On the map red is Romney, blue is Obama, gold states are too close to call. Lines on the chart represent how many more electoral votes a candidate would have than is needed to tie under several different scenarios. Up is good for Obama, Down is good for Romney.
One state changing status today, and once again it is a move in Romney’s direction:
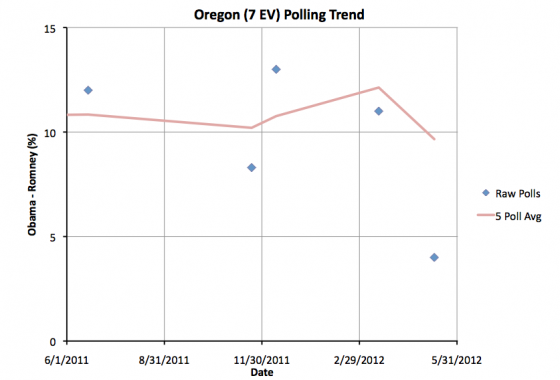
Obama’s lead in the five poll average drops from 12.1% to 9.7%. So we no longer classify it as “Strong Obama”, but rather “Weak Obama”. Now, the average is still well over 5% (despite the most recent poll) so Oregon is still nowhere near being a swing state. In the last year there hasn’t been a single poll showing Romney leading in Oregon. But the lead is no longer so big that Obama would be safe completely ignoring the state. Romney could cause some heartburn for Obama there if he put some effort into the state.
There have also only been five Oregon polls in the last year. If additional polling shows the current status is closer to the most recent poll than the previous four, and Romney continues to make gains, then Oregon may well move into swing state status later in the race.
Since Oregon is neither entering or leaving swing state status, the summary stays the same:
|
Romney |
Obama |
| Romney Best Case |
276 |
262 |
| Current Status |
220 |
318 |
| Obama Best Case |
170 |
368 |
Edit 2012 May 20 06:30 UTC – Fixed Map, SC was incorrectly colored as a swing state, it is now correctly colored as “Weak Romney”.
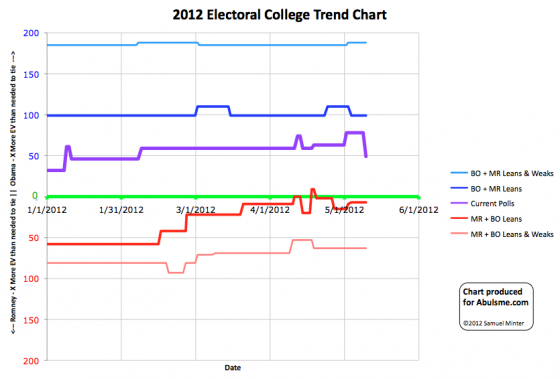
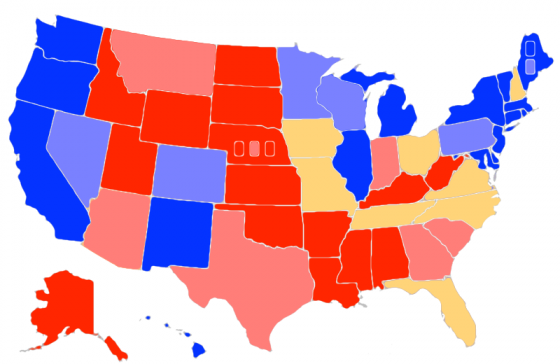
Chart and map from the Abulsme.com 2012 Electoral College Prediction page. Both assume Obama vs Romney with no strong third party candidate. Both show polling as it currently exists. Things will change before election day. On the map red is Romney, blue is Obama, gold states are too close to call. Lines on the chart represent how many more electoral votes a candidate would have than is needed to tie under several different scenarios. Up is good for Obama, Down is good for Romney.
One state changes status today, and it is a big one!
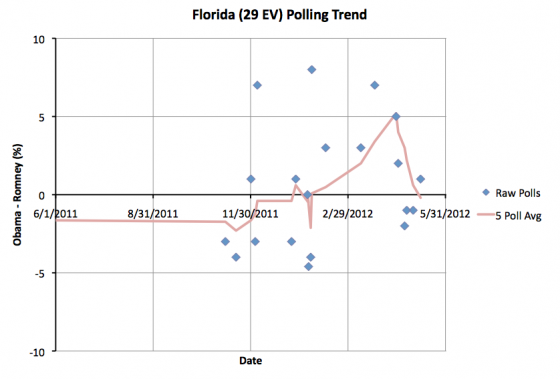
In my five poll average Florida moves from Obama up by 0.6% to Romney up by 0.2%. In either case, the bottom line is that Florida is too close to call and could go either way. The recent trend has been toward Romney though. We’ll see if Romney can pull Florida closer toward him, or if it remains a super close swing state. (Which is kind of what everyone expects.)
Anyway, a big state flips to the Romney side. This effects the “current” line by moving 29 electoral votes in Romney’s direction, but the “best cases” representing the range of possible outcomes stay the same:
|
Romney |
Obama |
| Romney Best Case |
276 |
262 |
| Current Status |
220 |
318 |
| Obama Best Case |
170 |
368 |
I had said I wouldn’t mention national level polls much, but there has been a big enough move there lately to warrant another mention. In the last couple of weeks there has been a substantial move toward Romney in the national polls, with the RCP Average dipping to an Obama lead of as low as 0.2% on May 8th, although it is back to 1.3% as of today. So why do the state numbers still show a massive Obama lead?
There are two answers, one is of course that the election is based on the states, not the national popular vote, and they do not always move in lockstep. But frankly, they DO usually move together, and only tend to diverge much in really close situations. The electoral college just usually shows an “amplified” version of the separation between the candidates in the national popular vote.
The more important factor right now is the second answer. State polls are still slow. There are new national polls every day. Meanwhile even important close states like Florida are still getting polled only once a week or so. Most states are polled even less frequently. This means that any state by state analysis will take longer to react to changes.
If the race narrows significantly and stays narrowed, the state numbers will start showing that soon enough. (And state polling in close states will get increasingly frequent as we approach the election, so this lag will decrease dramatically later in the year.)
Edit 2012 May 10 15:56 UTC – Moved summary box earlier in post.
|
|


