|
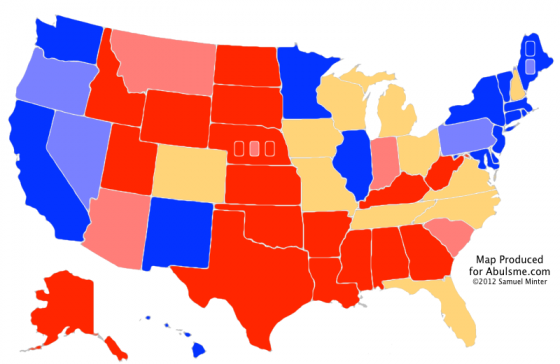
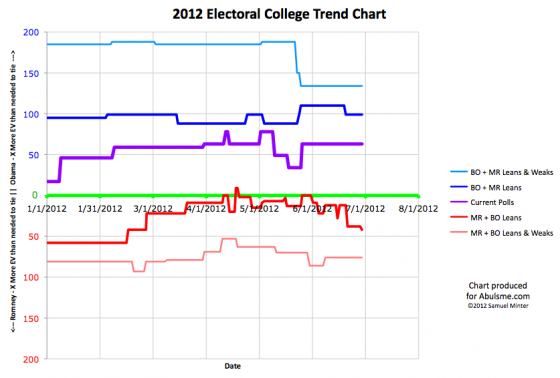
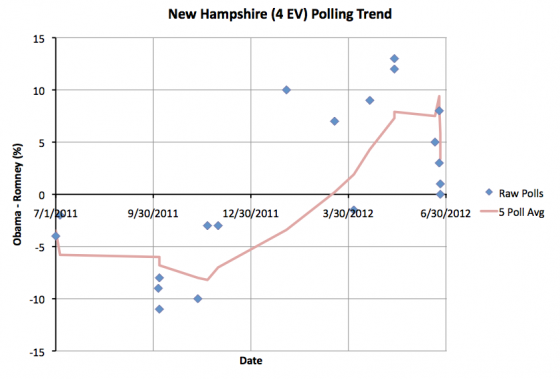
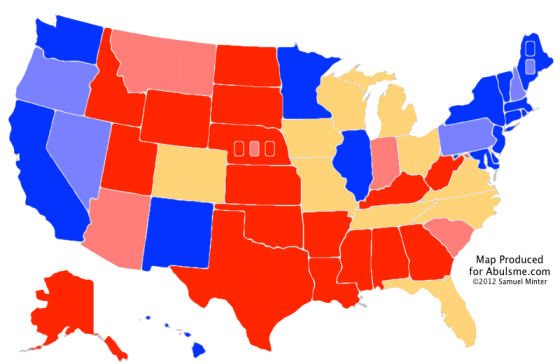
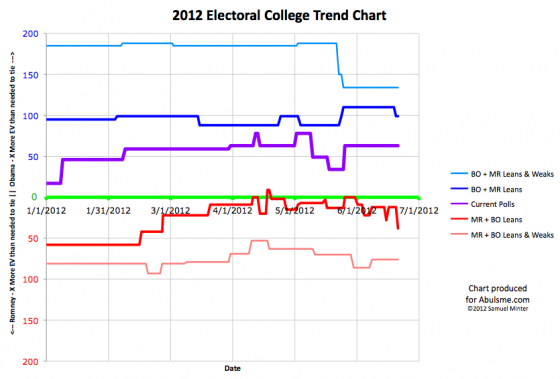
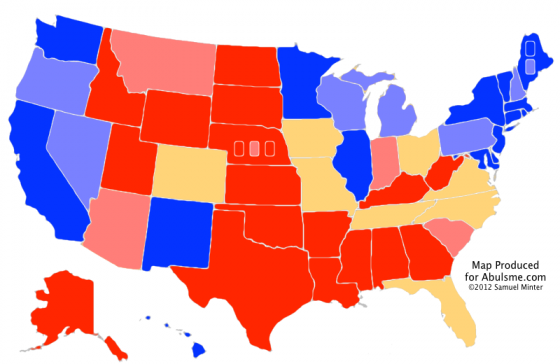
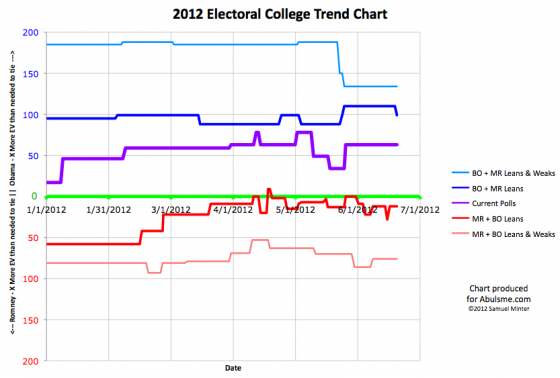
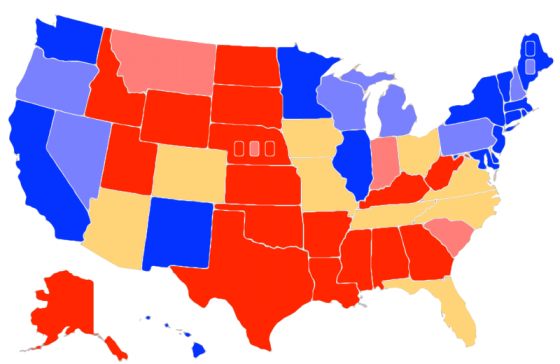
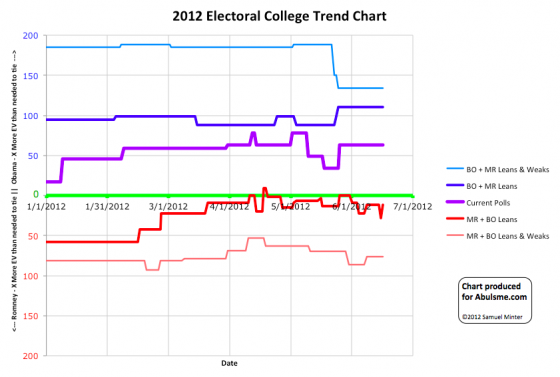
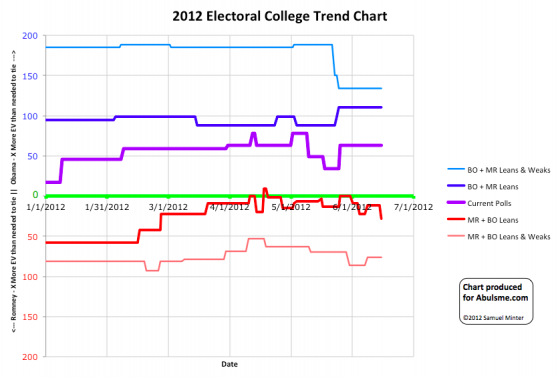
Chart and map from the Abulsme.com 2012 Electoral College Prediction page. Both assume Obama vs Romney with no strong third party candidate. Both show polling as it currently exists. Things will change before election day. On the map red is Romney, blue is Obama, gold states are too close to call. Lines on the chart represent how many more electoral votes a candidate would have than is needed to tie under several different scenarios. Up is good for Obama, Down is good for Romney. One state moves today, and once again it is a move in Romney’s direction: New Hampshire gets a flurry of polls at the end of June and it becomes clear that the race has gotten a lot closer since the last round of polling in May. Obama’s lead in the five poll average drops under 5% to 3.4%, so I once again classify New Hampshire as too close to call, which means I now include the possibility of winning New Hampshire in Romney’s best case:
As we near the end of June, we see that it has been a very good month for Romney in this analysis. A month ago on May 29th, Romney’s best case was to tie (269 to 269). His best case is now to win by 84 electoral votes (311 to 227). Slowly but surely, he has been moving “Weak Obama” states where Obama had a lead over 5%, into the zone where those states are close enough to be within reach. Michigan (16), Virginia (13), Colorado (9), and New Hampshire (4) all made this move in the last month. He has also made some movement in reducing Obama’s best case by increasing his lead in Arizona (11). On May 29th Obama’s best case was to win by 220 electoral votes (379 to 159). Now it is to win by only 198 electoral votes (368 to 170). So Romney is doing what he needs to be doing, getting more states into play, giving himself many more “paths to victory” and thus a lot more flexibility into how to attack the electoral college. It is worth noting though that our third line, the one representing what happens if everybody wins every state where they are even slightly ahead in the polls, has not moved at all in the last month! A month ago it showed Obama winning 332 to 206, and it shows the same thing today. So while Romney has been reducing Obama’s lead in a variety of states, he hasn’t yet started moving states “over the line” toward him. Perhaps in July.
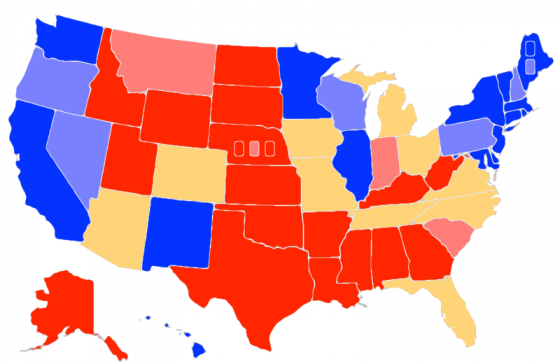
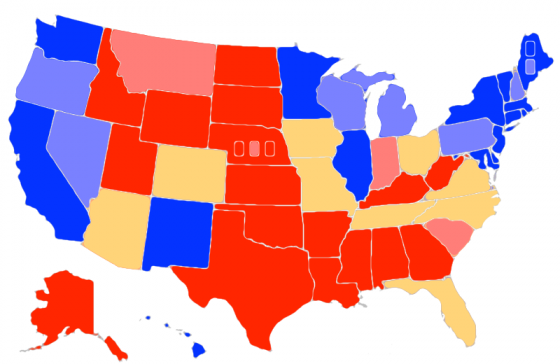
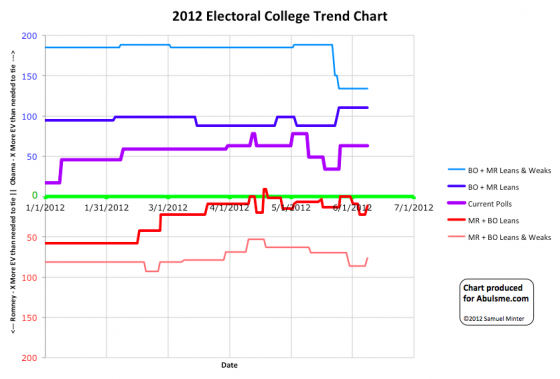
Chart and map from the Abulsme.com 2012 Electoral College Prediction page. Both assume Obama vs Romney with no strong third party candidate. Both show polling as it currently exists. Things will change before election day. On the map red is Romney, blue is Obama, gold states are too close to call. Lines on the chart represent how many more electoral votes a candidate would have than is needed to tie under several different scenarios. Up is good for Obama, Down is good for Romney. Two states moving today, both toward Romney:
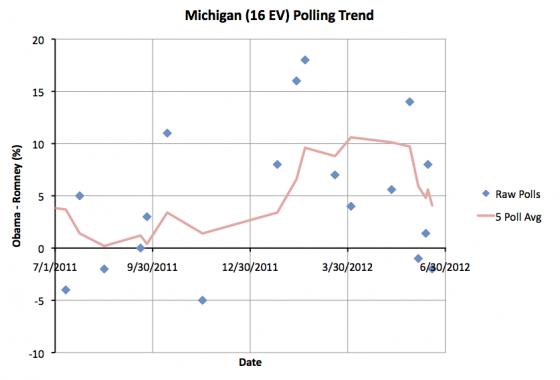
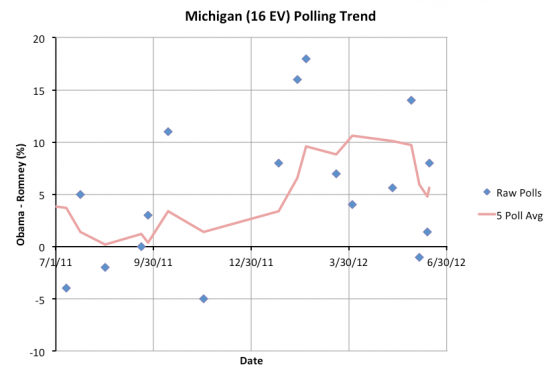
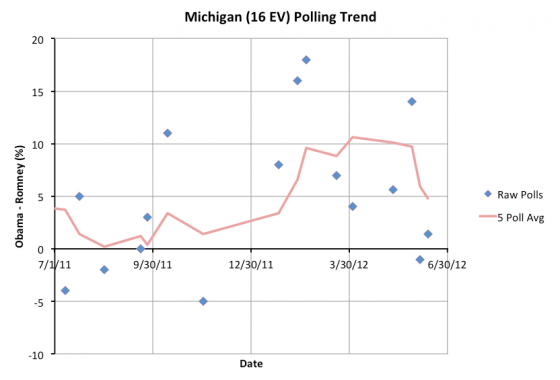
First up, Michigan, with 16 electoral votes. In the last week Obama’s lead in the five poll average in Michigan dropped below 5%, then popped back above 5%, and now it once again drops below 5%. At the moment it sits at a 4.1% lead. The trend toward Romney over the last few polls seems clear though, and this puts Michigan once again into my swing state category.
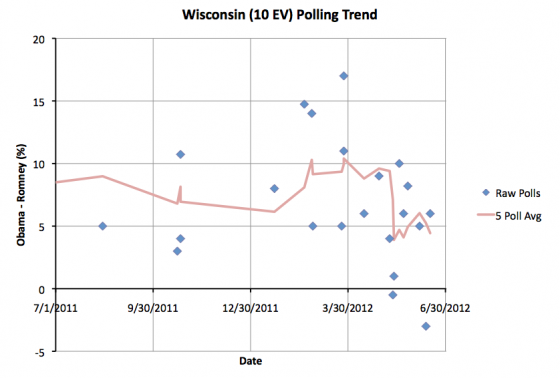
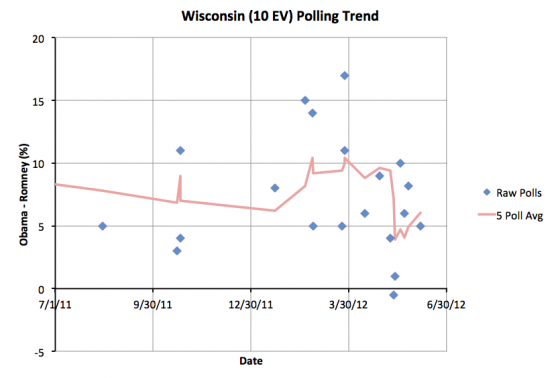
Now Wisconsin, with 10 electoral votes. Wisconsin is looking pretty similar to Michigan. It is also a state where Obama’s lead was briefly over 10% in the spring, but where Obama’s lead has been deteriorating since then. The five poll average had dipped below 5% in mid-May, popped back above 5% on June 8th… and now is falling back below that level again with the latest poll. Obama’s lead in Wisconsin now sits at 4.4%. So Wisconsin becomes a swing state again too. With both of these states now “too close to call” as far as my model is concerned, Romney’s “best case” improves significantly:
Just yesterday, I was talking about how the current state of the race was about the same as it was two months ago and if Romney wanted to change this, he should get started. So is this the start of that? Well, maybe. But last time I said it looked like Romney was breaking out, the very next day a new poll moved things back in the other direction. So I’m going to refrain from drawing any conclusions like that yet, even though Romney’s best case is better than it has been since February, he has many more paths to victory than he did in April and May, and not even Florida is a “must win” state any more. No question that this does look very good for Romney. If the next few polls keep Michigan and Wisconsin close, and if more polls in the “Lean” and “Weak” categories show movement toward Romney, then we’ll know that this isn’t just fluctuations in the polls, but is real motion in Romney’s direction. I just don’t want to jump the gun again. Obama still has a significant advantage and would be a heavy favorite to win if the election was held today. But stay tuned! If there is broad based movement toward Romney, and a few more critical states move in his direction, things will start looking a lot more competitive and a lot more interesting in a hurry!
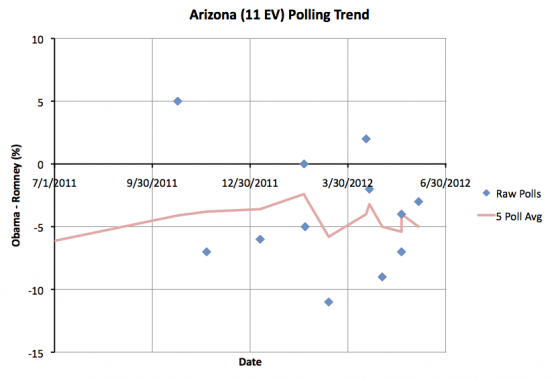
Chart and map from the Abulsme.com 2012 Electoral College Prediction page. Both assume Obama vs Romney with no strong third party candidate. Both show polling as it currently exists. Things will change before election day. On the map red is Romney, blue is Obama, gold states are too close to call. Lines on the chart represent how many more electoral votes a candidate would have than is needed to tie under several different scenarios. Up is good for Obama, Down is good for Romney. One change today. Movement in Romney’s direction again:
So with the latest poll in Arizona, Romney’s lead in the five poll average is once again at 5% which puts it back in the “Weak Romney” category, and makes me take the possibility of Obama winning off the table in my models. This diminishes Obama’s best case by 11 electoral votes:
Obama’s best case is still better than his 2008 result of 365 to 173, but just barely. Also, all three models are at almost exactly the same places they were at the end of April. Almost two months further along, and effectively neither candidate has moved the needle at all. Some bouncing of the numbers up and down a little bit in between, but net… no change. (Well, Romney’s best case was SLIGHTLY better, by 3 electoral votes, back at the end of April… but close enough.) One of the things I keep saying is that while Obama’s lead in these models is substantial, and if the election was held today, an Obama victory would be a pretty safe bet… it is important that the election is NOT today, and there is still plenty of time for things to change. So far though… the situation is remaining pretty static. So if Romney wants to change this picture, he really should get started at some point. Conventional wisdom of course is that most voters don’t start paying attention until the conventions… which start at the end of August. So we may have another two months of doldrums to live through before things start getting lively and the polls start moving more.
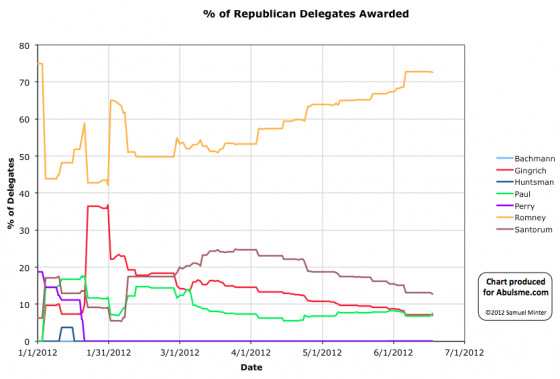
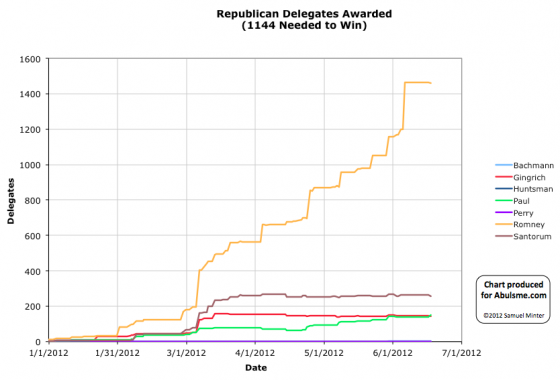
Charts from the Abulsme.com 2012 Republican Delegate Count Graphs page. The first chart is the % of delegates the candidate has collected, the second is the number of delegates. These numbers include estimates of the eventual results of multi-stage caucus processes which will be refined as the later stages occur. Not that it matters at this point, but as the final results from Iowa came in this weekend, the results for Ron Paul were more favorable than the original estimates, so he gained delegates in my count, and the others lost delegates. The result is that Ron Paul has now passed Newt Gingrich for third place. (I use the Green Papers Soft Count, plus the DCW super delegate count in places where Green Papers hasn’t included them). This of course doesn’t change the end results here at all. Romney is the nominee. It does however show once again how the final results in caucus states can be dramatically different from the “estimated” results based on the popular vote in caucus states. In the case of Iowa, the initial estimate was Romney 6, Santorum 6, Paul 6, Gingrich 4. As of right now we have Paul 21, TBD 7. Quite a bit different. There are a lot of people who argue that because of these sorts of things, one should only look at the “hard” count of delegates actually already fully allocated and bound rather than trying to estimate caucus states at all in the early stages or the way some officially uncommitted delegates will go. I still think there is some value in doing those estimates, but one must be very aware of the limits of those estimates. For reference, my current overall count is this: Romney 1459, Santorum 257, Paul 152, Gingrich 142, Bachmann 1, TBD 275 Green Papers “Hard” Count has the following: Romney 1329, Santorum 251, Gingrich 143, Paul 98, Huntsman 2, Bachmann 1, TBD 462 A little different. Either way though, Romney wins. :-) Update 2012 Jun 17 23:36 UTC: Made my format for delegate counts consistant. Update 2012 Jun 18 18:38 UTC: Minor wording fix.
Chart and map from the Abulsme.com 2012 Electoral College Prediction page. Both assume Obama vs Romney with no strong third party candidate. Both show polling as it currently exists. Things will change before election day. On the map red is Romney, blue is Obama, gold states are too close to call. Lines on the chart represent how many more electoral votes a candidate would have than is needed to tie under several different scenarios. Up is good for Obama, Down is good for Romney. So, um, the change from yesterday, I guess, well, never mind:
So, yesterday a new poll pulled Obama’s lead in the five poll average in Michigan under 5%. Today another new poll pulls that lead back up over 5% again. Easy come, easy go I guess. This takes Michigan once again out of the set of states we consider going both ways in our models.
So, we can, for the moment anyway, just take everything I said yesterday about momentum in Romney’s direction, and say “OK, maybe not so much after all”. Romney’s best case is now back in the range it has been ever since the end of February, with relatively narrow paths to victory. Maybe we’ll see a more permanent move in that direction soon… but not yet. Meanwhile, one final correction due to the data from a spreadsheet provided by Darryl at HorsesAss. With more precise information from a poll back in February, one of Wisconsin’s transitions, from Weak Obama to Strong Obama, moves from March 30th to March 31st. The rest of Wisconsin’s history stays the same (it has moved around several times), as does the current situation as a “Weak Obama” state where Obama leads by between 5% and 10%. This only affects the older part of the historical chart. That chart is adjusted starting with today’s update.
Chart and map from the Abulsme.com 2012 Electoral College Prediction page. Both assume Obama vs Romney with no strong third party candidate. Both show polling as it currently exists. Things will change before election day. On the map red is Romney, blue is Obama, gold states are too close to call. Lines on the chart represent how many more electoral votes a candidate would have than is needed to tie under several different scenarios. Up is good for Obama, Down is good for Romney. One state changing status today, and it is a big one heading in Romney’s direction…
So Michigan, where as recently as the end of May, Obama’s lead in the five poll average had been more than 10%, is now too close to call as Obama’s lead falls below 5%. The state is still leaning Obama, but with the five poll average at an Obama lead of only 4.8%, that lead could disappear overnight with the right combination of events. This change in Michigan has been very dramatic. In fact, the rapidity with which Obama’s lead in Michigan collapsed should be a reminder than things can and do sometimes change quickly. It is tempting to say in retrospect that the two polls in February showing Obama with 15%+ leads in February may have been outliers… without them the drop would look less dramatic, but still… with sparse polling it is hard to distinguish outlier polls from actual movements in opinion. And there were two of them, not just one. These could have been outliers, but in February Romney was getting beaten up in Michigan by Santorum, so a decline in his support at that time also seems reasonable. In either case, the most recent five polls show a close race, slightly in Obama’s favor, so Michigan is once again a swing state in our model. This improves Romney’s “best case” where we have him winning all of the states that are currently “close”:
At this point Romney’s best case gives him 28 more electoral votes than is needed to tie. This makes Florida the only “must win” state. Romney can now afford to lose any one of the other close states, or multiple of the smaller close states. He has many more paths to victory than he had a few weeks ago. Romney’s “Best Case” line is now better than it has been since February. It finally looks like Romney may have put most of the damage caused by the primary season behind him, and is now pulling things his direction… moving this in the direction of actually becoming a competitive race. Romney’s best case still isn’t back where it was in January, but it it certainly looks a lot better for him than it did in April and May, at least in terms of his best case. Now, the “everybody wins every state they are even slightly ahead in” line still shows a pretty clear Obama victory. But in order to bring states onto your side of that line, you first have to bring down Obama’s lead in those states… and that is exactly what has been happening. Romney is pulling states that looked pretty safe for Obama and starting to make them competitive. If the trend continues, he will start to pull into the lead in some of those… and maybe take some that look competitive now and make them start looking like safe Romney states. It has also been a bad couple weeks for Obama in the news cycle of course. It is also possible recent events will blow over and Obama will pull some of these states back in his direction. Stay tuned.
Chart and map from the Abulsme.com 2012 Electoral College Prediction page. Both assume Obama vs Romney with no strong third party candidate. Both show polling as it currently exists. Things will change before election day. On the map red is Romney, blue is Obama, gold states are too close to call. Lines on the chart represent how many more electoral votes a candidate would have than is needed to tie under several different scenarios. Up is good for Obama, Down is good for Romney. Two states change status today, and they are both moves in Obama’s direction:
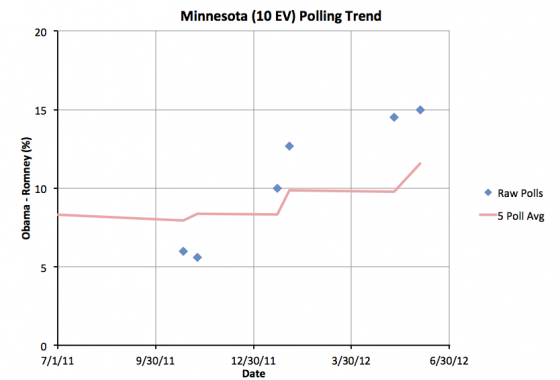
First up, Minnesota (10 ev) moves to “Strong Obama” as Obama’s lead in the state in the five poll average tops 10%. Minnesota has been pretty sparsely polled. Obama has always been significantly ahead in Minnesota, but some polls from last year had it close enough that maybe Obama would need to do a little defense in Minnesota. With the new polls, it is looking like Minnesota is safe enough that Obama can essentially ignore it. At least for now.
Second and more importantly, Obama’s lead in Wisconsin once again moves over 5%. From May 17th until today Obama’s lead had dropped below 5%, leading me to classify Wisconsin as only “Lean Obama” and therefore as a swing state. This weakening appears to have been short lived. Wisconsin is now back in the “Weak Obama” status, meaning that Obama has a significant lead, but not a big enough lead to feel safe about the state and ignore it. Of these two changes, only Wisconsin effects the range of scenarios, reducing Romney’s margin in his best case, since that state is no longer on the table for him.
This now gives Romney a 12 electoral vote margin above the 269 he needs to tie. This makes Florida (29), Ohio (18), North Carolina (15) and Virginia (13) all into “must win” states for Romney. He can afford to lose any one of Arizona (11), Tennessee (11), Missouri (10), Colorado (9) or Iowa (6), but not two. Finally, as I continue to go through the old data provided by Darryl at HorsesAss I find another old poll that requires a correction to my time series chart. This time it is an old Tennessee poll from October 2011. Frankly, it looks very much like an outlier compared to other Tennessee polls, showing Romney ahead by 18%, where his strongest showing in any other poll was a 7% lead, but it is a poll I would have included had I known about it, so there it is. The result of including this poll is to change the date when Tennessee moved from “Weak Romney” where it started the year to “Lean Romney” where it is now from March 2nd to May 24th. This is an almost three month move because Tennessee has been very sparsely polled. This only changes the historical status, not where Tennessee is today, which is a 4.2% Romney lead in the five poll average, making Tennessee a “swing state” in our model, but just barely. The historical graphs have been corrected as of today’s post. |
|||||||||||||||||||||||||||||||||||||||||||||||||||||||||||||||||||||||||||||||||||

