This is the website of Abulsme Noibatno Itramne (also known as Sam Minter).
Posts here are rare these days. For current stuff, follow me on Mastodon
|
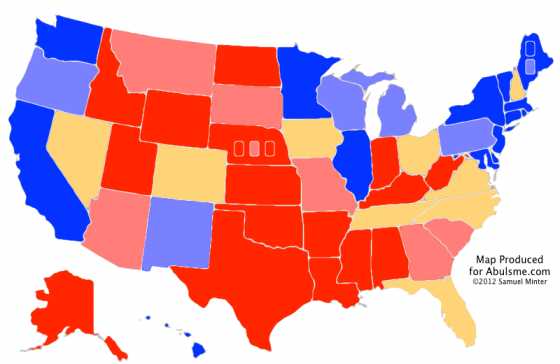
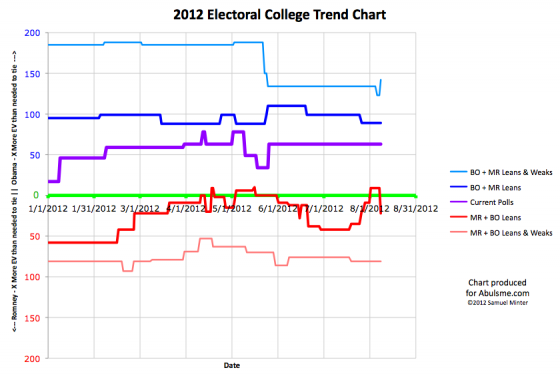
Chart and map from the Abulsme.com 2012 Electoral College Prediction page. Both assume Obama vs Romney with no strong third party candidate and show polling as it currently exists. Things will change before election day. On the map red is Romney, blue is Obama, gold states are too close to call. Lines on the chart represent how many more electoral votes a candidate would have than is needed to tie under several different scenarios. Up is good for Obama, Down is good for Romney.
Four states change categories today. In all four cases, the races look a little closer than they did. The impact is different in these cases, so lets look at each one. In order from the smallest number of electoral votes to the greatest…
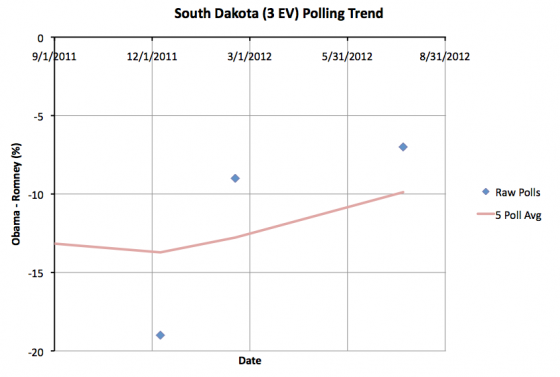
South Dakota (3 ev): South Dakota has been very sparsely polled. The poll added today is only the 3rd one in the last year and only the 4th since the 2008 election. With this update the 5 poll average (which includes the 2008 election to fill out the average) drops to a Romney lead of 9.9%. This is less than the 10% threshold I use, so I move the state from “Strong Romney” to “Weak Romney”. But obviously South Dakota is nowhere close to being a competitive state. It would take a move of epic proportions to actually make South Dakota a competitive state. But the three polls this year do seem to show that Romney’s lead is a bit less than it once was.
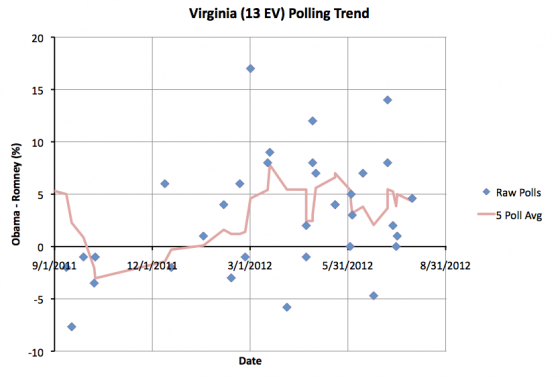
Virginia (13 ev): Obama’s lead in the five poll average had touched 5%, moving it out of the close state category, but it didn’t last. The latest poll added to the average brings Obama’s lead back down to 4.3%. This means Virginia is once again one of the states I consider close enough that it could easily go either way depending on the events of the campaign. This will improve Romney’s “Best Case” in my models. Virginia has been close for most of the last year so it is not surprising to see it here again.
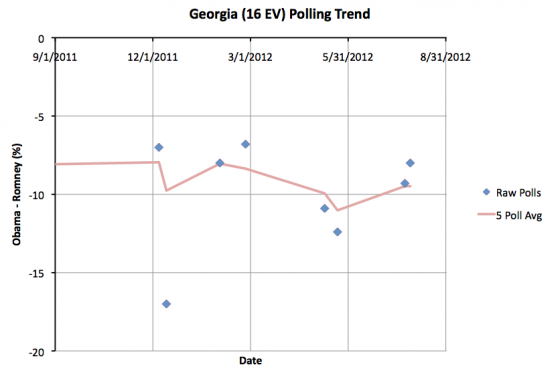
Georgia (16 ev): With two new polls added today, Romney’s lead in Georgia drops to 9.5%. Since this is below 10%, we move the state to “Weak Romney”. As with South Dakota, this is still a pretty substantial lead, and absent a major Romney collapse, it is unlikely to see Georgia actually become a competitive close state. But it is once again in the category where perhaps Romney shouldn’t take it completely for granted. Well, OK, he mostly can. But his margins do look a little bit less than they did before.
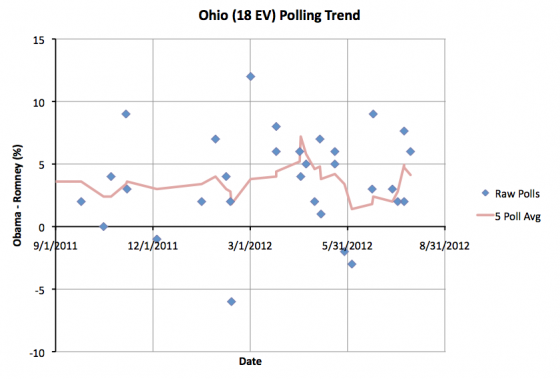
Ohio (18 ev): Along with Virginia, this is the other one that “matters” to the model. In my August 1st update the 5 poll average in Ohio jumped to 5.5%, moving it out of my swing state category. In today’s update we add a new poll… actually one that ended back on July 24th, prior to the last poll included in my last update, but which I just found (via Darryl at HorsesAss) so it counts for today*… and that new poll pulls Obama’s lead back down to 4.1%. So after the brief interlude as a blue state, Ohio is once again where it has been most of the year… with an Obama advantage, but not a huge one. So it is easy to imagine scenarios where Romney pulls it back over onto his side of the fence.
When you add up the changes in these four states, what do you get?
Well, South Dakota and Georgia really don’t change anything. For those two states, it isn’t about who will win, it is just about how much Romney will win by… which really doesn’t matter.
Virginia and Ohio on the other hand… they matter, and they are pretty big states. With both of these states on the table again, Romney’s best case improves considerably:
|
Romney |
Obama |
| Romney Best Case |
291 |
247 |
| Current Status |
206 |
332 |
| Obama Best Case |
180 |
358 |
With this new configuration, Florida (29 ev) is a must win state. Romney can’t win without it. He could lose any one of Ohio (18 ev), North Carolina (15 ev), Virginia (13 ev) or Tennessee (11 ev), but only one of them. Colorado (9 ev), Iowa (6 ev), Nevada (6 ev) and New Hampshire are more flexible. There are a number of different “paths to victory” here now.
Now, most of these states (all but North Carolina and Tennessee) are ones where Obama has the lead at the moment, even if it is a small lead. To actually win, Romney has to actually start pulling ahead in some of these states rather than just reducing Obama’s lead.
That may be next. With a VP announcement “any time now” and the Republican Convention just around the corner, movement toward Romney should probably be expected. The questions will be: “How much movement?” and “Does it last?”.
(Spoilers: Convention bounces usually last about a week before things revert to where they were before, and VP choices only rarely end up making a difference.)
* If there is anybody who cares about the details and wonders why I didn’t do a retroactive adjustment of the historical graphs because I included an older poll that changed things, here is a long geeky explanation of my process: Basically, if you judge by the “end date” of the polls, polls come in out of order all the time. It takes pollsters a few days to compile and release their data, then sometimes it take a bit before it shows up on one of the three sources I use to collect poll data. If a new poll is within the “Last 5”, then I just treat it as current new data, regardless of the end date on the poll and if it is really the most recent to end. In this case, the poll wasn’t the newest, but it was the second newest. The last two polls had just gotten to me in reverse order, which happens pretty frequently. It is a little unusual that by the time I included it, the poll end date was about two weeks old, but it was still the second most recent poll. So it just got folded into the average normally. If I become aware of polls that are older than the Last 5, and those polls would have changed the category of any states, then I’ll fold a correction into my next update. Also while I’m giving esoteric details… The historical electoral college trend lines are based on the date new polls are included in my model (except when polls older than the most recent 5 are added), while the state polling trend chart uses the end date of the polls, which means they don’t always match exactly. So, for instance, the peak over 5% in Ohio has indeed disappeared with this new poll, instead now only peaking at 4.9%. The end dates of the polls are also used to determine just which polls are in the “Last 5” to begin with. In the case of multiple polls with the same end date, the tie breaker is the time they were added to my model.
Edit: 2012 Aug 8 08:15 to add that last parenthetical.
Edit: 2012 Aug 8 16:31 to add * note.
Edit: 2012 Aug 8 17:50 to correct one detail on the * note.
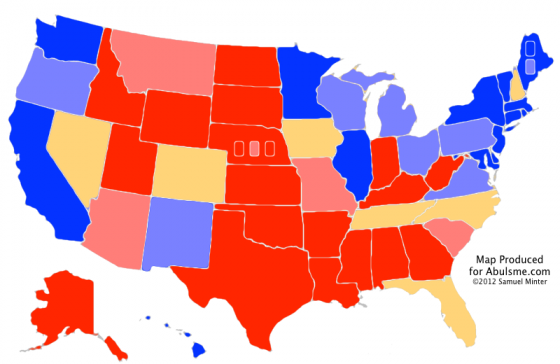
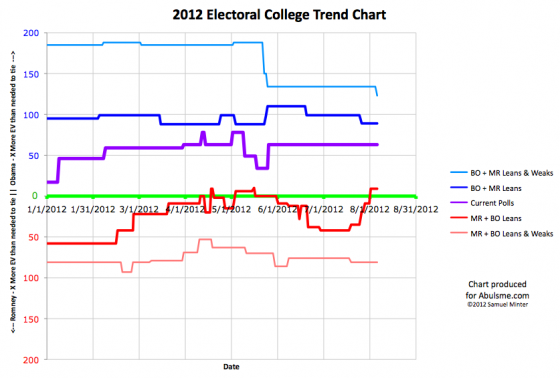
Chart and map from the Abulsme.com 2012 Electoral College Prediction page. Both assume Obama vs Romney with no strong third party candidate and show polling as it currently exists. Things will change before election day. On the map red is Romney, blue is Obama, gold states are too close to call. Lines on the chart represent how many more electoral votes a candidate would have than is needed to tie under several different scenarios. Up is good for Obama, Down is good for Romney.
One change today, in a very sparsely polled state…
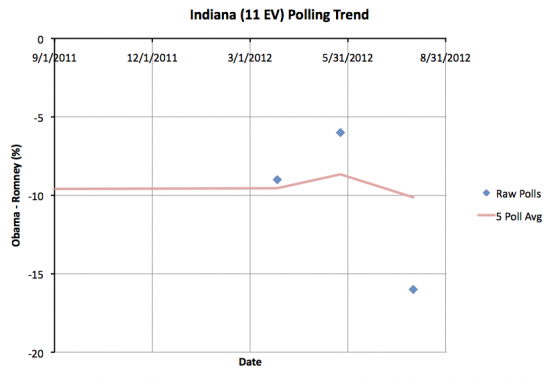
As far as I have found, there have only been THREE polls of Obama vs Romney in Indiana since the 2008 elections. To get my five poll average I actually include the 2004 and 2008 election results as proxies for real polls of the current candidates, just to “kick start” the state. Prior to today, the average was at an 8.7% Romney lead. That put Indiana in my “Weak Romney” category, meaning that Romney had a pretty good lead in the state, but not so much of a lead that he could take it completely for granted. With the right combination of events in the campaign, Obama could conceivably make it closer again… although winning might be a stretch.
Well, the newest poll shows a much more substantial Romney lead in the state, bringing the five poll average to a 10.1% Romney lead, enough for me to move it to the “Strong Romney” category. This means that Romney has a big enough lead here at the moment that he probably doesn’t even need to bother doing any defense in this state, and Obama would be wasting his time if he tried to contest it.
Now, since Indiana wasn’t and isn’t even remotely one of the “close” states, this does not change any of my models… Romney continues to win Indiana in all three…
|
Romney |
Obama |
| Romney Best Case |
260 |
278 |
| Current Status |
206 |
332 |
| Obama Best Case |
180 |
358 |
…and continues to lose the election in all three too.
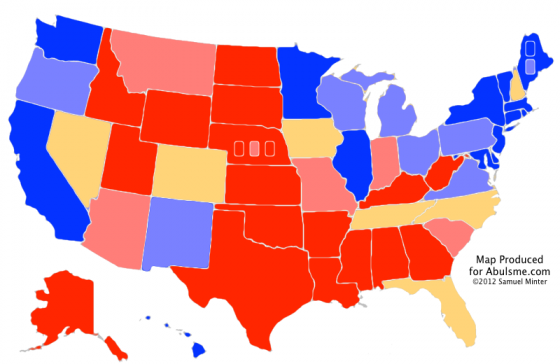
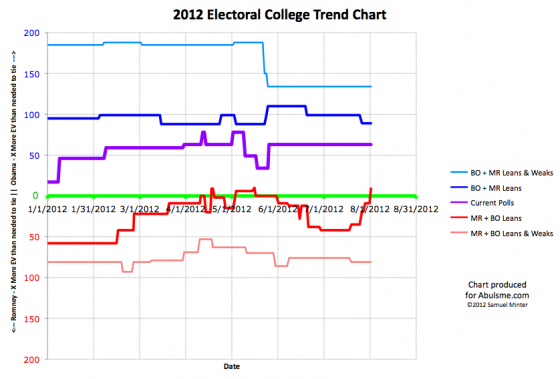
Chart and map from the Abulsme.com 2012 Electoral College Prediction page. Both assume Obama vs Romney with no strong third party candidate and show polling as it currently exists. Things will change before election day. On the map red is Romney, blue is Obama, gold states are too close to call. Lines on the chart represent how many more electoral votes a candidate would have than is needed to tie under several different scenarios. Up is good for Obama, Down is good for Romney.
One state moves today. A big state, an important state.
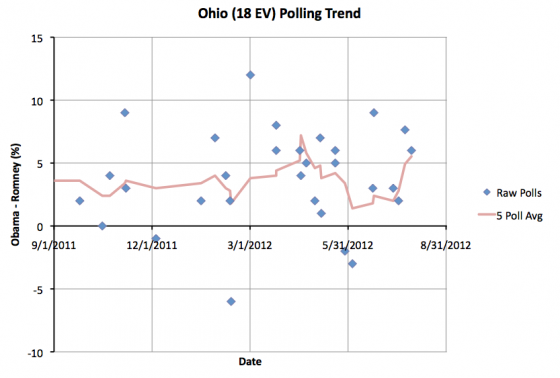
Ohio has 18 electoral votes. In the last year, Romney has never been ahead in the 5 poll average in Ohio, although there have been a smattering of individual polls showing him in the lead (the last one in June). But for most of the last year the polls have shown Ohio with only a narrow Obama lead… a less than 5% lead that put it within reach for Romney. The right things happen, good campaigning, bad news cycle for Obama, whatever, and you could see it pulling over the line to Romney.
The last few polls have been quite favorable to Obama though, and Obama’s lead in Ohio now climbs to 5.5%. So I paint the state light blue, and remove it from the list of close states that I include in Romney’s “Best Case”. Ohio may not stay here. The next poll could pull this back in Romney’s direction. But for the moment, Ohio looks like a blue state.
So where does this put us?
|
Romney |
Obama |
| Romney Best Case |
260 |
278 |
| Current Status |
206 |
332 |
| Obama Best Case |
180 |
358 |
Yup, that is right. For the third time since I’ve been tracking*, if Romney wins all the states he is clearly ahead in, plus all the close states, including the ones Obama is ahead in… he still loses. Put another way, Obama can afford to lose every single state that is “close” in the polls, and he will still win 278 to 260.
In a quick comparison to 2008, McCain didn’t get to this bad a position in the polls until October, Romney has been there three times so far in my model. Now… each time he has subsequently improved his position… he hasn’t stayed in this kind of dire strait for too long. But rather than those being permanent moves to make the race more competitive, both times the gains Romney made have eventually eroded away, and we end up back here with his best case being to lose.
Yes, yes. We have three months to go. We have conventions coming up. Most “normal” people won’t start paying attention until the fall. Indeed. All this is true. It is not yet time to call a winner. Not by any means. But… Romney has a lot of work to do if he wants to win this. His current position just doesn’t look good at all.
(Or, as we’ve said on the podcast, Obama has to screw up badly, that will also do the trick.)
* The second time did not appear on my charts when it happened. My charts back then showed Romney with a slight lead in his best case, but this lead disappeared when I later added a Virginia poll I’d missed originally.
Edit 2012 Aug 1 15:40 to add the last parenthetical and the note about the second time Romney’s best case was to lose.
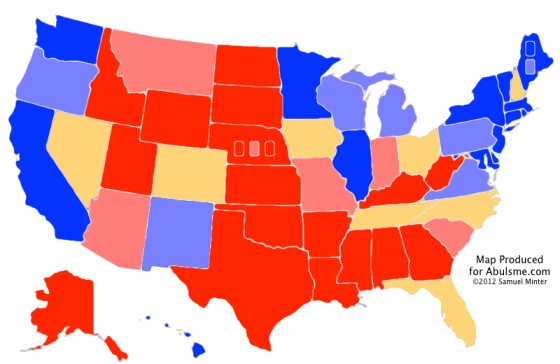
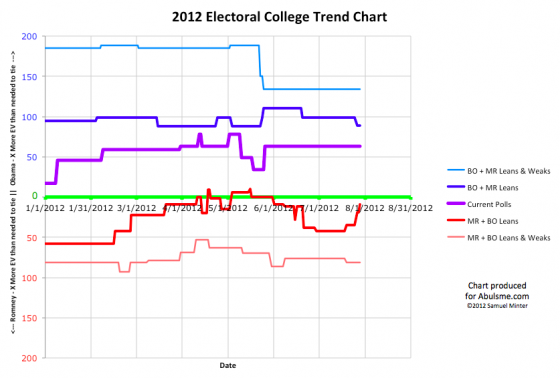
Chart and map from the Abulsme.com 2012 Electoral College Prediction page. Both assume Obama vs Romney with no strong third party candidate and show polling as it currently exists. Things will change before election day. On the map red is Romney, blue is Obama, gold states are too close to call. Lines on the chart represent how many more electoral votes a candidate would have than is needed to tie under several different scenarios. Up is good for Obama, Down is good for Romney.
One state moves today:
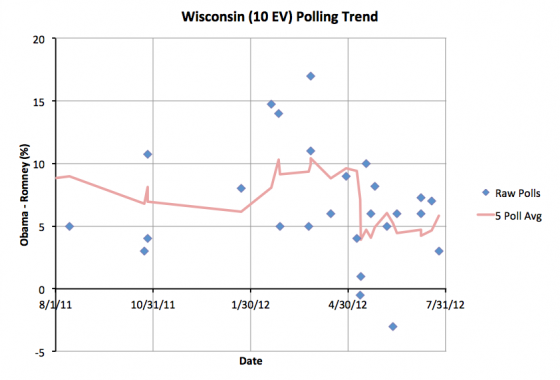
In March Obama had a lead of over 10% in Wisconsin, but by May that was less than 5%, putting Wisconsin on our swing state list. It has bounced around the 5% line since then. Now Obama’s lead in the five poll average once again tops 5%, so Wisconsin moves to “Weak Obama” and takes the possibility of Romney winning it off the table for the moment.
|
Romney |
Obama |
| Romney Best Case |
278 |
260 |
| Current Status |
206 |
332 |
| Obama Best Case |
180 |
358 |
Before the last couple of weeks, Romney had been steadily eroding Obama’s lead in a bunch of blue states. He kept pulling states out of the “Weak Obama” category into “Lean Obama” putting them into contention as swing states, with margins close enough that Obama’s lead could conceivably evaporate overnight if the news cycles were favorable to Romney.
Romney’s best case in my model went from losing 259-279 on May 16th* to winning 311-227 from Jun 29th to July 18th. Although none of them had yet gone over the line to his side, that was a move of 52 electoral votes into the zone where they were within reach.
The last two weeks has undone much of that… Michigan (16), Virginia (13) and Wisconsin (10) moved out of reach. This was compensated by Nevada (6) swinging again, but in terms of the net total, 33 fewer electoral votes are in the pool for Romney. This is not a good trend for Romney.
At his new best case of 278-260, Romney is only 9 electoral votes over the tie line. This means that of the close states, Florida (29), Ohio (18), North Carolina (15) and Tennessee (11) are now must win states. He could afford to lose one of Iowa (6), Nevada (6) and New Hampshire (4) and still win, but he can’t lose two of those.
If he wins every other close state, but loses Colorado (9) we would actually have 269-269, throwing things to the House. This is highly unlikely, but would be fun. (It would also likely lead to a Romney win in the House.)
Romney has been behind in the “Current” model all year long. The progress he had made in June in the “Romney Best Case” model has been evaporating. It isn’t looking great for Romney right now. We still have over three months to go though. Maybe at some point Romney will start gaining some real traction?
* At the time it looked like Romney’s best case was winning 272 to 266, but a later inclusion of a Virginia poll from April retroactively moved Virginia (13) out of swing state status and into “Weak Obama” for that date.
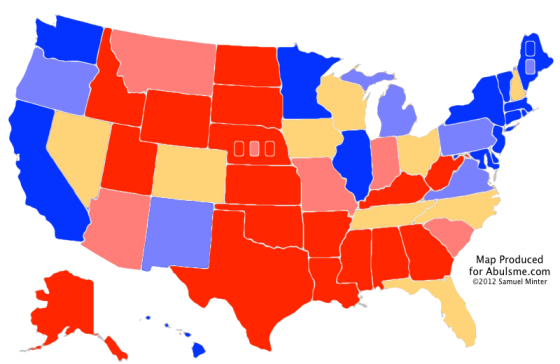
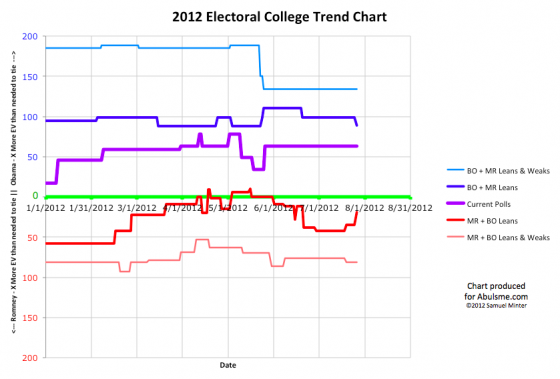
Chart and map from the Abulsme.com 2012 Electoral College Prediction page. Both assume Obama vs Romney with no strong third party candidate. Both show polling as it currently exists. Things will change before election day. On the map red is Romney, blue is Obama, gold states are too close to call. Lines on the chart represent how many more electoral votes a candidate would have than is needed to tie under several different scenarios. Up is good for Obama, Down is good for Romney.
Two states change status today, both moving out of swing status, one toward Obama, one toward Romney. In order by electoral weight:
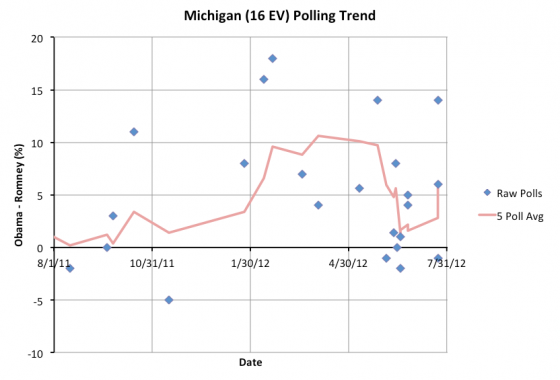
First up, Michigan, with 16 electoral votes. Obama’s lead in Michigan had dropped from over 10% in the 5 poll average back in April, down to just barely over 1% in June. It has now rebounded to 5.6%, which I consider a large enough lead to take it out of reach for Romney, moving it into the “Weak Obama” category. Now, the last three polls, all released in the last couple days, are all over the place… +14 Obama, +1 Romney, +6 Obama. (The two older polls in my average at the moment are +5 Obama and +4 Obama). So there may be a lot of uncertainty here until we get more polls to validate where we really are. But we average out the admittedly huge polling differences, and end up with a decent Obama lead.
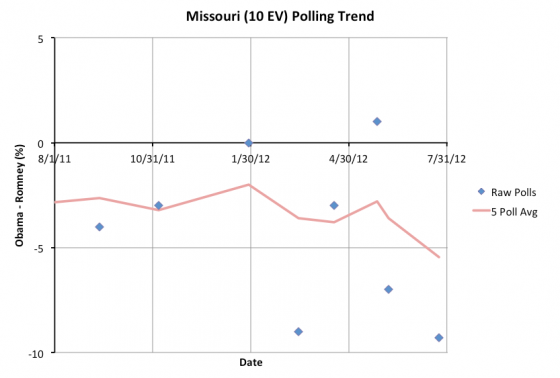
Next up is Missouri with 10 electoral votes. Missouri has been pretty sparsely polled this year, despite most of those polls showing a pretty close race (with Romney slightly ahead). You’d think it would be polled more often since even though there was a consistent Romney lead, it was a small lead, and thus the state might have been vulnerable. At this point though three of the past 5 polls show a Romney lead more than 5%, and the 5 poll average is +5.5% Romney, so Missouri moves out of my swing state category into “Weak Romney”.
The result of all this?
|
Romney |
Obama |
| Romney Best Case |
288 |
250 |
| Current Status |
206 |
332 |
| Obama Best Case |
180 |
358 |
Both Romney’s Best Case and Obama’s best case get a little worse. Since Romney’s best case is weaker, this is more critical to him. His best case now has him with only 19 more electoral votes than needed to tie. This makes Florida once again a must win state. With this configuration of close states, unless he captures some states where Obama is ahead by more than 5% right now, Romney can’t win without Florida. He can still afford to lose Ohio, but only if he then wins EVERY other close state.
With this update Romney’s paths to victory once again narrow. In order to get to a more comfortable place, he needs to be pulling more of Obama’s weak states back into contention. Pennsylvania (20), Michigan (16) and Virginia (13), I’m looking at you.
And then of course he has to actually start pulling states over the line to his side. The “current status” where everybody gets all the states they are even slightly ahead in, hasn’t changed at all since May… We’re at Obama 332 Romney 206… which is only slightly different from where we were in FEBRUARY (Obama 328 Romney 210). There has been movement around the edges, and some short term fluctuations in April and May, but for the most part, not much has moved at all… if Romney wants to win, he needs to start getting some more traction in some of the critical states pretty soon.
The line is always “a lot can change before November”. There is no question that is very true. But there is a lot less time left to make that change happen than there was. Tick tock.
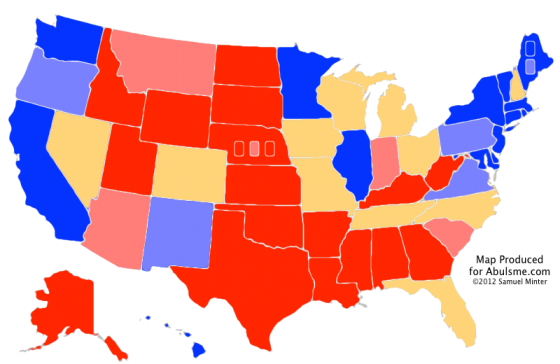
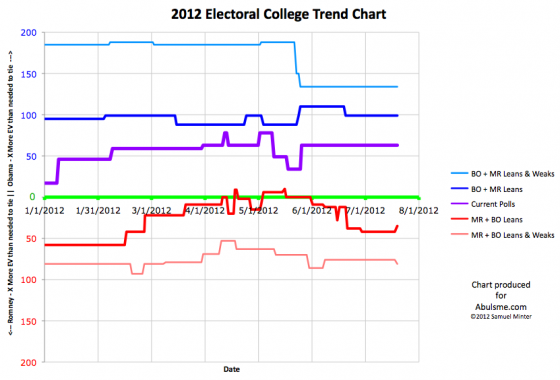
Chart and map from the Abulsme.com 2012 Electoral College Prediction page. Both assume Obama vs Romney with no strong third party candidate. Both show polling as it currently exists. Things will change before election day. On the map red is Romney, blue is Obama, gold states are too close to call. Lines on the chart represent how many more electoral votes a candidate would have than is needed to tie under several different scenarios. Up is good for Obama, Down is good for Romney.
We haven’t had an update to the status of any state in my model since June 29th. This is the longest stretch without an update since I started tracking this year’s electoral college race at the end of January. Now, the July 4th holiday was in the middle of that, and so polling was sparse for awhile, but still, there were plenty of polls, they just didn’t actually move states into new categories. Until today. We finally get three states moving today. Two move in Romney’s direction, one moves toward Obama.
So, in order by electoral weight:
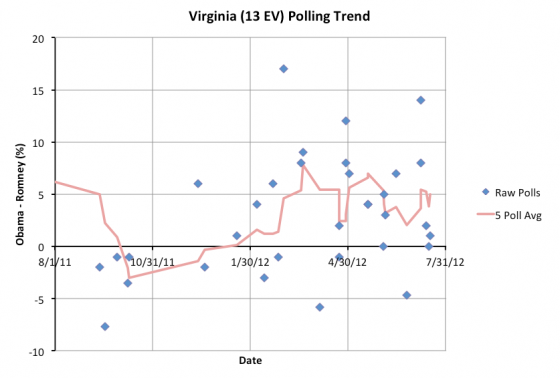
I added three new polls to the database for Virginia (13 ev) today and between them the five poll average pops up to exactly 5.0%, which puts Virginia back in the “Weak Obama” category, but just barely. The next poll could easily knock Virginia back into a less than 5% lead for Obama and make the state a swing state again. But for the moment, we take Virginia off the list of states where Romney has a shot.
One thing to note about the Virginia results. One of the new polls I added today was a PPP poll that ended July 8th that included the Constitution Party Candidate, Virgil Goode, who took 9% of the vote, mostly from Romney, which of course improves Obama’s position. Generally I find out about polls quicker than that, but today is the first day this one popped up in one of the sources I use regularly.
My policy generally is to use polls that include third parties as long as the people they include are definite candidates and not speculative. Goode was named the candidate for the Constitution Party back in April, so he counts. Because of this I also retroactively added another Virginia poll from April that included Goode. This changes the historical chart slightly, as that old poll expands Virginia’s previous experiment with being “Weak Obama” from having covered just May 26 to June 4th, to covering the longer period May 4th to June 8th. One should note of course that support for third party candidates typically collapses as election day approaches.
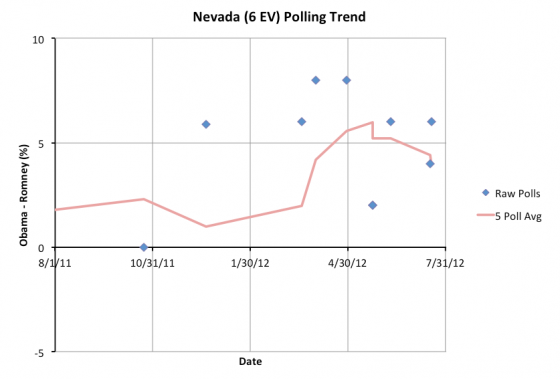
Next up is Nevada (6 ev). Recent polls show Obama’s lead slipping below 5%. So Nevada once again drops into swing state status. Obama’s lead in the five poll average is now 4.0%, which is not insubstantial, but is potentially within reach for Romney if events and the campaign narrative go his way. A 4% lead can disappear overnight with the right events in the news. So winning Nevada is once again considered part of Romney’s best case.
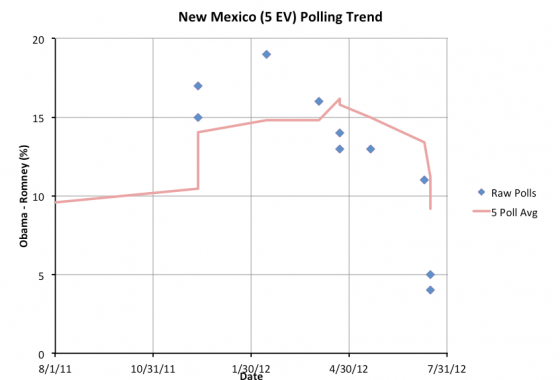
And finally New Mexico (5 ev). Obama’s lead in the five poll average drops under 10%, so I move it from “Strong Obama” to “Weak Obama”, but it is still not particularly close. Obama’s lead has to drop a lot more before it gets into swing state territory. Having said this, the last two polls in New Mexico are a very significant drop from earlier polls, and show things getting a lot closer. Both of these polls are from PPP though, one including Libertarian Gary Johnson, and one not including him. Since both polls are from one source, taken from the same underlying sample I believe, there is a chance they are outliers. We’ll have to wait for more polls to confirm. If this turns out to be real movement rather than sampling error, then this could be a pretty significant movement away from Obama in New Mexico.
So what does all this do to the overall situation? Well, New Mexico’s change does not effect the inventory of swing states, so it doesn’t affect the three main lines in our model at all. Nevada moves into swing status, but Virginia leaves it. Virginia is bigger, so today’s net effect is to make Romney’s best case worse by 7 electoral votes:
|
Romney |
Obama |
| Romney Best Case |
304 |
234 |
| Current Status |
206 |
332 |
| Obama Best Case |
170 |
368 |
So, as a whole, Obama wins today’s updates. But Romney still has a variety of paths to victory. Over the course of June, he took a lot of states Obama was ahead in by more than 5% and made them close. Virginia has hit 5% again, but just barely. That may be ephemeral. We have a ton of states that are close right now. True, most of them are still on Obama’s side of the line, and Obama still wins handily if he takes every state he is ahead in. But you have to make states close before you make them yours, and Romney has slowly but surely been doing that.
Romney did have a bad week last week, but state polls are sparse enough, it takes more than a few days of bad news for a trend to start showing up in the electoral college models. If the current status in Virginia gets confirmed by more polls, and other states start going that way too, then perhaps this is a start of a movement back away from Romney and toward Obama. But for the moment it is too early to tell.
Edit 2012 Jul 20 14:04 UTC: Actually updated the historical chart with the Virginia correction, which I’d neglected to do when this was first posted. Sorry!
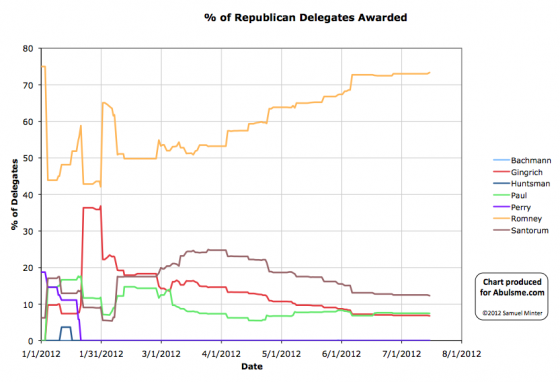
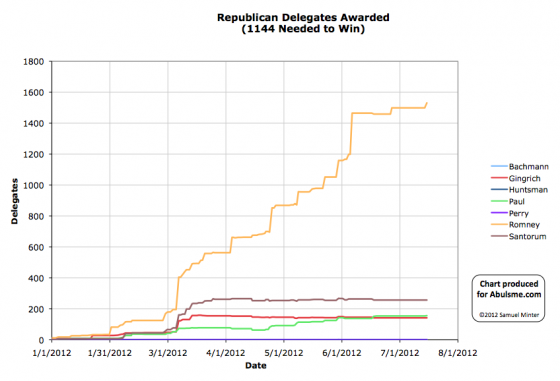
Charts from the Abulsme.com 2012 Republican Delegate Count Graphs page. The first chart is the % of delegates the candidate has collected, the second is the number of delegates. These numbers include estimates of the eventual results of multi-stage caucus processes which will be refined as the later stages occur.
And so, yesterday, on July 14th, Nebraska had their state convention. Nebraska ends up 32 Romney, 2 Paul, 1 TBD.
And with that, the last major scheduled event on the 2012 Primary calendar comes to a close.
We end up with: 1531 Romney, 257 Santorum, 156 Paul, 142 Gingrich, 1 Bachmann… and 199 TBD.
Of course at some point those 199 TBD’s have to make up their minds and vote for somebody at the convention (or abstain). And in all likelihood many of the non-Romney’s will end up voting for Romney after all. Or the convention may just have a motion to declare Romney the winner by acclimation and we may never get a full vote count. In previous years though, in the final roll call vote, the winner has gotten much more than their totals at the end of the primary season would indicate, and everybody else has gotten less.
Not to mention, to be officially nominated at the convention, you need to have won at least five state contests. So a quick look at that total:
- Romney – 41 contests (Most Places) plus 2 ties (Alaska, Mississipi)
- Santorum – 3 contests (Alabama, Kansas, Oklahoma) plus 2 ties (Alaska, Mississipi)
- Paul – 3 contests (Iowa, Maine, Minnesota)
- Gingrich – 2 contests (Georgia, South Carolina)
In Montana and Pennsylvania uncommitted delegates are in the plurality.
There is also Louisiana, where there is a lawsuit between the Romney and Paul people that leaves the final delegate winner still undetermined.
(These add up to more than 50 due to DC, Puerto Rico, Guam, American Samoa, etc.)
In any case, unless there are defections in those two tied states that let Santorum claim them, it looks like Romney is the only one eligible to even be nominated.
There may be additional delegate changes on the margin, but I believe this is the last “event” prior to the convention.
So there we are. I’ll update after the convention if an official final delegate vote count is released.
Edit 2012 Jul 16 16:52: It has been pointed out in several places that technically speaking that unlike the actual vote for the presidential nominee, the votes for the “plurality” needed to nominate are not bound in any state. So therefore even in states where Paul does not have a plurality of the delegates, if a plurality of the delegation wishes to put Paul in nomination they could. This is perhaps most relevant in the cases where the delegate count is bound by primary results, but Paul managed to get his supporters elected to the actual delegate slots. In these cases, those delegates might give their state a plurality in favor of nominating Paul, but then those delegates would still be required to vote for Romney when the actual vote for the nominee came up. This seems like it is unlikely to actually happen unless the Romney folks decide it is in their best interest to let it happen. Also mentioned frequently, is that there is no binding at all on the nominations or voting for Vice President. So, if Paul’s folks wanted to make a show of it and cause trouble, they could nominate Paul for VP, regardless of Romney’s stated preference for that spot, then force a vote on it. Romney’s choice would then win of course, but we’d have a little drama first.
|
|


