This is the website of Abulsme Noibatno Itramne (also known as Sam Minter).
Posts here are rare these days. For current stuff, follow me on Mastodon
|
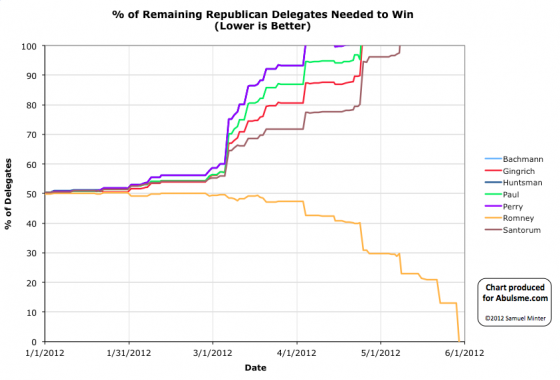
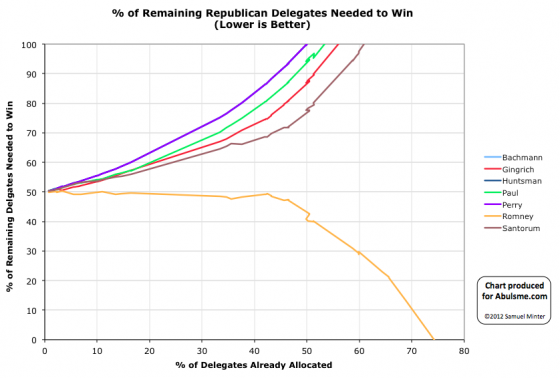
Charts from the Abulsme.com 2012 Republican Delegate Count Graphs page. When a candidate gets down to 0%, they have clinched the nomination. If they get above 100%, they have been mathematically eliminated. The first chart is by date, the second is by “% of Delegates Already Allocated”. These numbers include estimates of the eventual results of multi-stage caucus processes which will be refined as the later stages occur.
This is what we have been waiting for seemingly forever. By the beginning of March it was clear that no other candidate than Romney had the ability to get to 1144 absent a miracle. By the beginning of April it was clear that the non-Romney’s also were not going to be able to collectively block Romney absent a miracle. But Romney still needed to actually get to 1144. Slowly but surely he did so through April and May. Today he finally goes over the top. (At least with the count I use, which uses the Green Papers soft count plus the DCW Superdelegate Count. Other counts may differ.)
Since this is “the end” lets include a couple of additional graphs with two other views of the race:
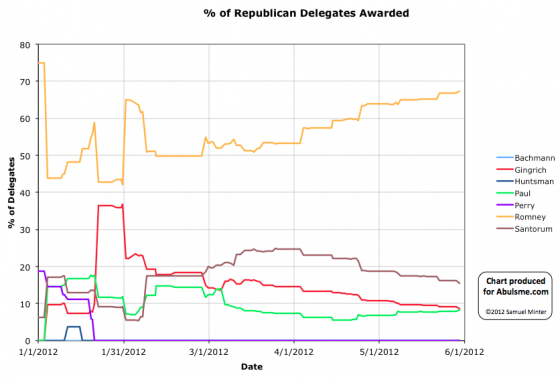
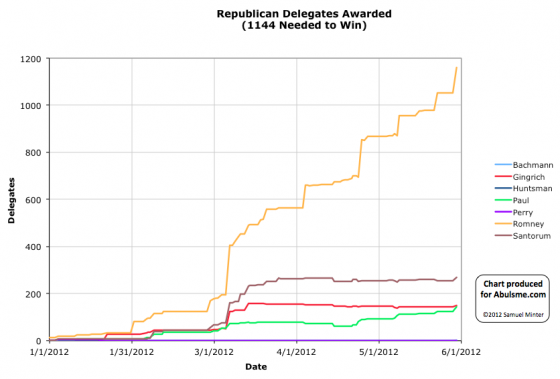
All of these charts show how Romney completely dominated this race from the very beginning. There was NEVER a point in the entire campaign where Romney was not ahead in delegates. It was only even close for a few days after Gingrich won South Carolina. The rest of the time, this whole campaign has just been a story of Romney slowly but surely pulling further and further ahead.
Now lets look specifically at today’s results from Texas.
Prior to today, none of Texas’s 155 delegates had been allocated. As of this update we have Romney 105, Paul 18, Santorum 13, Gingrich 7, Bachmann 2, TBD 10. Yes, that is right, at this late state, Michelle Bachmann mounts a comeback it seems. In any case, an overwhelming Romney win.
Romney also picked up two super delegates from Colorado today.
So net for the day: Romney +107, Paul +18, Santorum +13, Gingrich +7, Bachmann +2. Romney gets 72.8% of the delegates awarded today. This is way more than the 12.9% of the remaining delegates he needed to be on track to get to 1144 before “the end”. This was actually enough to push him over the edge.
My count now has the totals as: Romney 1159, Santorum 268, Gingrich 150, Paul 143, Bachmann 2
Now, by the Green Papers “hard count” that only counts delegates that are officially bound to Romney and theoretically have no discretion or ability to change their mind, we have Romney 1012, Santorum 245, Gingrich 143, Paul 93, Bachman 2, Huntsman 2… so by that count Romney still has a little bit further to go. The soft count also includes estimates for how delegates with discretion will vote and for how the remaining processes that are not yet final will play out. I also add in the super delegates who have publicly stated a preference. This is all reasonable. So I feel confident having using the count we have used all along, and considering Romney to have gotten to the 1144 magic number as of today.
Since we are hitting this major milestone today, I’ll take advantage of this time to highlight the comparisons with the 2008 races. More comparisons with 2008 can be found here.
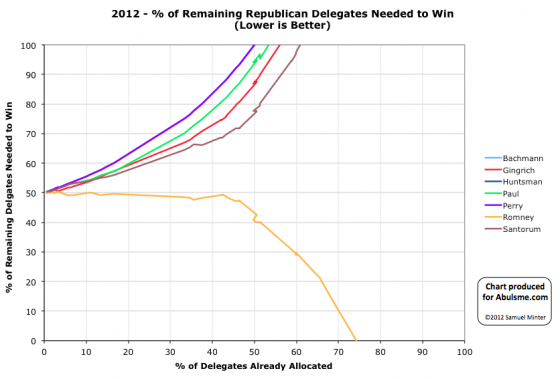
First, to make comparisons easier, the 2012 race on a full 0%-100% scale:
Then what the equivalent graph looked like in 2008:
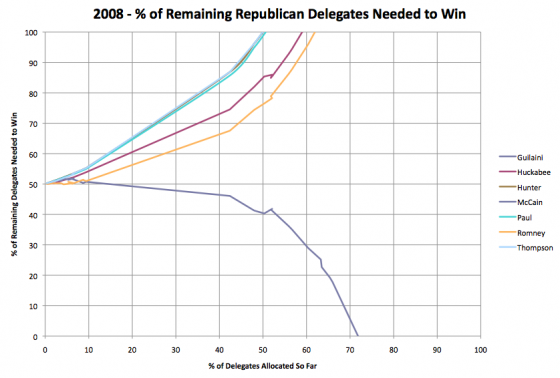
Looking at these two, in 2008 McCain had two non-trivial opponents compared to the 3 Romney had this time. In 2008, McCain pulled away from the other candidates starting around the 10% mark. In 2012 Romney was ahead from the very beginning. By the the 5% of delegates awarded mark (after Florida), Romney opened up the gap and none of the others ever came close again. Both Romney and McCain got to the “40% of remaining needed to win” mark at almost exactly the point where 50% of the delegates had been awarded. These two years look pretty similar.
Another view comparing Romney 2012 to McCain 2008 looks at % of total delegates earned by the eventual winner vs % of total delegates allocated. This was originally prompted by a post at Enik Rising. Looking at both candidates on the same chart we see this:
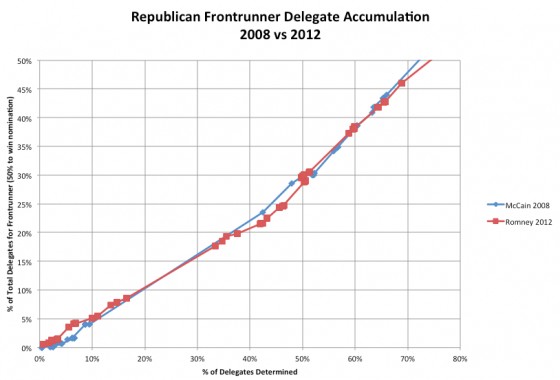
Despite all the talk at various points in time about Romney having problems closing the deal by comparison to 2008, this shows clearly that no such thing was happening. Any perception to that effect was due only to the fact that the calendar was more spread out this year than in 2008. Comparing the two curves, sometimes Romney was ahead, sometimes McCain was ahead, but for the most part these two lines tracked each other closely.
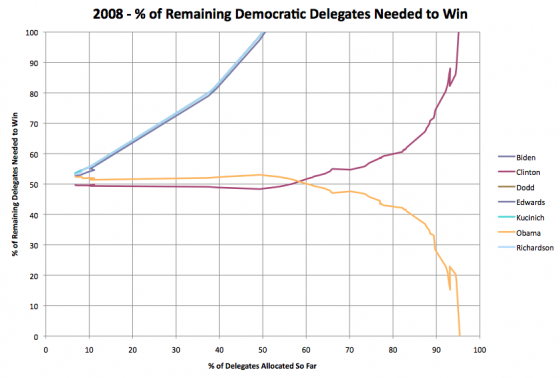
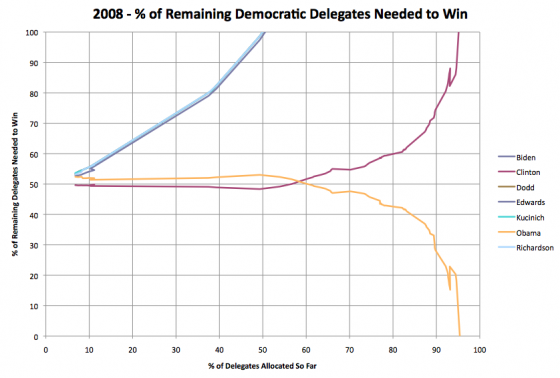
Finally, just for completeness, here is what an actually close race looks like on the “% of remaining delegates needed to win” chart… specifically, the Democrats in 2008:
With that, we wrap up the regular coverage of the Republican delegate race for 2012. There may be additional updates for specific milestones… if Paul manages to pass Gingrich in the delegate count… the final totals once all the state delegate selection processes are actually over… or the final roll call count at the convention… but as for regular updates this is it.
Thanks for everybody who has been reading and enjoying these updates over the last five months.
From here on out, it is all about the Electoral College…
Edit 2012 Jun 5 12:49 UTC: Fixed affect/effect typo.
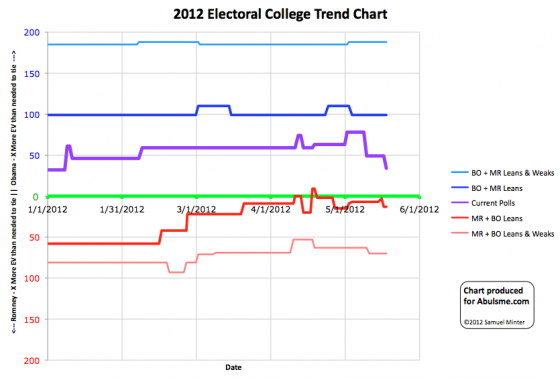
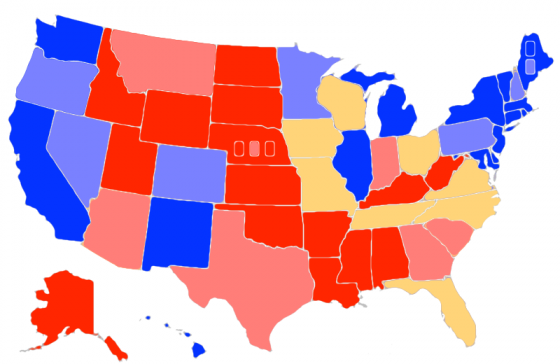
Chart and map from the Abulsme.com 2012 Electoral College Prediction page. Both assume Obama vs Romney with no strong third party candidate. Both show polling as it currently exists. Things will change before election day. On the map red is Romney, blue is Obama, gold states are too close to call. Lines on the chart represent how many more electoral votes a candidate would have than is needed to tie under several different scenarios. Up is good for Obama, Down is good for Romney.
One state changes status today:
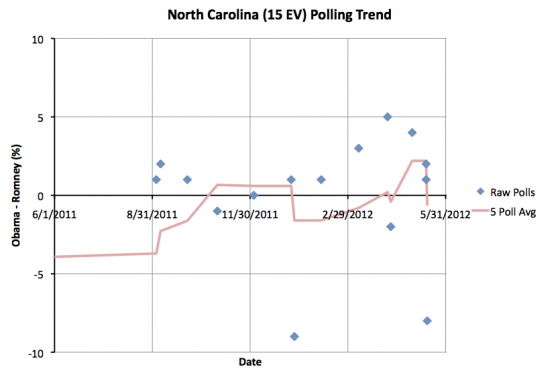
North Carolina moves from Obama up by 2.0% to Romney up by 0.6%. Either way, this is too close to call. North Carolina remains a swing state. Now, the latest poll actually has Romney ahead by 8%. This might be the start of a larger move toward Romney. Or maybe it is an outlier. It is too early to tell. For now, North Carolina is now a swing state that leans ever so slightly to Romney.
Since North Carolina remains too close to call, this doesn’t change either candidate’s best case scenarios, which represent the range of reasonably possible results based on current state polling. The current line drops a nice ways in Romney’s direction though.
|
Romney |
Obama |
| Romney Best Case |
276 |
262 |
| Current Status |
235 |
303 |
| Obama Best Case |
170 |
368 |
Glancing at the chart, it looks like there has been a nice move in Romney’s direction lately. Lets look at some specific numbers and compare to one month ago. One month ago was the first time that the state polls showed Romney’s best case being to lose. Things clearly look much better for him today.
On April 18th, Romney’s best case showed him losing 260 to 278. Now he wins 276 to 262. He has moved 16 electoral votes (net) back into contention that a month ago seemed out of reach.
On the current line, a month ago Obama was winning 328 to 210. Now he is only winning by 303 to 235. Over the last month Romney has pulled a full 25 electoral votes (net) over the line toward him.
As for Obama’s best case… no change. The needle hasn’t moved at all. Obama hasn’t managed to pull more electoral votes into being competitive, nor have any moved out of reach.
So the movement has definitely been in Romney’s direction. If he keeps it up, we’ll start to see the map looking much more competitive soon.
By comparison, look at 4 years ago… the two best cases were much more symmetric around the tie line. The candidates were more evenly matched and the range of possibilities was not really favoring either candidate. It was clearly a wide open race four years ago. Having a lot more swing states helped.
The “current” status looked very similar to today’s though… we had McCain 302, Obama 236. Reverse the parties, and we are almost exactly in the same place we are today. Of course McCain did not go on to win. One should look at Obama’s current lead in the model with that in mind. There is still a long time until November.
Edit 2012 May 20 06:39 UTC – Fixed Map, SC was incorrectly colored as a swing state, it is now correctly colored as “Weak Romney”.
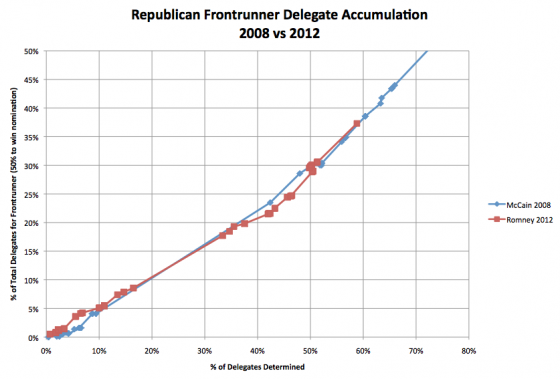
Not much to say here. The small gap between Romney’s rate of accumulating delegates compared to McCain’s in 2008 has completely closed. It is absolutely clear that any differences in perception on how fast Romney was “closing the deal” vs McCain were 100% due to the elongated calendar. When you look at things by % of delegates accumulated vs % of delegates allocated, the two years track each other very closely. In the early days of the campaign (before about 20% of the delegates) Romney was actually a bit ahead of McCain’s pace. From there though 50% or so, Romney was slightly behind McCain’s pace. The key word being slightly. And now they once again very closely match.
So that whole narrative about Romney not matching McCain’s performance in 2008… just completely not true in terms of the delegate races. It just seemed that way because everything happened in a comparatively compressed timeframe in 2008.
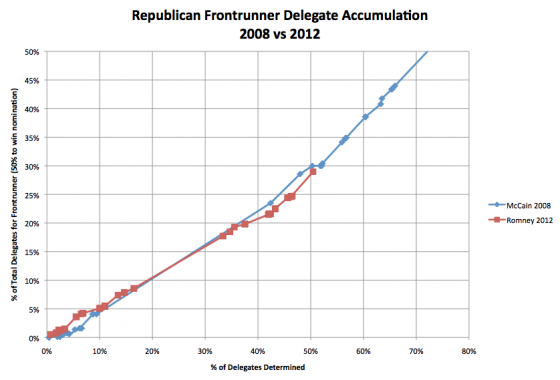
We’d last talked about this after Louisiana. But at that point in terms of % of delegates allocated the 2012 progress in the race still hadn’t gotten to where we were in 2008 immediately after Super Tuesday. We were in the 2008 “gap” caused by the large number of delegates allocated on Super Tuesday in 2008. At this point in the race, on April 4th, we are STILL not quite past where we were once all the 2008 Super Tuesday delegates were counted. But we are close…
And once again, we see that, yes, Romney is behind where McCain was at the corresponding place in the delegate hunt. But it is very close. It is not a big substantial difference. Right now we have 50.4% of the delegates allocated and Romney has 29.0% of them. On the day in 2008 we finally had all the results from Super Tuesday (February 9th) we had 52.1% and McCain had 30.0% of the delegates.
So Romney is 1.0% or so behind McCain’s pace from 4 years ago once you are looking at an even scale based on % of delegates determined so far. These lines fairly neatly track each other. There is NOT a substantial gap where Romney was underperforming McCain.
The perception certainly has been that there was. Romney having problems wrapping it up and such. But this is 100% due to the stretched out calendar. It is not due to winner take all vs proportional. It is just about the calendar. The fact that here on April 4th, we STILL haven’t allocated as many delegates as were allocated on February 9th back in 2008 is extraordinary. This is why it SEEMS like it has taken a lot longer to wrap things up… because it has! But in terms of the calendar only. The Republicans stretched out the whole race by spreading the contests out, so of course it takes more calendar time for the winner to consolidate their win. Duh.
But this doesn’t support the conclusion that Romney was somehow less able to consolidate Republican support than McCain was. They really have moved through the process at a remarkably similar rate.
It just doesn’t seem like it because the process is so stretched out this time.
I had promised an update of the 2008 vs 2012 frontrunner graph after Louisiana. I had thought we would have about 52% of the delegates allocated (or estimated) at this point, but I was wrong. States responsible for about 52% of the delegates have “started their process” according to Green Papers, but not all of those delegates are determined yet, for a variety of reasons. Instead, we are only at about 47%.
52% is a good place to compare because that is where things were in 2008 right after Super Tuesday was all settled. In 2008 we were closest to the 47% mark on February 7th, which was after Super Tuesday, but still with only partial results from those contests. So the comparison will be better after we get past that point.
In any case, here is the update after Louisiana:
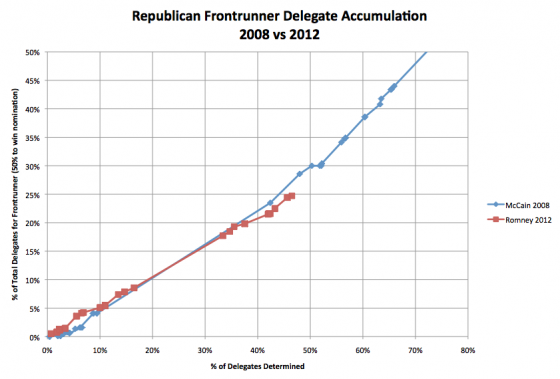
Romney is still behind McCain’s pace four years ago, but not by very much. It isn’t a dramatic difference. It just FEELS like it is because of the very different calendars in 2008 vs 2012. But really, the two candidates are tracking each other pretty closely by this analysis.
The chart by Seth at Enik Rising still shows a much bigger apparent difference. (As of when I write this, he has updated for Illinois, but not Louisiana.)
In my previous analysis I’d determined that the two graphs actually have very similar data. The difference in how they are perceived is due to three main factors:
- I connect the dots for each day, while ER does a linear regression. Since ER’s linear regression includes data from after when McCain was the clear winner in 2008, it pulls the McCain line up further on his chart than if he only included data up to the same % we are in the 2012 race.
- I have daily data points from both 2008 and 2012, compared to data only with the final full results at ER. The partial results in the days after Super Tuesday in 2008 keep McCain’s line a little lower than if you had just drawn a straight line from before Super Tuesday to the first data point after complete Super Tuesday results were available.
- He’s got a taller vertical scale, which means psychologically the vertical gaps look bigger on his chart than mine, even if they are really about the same.
Anyway, interesting to look at the data in these two different ways.
DC, Maryland and Wisconsin happen on April 3rd… all winner take all. There are no polls in DC and Maryland, but those don’t seem like Santorum country. The most recent poll in Wisconsin, a Rassmussen poll (the only one taken in March so far) has Romney ahead.
If Romney does win all three of those contests, we’ll be at 51% of the delegates allocated (or estimated) and Romney will ALMOST have caught up to McCain’s pace in 2008. (Romney will have 29% of the total delegates, where at the comparable point McCain had 30%.)
We’ll see if that is how it plays out. I’ll do another update of this chart after we have those results.
The following was also posted as a series of comments both on the last post here and on the Enik Rising blog, but I thought it was worth repeating as a full fledged post as well, because it helps interpret the graphs in the last post more intelligently. Bottom line, the % vs Absolute difference didn’t make a big difference in the two charts, our underlying data was nearly the same, but some minor differences made the two charts appear to give entirely different conclusions. I’ll post a revised chart once we get past Louisiana.
Anyway, the comments…
First, I commented on Enik Rising with a link to my last post. Seth replied in the comments with:
Thanks for noticing my error! I’ve added a new chart above, although it looks virtually identical to my previous one. I assume the big difference comes from the different methods of determining delegate shares.
March 20, 2012 8:58 AM
The addition to his earlier post was:
Update: Samuel Minter makes the very important observation that there are different total numbers of Republican delegates in 2008 and 2012, making a direct comparison of raw delegate counts misleading. I don’t have a good excuse here. Anyway, I went ahead a changed the raw counts to percentages and produced… almost exactly the same chart:
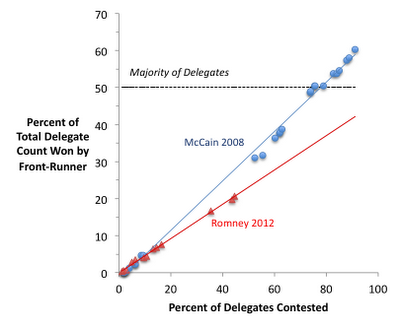
I’m not really sure why his chart looks so different from mine. Perhaps it’s because he’s using Green Paper numbers rather than RCP numbers, perhaps because I use a linear projection and he doesn’t….
So of course I had to dig deeper. At first I was sure it was just different sources doing delegate counts differently. Then I was sure it was the 2008 results being complete results that came later dated back to the original primary/caucus dates vs incomplete results now. Both of those were incorrect. When you actually look at the data points on the two charts, they actually match up very nicely.
The TL;DR: The data points in my chart and his chart actually line up quite nicely. But….
- I have some extra points due to partial results from Super Tuesday before things were final that show McCain closer to Romney at the percentage we are right now. This keeps the two lines closer together for longer.
- The line he draws for Romney has the slope increased due to the fact it contains many post-Super Tuesday points… the time during which McCain had wrapped it up and started getting delegates at a faster pace.
- My chart is wider than it is tall, while his is taller than it is wide, so the same vertical difference between lines looks greater on his charts.
These three things fully account for looking at these two charts and seeing two different things even though the underlying data is very nearly the same.
So here is what I posted in the comments on Enik Rising as I was figuring it out:
Thanks for taking a look Seth. Lets try to figure out why the two charts look different.
The source counts are different of course, but not by much, at least for 2012. RCP has Romney at 516 delegates right now (22.6% with 42.0% determined), Green Papers has him at 515 (22.5% with 43.3% determined). So Green Papers actually has the Romney 2012 line LOWER than you would get with RCP, but they are pretty close.
It must be the 2008 numbers that differ between the sources then. RCP’s line must be much higher than the line I got from tracking CNN in 2008.
Looks like on the 2008 line you have a data point at about (60%,37%). My data taken daily from CNN back in 2008 had 60% being hit on February 20th. At that point the count was McCain 918 out of the 2380 delegates, or 38%. So… almost the same place you have your data point. It looks like our data points around the 50% mark in 2008 line up pretty well too.
Hmmm…
Ah! I know now. I have a few additional data points that come from the days right after super Tuesday since those results came in over the course of a few days and I took snapshots of the count every day, rather than just having the final results as if they were immediately known on Super Tuesday. I have additional data points other places as well due to more intermediate results.
So I have more data points right around the percentage we are at right now, whereas on your chart right now Romney is in the gap caused by Super Tuesday and the next data point for McCain is the one with complete 2008 results. And it looks like those initial delegate results I have filling in that gap were slightly less favorable to McCain than the results that came in more slowly over the next couple of days. (My spreadsheet is linked on my wiki, feel free to look through the details.)
Then the rest of your data points are AFTER Super Tuesday. But of course after Super Tuesday McCain started accelerating because he was the presumptive nominee and so started collecting delegates faster at that point. Both your linear trend line and what the eye is drawn to for the data points, picks up on that accelerated post-Super Tuesday velocity and thus pulls the trend line to a higher slope.
Between these two things (my additional data points for partial super Tuesday results and McCain acceleration after passing the 52% mark) I think we completely explain the difference between the two charts.
March 20, 2012 1:43 PM
And then in a follow up… (Well, OK, I had to split it into two comments because I was unnecessarily long winded and it was too long for one comment… I could have edited it down to the TL;DR above before posting it as a comment, but I didn’t… Oops.)
From SM via Enik Rising:
The place where that “kink” happened and McCain started accelerating happened immediately post Super Tuesday. In 2008 once all the Super Tuesday results were in, the delegates awarded so far percentage was at just about 52%. This is about where we will be this time around right after Louisiana on Saturday.
So if we both redraw our graphs when we add the data points for Illinois and for Louisiana, we should see our data points for the 52% mark line up much more closely with each other again, and we’ll be looking at a comparison with data points close to the same percentages again (as opposed to Romney currently being in the “Super Tuesday gap” when compared to 2008).
At that point I think we’ll have a clear picture of how far behind McCain’s pace Romney really is at the moment. Right now the big 2008 Super Tuesday gap makes the comparison very dependent on small details of the analysis.
After Louisiana we’ll be able to compare 2012 at 52%, with 2008 at 52% and have a real apples to apples comparison.
So what would it take for Romney to catch up with where McCain was at the 52% mark? Lets do that math really quickly… To catch up Romney would need to hit the 30% of total delegates mark… or 686 delegates. That is a gain of 171 delegates. There are only 115 delegates between Illinois and Louisiana, and not all of them will be determined this week, and Romney won’t be getting 100% of them anyway, so that clearly isn’t happening.
Romney will be behind McCain’s pace no matter what, the only question will be by how much. My charts will start to show Romney falling behind McCain too at that point.
(And more relevantly for this time around, is he able to get enough to be on pace for 1144, or do we get brokered convention talk getting louder and louder in volume….)
Anyway, mystery solved. I think. :-)
March 20, 2012 1:43 PM
And then I thought of the aspect ratio thing:
I know, too long already, but thought of one other factor. My chart is wider than they are tall, where yours is taller than it is wide. This means the same vertical difference on both charts will look larger on your chart.
Between these three things, the difference in perception of the two charts is fully explained, even though the underlying data is essentially the same.
Anyway… Illinois. :-)
March 20, 2012 8:25 PM
Moral of the story… little details matter in charts like this, and can greatly affect the conclusions you draw from looking at them.
I had previously talked about the comparisons between the 2012 and 2008 Republican races here, here and here. The last of those is the most relevant, and if you haven’t checked it out before, feel free to go back and do so now. :-)
In any case, a few hours ago I saw this tweet from @DemConWatch. It links to the article below. I’ve quoted the key conclusion, but please click through and read the whole thing.
Romney, McCain, and the long slog to 1,144
(Seth, Enik Rising, 2012 Mar 19)
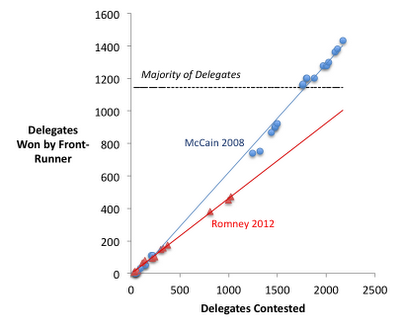
Below, I’ve charted McCain’s and Romney’s delegate shares compared to the total number of delegates that have been awarded to date. So, for example, by the time 1,247 delegates had been awarded in 2008 (Super Tuesday), McCain had won 740 of them. (I’ve used RCP’s estimates of delegate shares in 2008 and 2012.) I’ve projected a linear path for both years.
So the big thing to note here is that Romney is accumulating delegates at a slower pace than McCain did four years ago. Also of note: Romney will not get to 1,144 delegates (a majority) by the end of the primaries and caucuses assuming he keeps accumulating delegates at his current pace.
The thing I immediately noticed… the total number of delegates was different in 2008 and 2012! In 2008 there were 2380 delegates total. In 2012 there are only 2286! So using absolute numbers of delegates on the axes is not doing a direct comparison. You need to look at these as percentages of the total number of delegates available.
So I redid the chart on that basis, using the data I had collected in my 2008 Delegate Race Page (which used CNN’s delegate counts, grabbed and put into a spreadsheet on a daily basis) and which I am now collecting in my 2012 Delegate Race Page (which uses the Soft Count from Greenpapers including DCW’s Superdelegate numbers also grabbed daily for a spreadsheet).
Now, both my 2012 and 2008 numbers include so called “fantasy delegates” projecting the eventual results from caucus states, etc, which many folks argue is not the right way to track delegates, but since both years followed that practice, it seems like a valid comparison.
In any case, the result is this:
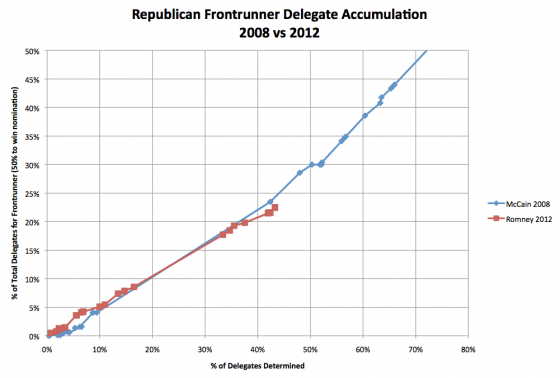
Romney is indeed behind McCain’s pace, but only very slightly, and that only developed in the last few contests. For most of the race so far, the pace of the two candidates tracked very closely, with Romney actually being ahead of McCain’s pace until Super Tuesday. He certainly is not as far behind as he appeared in Seth’s chart from Enik Rising. Rather, once you correct for both the calendar changes and the differing number of delegates, we see that the whole narrative of Romney being much slower to wrap things up than McCain was four years ago just falls apart.
I’ll note that using the Green Papers count instead of the RCP Count that Seth used puts Romney slightly BETTER than the pace he needs to get to 1144 rather than slightly worse than that pace. And indeed, which sources you use for both the 2008 and 2012 delegate counts probably matters here. Given how much the various estimates vary I imagine how far the two lines are from each other may be quite different based on which delegate counts you use… but the above is what I get using the sources I chose to use for tracking in these two cycles.
I’ll also use this opportunity to update the comparison between 2008 and 2012 using the metric I prefer… “% of remaining delegates needed to win”. This hits 100% once a candidate is mathematically eliminated or hits 0% once they have the needed number of delegates to secure the nomination.
In 2008 on the Republican side the chart of this number for the various candidates looked like this:
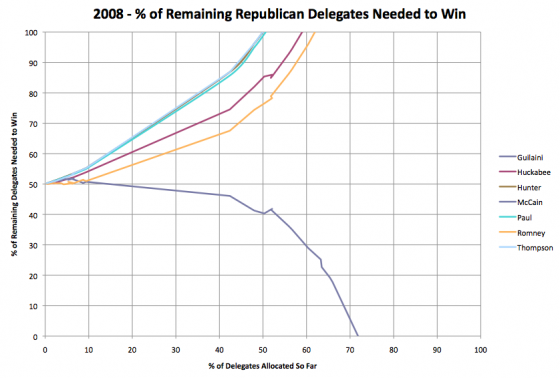
As of right now in 2012 (a few hours before the March 20th Illinois primary) this looks like this:
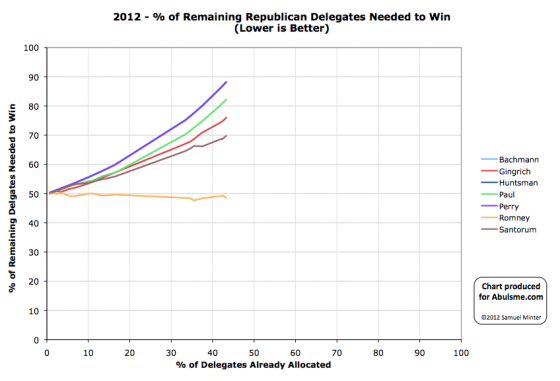
Comparing these, as with the other chart, you can see that McCain in 2008 was indeed a bit better off at this point than Romney is this time around, but not by a huge margin.
Using the sources I noted above, as of today 43.3% of the delegates have been allocated (or at least estimated in the case of those pesky fantasy delegates). As of today Romney needs 48.5% of the remaining delegates to wrap up the nomination.
The closest equivalent day in 2008 would have been February 6th 2008 (just after Super Tuesday, with incomplete delegate results from those contests as results trickled in over several days) with 42.4% of the delegates determined (or estimated). At that point McCain needed 46.1% of the remaining delegates to win. Unquestionably better than Romney today, just not by a HUGE margin yet.
In any case, the massive perception difference in terms of how well Romney is “wrapping it up” in 2012 compared to McCain in 2008 is almost all due to the spread out calendar. In reality, Romney is actually only a little bit behind McCain’s pace four years ago. It just SEEMS like he is much much further behind due to the fact it is the end of March at this point rather than the beginning of February which is when we were at the equivalent point in the delegate race back in 2008.
Finally, just for an additional comparison, here is the same graph for the Democrats in 2008…
(Minor wording edits and fixes were made in the 90 minutes or so after posting.)
OK, beating a dead horse a bit, but I finally made graphs, so one more look. (Previous comments on this here and here, 2012 Delegate race here, 2008 Delegate races here.)
The key is that while if you look at the calendar, and say where were things on February 22nd 2008…
On the Republican side you’d see that McCain had for all intents and purposes wrapped things up. On that date 60.4% of the delegates had already been allocated. McCain had 63.9% of the delegates, while his closest competition (Romney) only had 19.9%. In order to get to his magic number McCain only needed 29.0% of the remaining delegates. For Romney to catch up, he would have needed 96.0% of the remaining delegates. Romney was just days away from being mathematically eliminated (that would happen on February 26th).
Meanwhile on the Democratic side, 64.1% of the delegates had been allocated. Obama had 50.8% of the delegates to Clinton’s 48.2%. To win Obama needed 48.6% of the remaining delegates, Clinton needed 53.3% of the remaining delegates. Clearly the Democratic race was still close (although from here on out, Obama just increased his lead, Clinton never really made up any ground except when Florida’s delegates were reinstated near the end). But the Republican race was over.
You’d then compare to Romney today and build a narrative of Romney not being able to close the deal, of wondering why he can’t just wrap this up, after all McCain had wrapped this up by this time, right?
But this year, on the Republican side, as of today we only have 11.0% of the delegates allocated (and that counts estimates from caucus states, it is less without that). So how does this year look and compare with 2008 when you look at it by % of delegates allocated instead of by date?
Well, here is the “% of remaining needed to win” chart with % of delegates allocated on the horizontal axis instead of date:
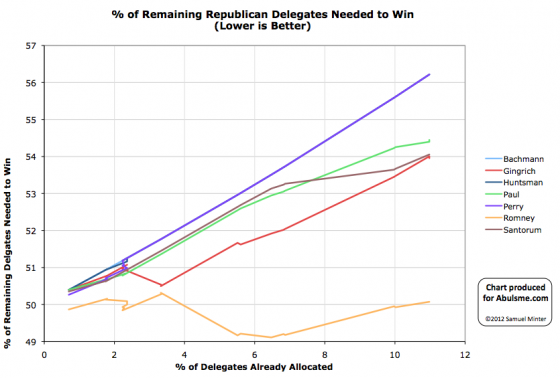
You can see clearly that Romney is well ahead of his competition, and while he isn’t yet diving down toward zero (indicating he is heading quickly to the nomination) he is holding steady, while everybody else is trending upward toward being eliminated. Gingrich and Santorum are neck and neck for 2nd place and both need about 54% of the remaining delegates to catch up and win. 54% is not an impossible number in a two man race. It is a lot better than either has done so far, but if one of them stops getting delegates and the other picks up all of their support, it is in the realm of the possible. But it would be a significant change from what has happened so far. Note, for instance, that even when Santorum won states, he didn’t win by a big enough margin to actually be catching up. His line still went up.
Now what did this look like in 2008? The closest comparison for the Republicans would be as of February 5th… the day before Super Tuesday. At that point 9.4% of the delegates had been allocated.
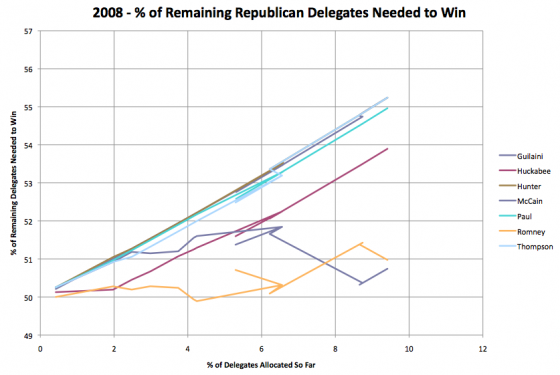
What do we see here? A very different pattern. McCain had only recently (in terms of % of delegates) pulled ahead, but Romney was still close… and gaining! We had a two person race where both were within shooting distance of each other, and neither were yet heading either rapidly up or down on this chart, indicating that they were either on the way to elimination or to the nomination. In 2008 at this point, things really were still close. The very next day, on SuperTuesday, McCain would essentially run away with it, and that would be that. But comparing comparable points in the delegate race, Romney actually has a much bigger lead and advantage on his competition than McCain had in 2008.
One more comparison though… The Democrats in 2008. The comparable date there is also February 5th, the day before Super Tuesday. 10.3% of the delegates had been allocated on that side on that day.
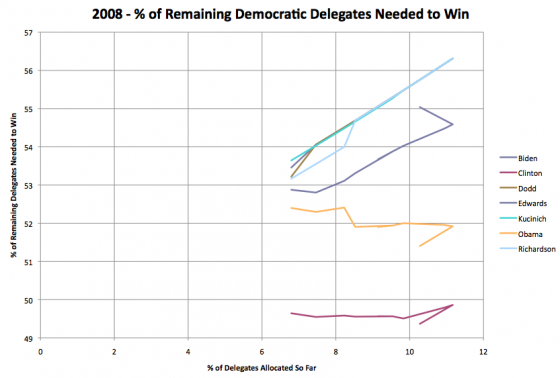
There are a few oddities in the data from back then… my sources had allocated some delegates, then backtracked, causing the little bit of backtracking on the chart, and when my tracking started on January 1st almost 7% of the delegates were already in place because of Super Delegates who had declared their preferences)… but you can still see the trends.
So, most important thing you see here… Clinton was still in the lead! Obama didn’t catch her in delegates until significantly later. But it is clear that both Obama and Clinton are still in contention. Their lines are basically horizontal, and they were pretty close to each other. Neither of them had started moving toward the nomination really, but neither was showing a pattern of getting eliminated either… like Edwards and all the rest were.
In this year’s race, all of Romney’s competition are in worse positions than McCain’s competition was at the same time. It is not yet too late for one of them to mount a push and catch up… but it is getting close. Even with the vastly stretched out schedule, there is still a big enough chunk of states coming up on Super Tuesday that we’ll probably see that day be the do or die day for all the not-Romneys. At least for actually catching up and winning. Blocking Romney from 1144 is a lot easier task than actually winning at this point. We’ll know a lot more about how possible (or not) that scenario is after Super Tuesday as well.
OK, long post, but finally, for reference, here are the two races in 2008 in full as they played out (rather than just looking at the first 12%).


And here is this year’s Republicans at the same scale…
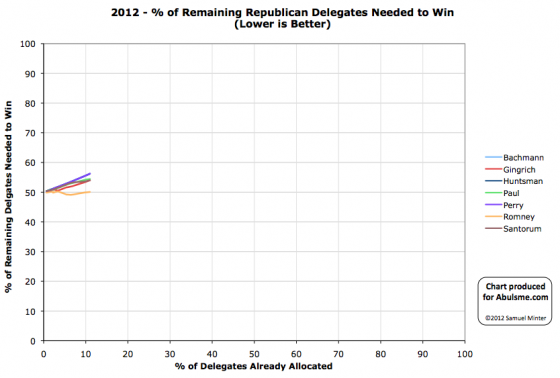
Just a little ways left to go, huh?
I couldn’t stop thinking about it, so another thought comparing the Republican race now versus 2008. This was also first posted as a comment on the Primary Season Amnesia post on Chris Weigant’s blog.
One more follow up thought… it really is very important that the calendars are so different between this year and 2008… so let me explicitly do the conversion. As of today, 2012 Feb 14, we have 10.98% of the available delegates allocated or estimated. The closest comparison we would have had in 2008 was February 4th and 5th, at which point 9.41% of the available delegates had been allocated.
On that day… McCain was ahead of Romney, but just barely. McCain had 43.3% of the delegates so far (and needed 50.7% of the remaining delegates to win). Meanwhile Romney was his closest competition and right behind… 41.1% of the delegates so far (and 51.0% of the remaining delegates needed to win.) This was still a race. These guys were very close to each other at that point. (Unlike this year, where Romney has a very substantial lead on Gingrich at this point.)
So if anything, at a comparable point in the delegate race (as opposed to the time of year) Romney is actually MUCH better off than McCain was at the same point. Gingrich is much further behind Romney than Romney was behind McCain. Romney and McCain were neck and neck. Gingrich is nowhere close to Romney in delegates, and everybody else is even further behind.
But February 5th was Super Tuesday. It took several days for all the delegate estimates from Super Tuesday to be complete… but most of them were in by February 8th, and no other primaries or caucuses had happened yet. At that point 50.29% of the delegates had been allocated. McCain now had 59.6% of the delegates so far, and only needed 40.3% of the remaining delegates to get to the magic number and win the nomination. Romney by contrast, now had only 23.9% of the delegates and needed a full 76.5% of the remaining delegates to catch up and win.
So post-Super Tuesday, McCain could do worse than he had done so far by a 20% margin and still win. But Romney needed to more than triple how he had been doing in the delegate count to catch up and win. These are again the kind of numbers where the press will still call it a race because it is fun, but the reality is that in order to close that kind of gap the front runner essentially has to totally collapse AND things have to go very very right for their challenger too…
As for this year, things are MUCH more spread out. After Super Tuesday we’ll still only have some 35% of the total delegates allocated, as opposed to over 50% in 2008. So even if after super Tuesday, Romney is finally starting to get his “% of remaining needed to win” to come down instead of staying flat, he’ll have a decent slog to actually collect the 1144 delegates. If he still is hovering around 50% of the delegates (or less!) at that point instead of routinely winning more than half of the delegates, then we’ll have quite a nice bit of fun before we get to the end of this, and the possibilities of brokered conventions start becoming more real.
But in terms of the delegate race, in comparison to 2008, it is really very early. On February 14th 2008, 56.55% of the delegates were already allocated. We won’t get to that point in 2012 until the end of March or beginning of April (depending on how fast super delegates announce their positions). It was very front loaded last time. This time it is very stretched out….
This morning I saw a post referring back to 2008 race. The part that caught my attention was this:
Primary Season Amnesia
(Chris Weigant, 2012 Feb 13)
Even accounting for such differences, the 2008 race was still a very close three-way contest in early February. Romney and McCain were almost even in states won, with Huckabee not all that far behind. This year, Mitt Romney has won four states, Rick Santorum four, and Newt Gingrich one.
You’d think the media would remember these facts, but (once again) we are being subjected to endless stories about how downright unique the 2008 Republican primary season is, along with the exact same storylines that ran in 2008 about the frontrunner not being able to close the deal, especially with conservative voters. McCain, back then, raised just as many suspicions among the conservative Republican base that he “wasn’t one of us” that Romney now hears.
I had to respond, as while I have no doubts that the media narrative was all about McCain still having trouble closing, the delegate numbers just didn’t support that story. (The media would do the same thing months later while they continued to talk breathlessly about the Obama vs Clinton race long after it was mathematically clear that it would take an absolute unprecedented miracle for Clinton to actually catch up and win.) Anyway, I posted the following as a comment at Chris Weigant’s site. (Awaiting moderation as I post this on my site.)
Sorry for the really long comment… probably should just post on my blog. :-)
The media narrative in 2008 at this point in time may well have been that McCain was having problems closing the deal, but looking at delegate counts, there was a very different story. There was NOT a close three way race in mid-February. Take a look at my page showing how the delegate race played out in both parties last time around:
http://wiki.abulsme.com/2008_Presidential_Delegate_Graphs#Republicans
By this time in February (indeed, essentially immediately following Super Tuesday, but he continued to consolidate after) McCain had essentially already put this away.
The key thing I use to measure this is the percent of the remaining delegates available that the candidate would need to cinch the nomination. This takes into account both what the candidates already have gotten, and the dwindling number of remaining delegates available to catch up. At this point in February 2008, McCain had amassed a big enough lead that he had over 60% of the delegates allocated thus far, and only needed about 35% of the remaining delegates to clinch the nomination. In other words, he could do much worse than his record up to that point and still win. By comparison, at this point his closest competition was Romney, who had collected about 22% of the delegates so far, and would have needed to get about 87% of the remaining delegates to catch up and win. 87%!!!! Compared to the 22% he had managed so far! This was not a realistic outcome absent a major McCain collapse or scandal… and probably the other candidates dropping out too.
Starting with Super Tuesday last cycle, you can see the clear pattern of McCain completely dominating the race and all other opponents just falling further and further behind while McCain races toward clinching the nomination. Any narrative about him not closing the deal was just not borne out by the numbers.
As you pointed out, the HUGE difference is that we have had less states and a smaller percentage of the delegates allocated so far. Even super Tuesday will be smaller than last time, everything is just more spread out that last time, which means in terms of TIME (as opposed to states) one would of course expect it to take longer for things to settle.
(And indeed perhaps, really, the better time to compare to would have been mid to late January in 2008, when things really were still more unsettled and less states had voted… McCain only even took the delegate lead from Romney on January 30th or so…)
But sticking with February and comparing this year:
http://wiki.abulsme.com/2012_Republican_Delegate_Count_Graphs
Looking at the “% of remaining needed to win” you see all the non-Romney’s rapidly heading upward. With each contest (with the exception of Newt’s win in South Carolina) even if they win, they aren’t winning by big enough margins to be on a pace to actually win the nomination outright. Meanwhile though, there is a big difference from 2008. Rather than Romney’s numbers indicating that he is getting an easier and easier path to the nomination after each state as he gains more and more delegates, we see him hovering around 50%. Right now he is slightly under. (I should say at this point that I use the delegate estimates from the primaries and caucuses by The Green Papers, and the Super Delegate estimates from Democratic Convention Watch.) Romney is staying flat, but to “close the deal” in terms of winning outright before the convention, he has to actually start collecting delegates at a slightly faster pace than he has been so far.
Right now Romney’s closest competition is still Gingrich (although Santorum is closing fast). Right now Gingrich has 17.9% of the delegates so far, and would need to get 54.0% of the remaining delegates remaining to catch up and win. (Santorum and Paul would have to do even better than that.) Now, 54.0% is not an outrageous number, but it is more than three times better than he has been doing so far!!! If that were to start to happen (or the equivalent with the other candidates) it would be a HUGE change compared to what has happened so far in the race. And it would have to happen soon, because if not, that 54% is just going to rise and it will get harder and harder to catch up. One of the other candidates catching up and winning is not impossible, but it would take a major seismic shift changing the dynamics of the race. Perhaps Gingrich continuing to drop rapidly with Santorum picking up most of his support, winning Michigan and getting momentum out of that going into Super Tuesday would do that… but it still needs to be a big change for one of these guys to catch up.
Meanwhile, so far Romney has 49.8% of the delegates so far, but would need 50.1% of the remaining delegates to close the deal. So he has to improve his performance, but just by a LITTLE bit in order to be on pace to actually win the nomination… a few nice big winner take all states would most likely be enough to do the trick. But he is NOT putting it away or closing the deal yet. If all the not-Romney’s combined keep operating at about the level they have been, Romney would get to the convention just short of the 1144 delegates he needs.
Now, there is a long time between now and then, and if he wins the winner take all states and doesn’t completely collapse in the proportional states, he should be able to do that “little bit better” that he needs and wrap this up. At the moment though, none of his competition are in a position to actually WIN unless there are dramatic changes in the dynamics of the race (for instance one of them drops out), but they ARE in a position to block Romney from getting 1144 if they continue to do as well or better (collectively) as they have so far…
(In 2008 at this point, all of McCain’s competition combined were not in a realistic position to even keep him from getting the magic number, let alone catching up to win.)
None of this means I’m predicting a brokered convention… yet. But if Romney is still above 50% of remaining delegates needed after we pass Super Tuesday… then I’ll start to look at that as a realistic possibility. Until then, he is still actually the front runner, although he has clearly lost some momentum.
But Arizona is winner take all, and he is still way ahead there. Michigan is proportional, so chances are even if Santorum wins, it won’t be by enough to actually be on a pace to catch up. A win there would clearly put Romney in danger on Super Tuesday though. But more immediately Arizona is the one to watch because it is winner take all. If Romney wins that, then he consolidates his lead, regardless of what happens in Michigan. If Romney LOSES there… then he is in real trouble.
I’ll note that we also talked a bit about this topic on the episode of the podcast that Ivan and I recorded on Sunday and that I haven’t posted yet (sorry!) but will probably (hopefully!) post tomorrow.
|
|


