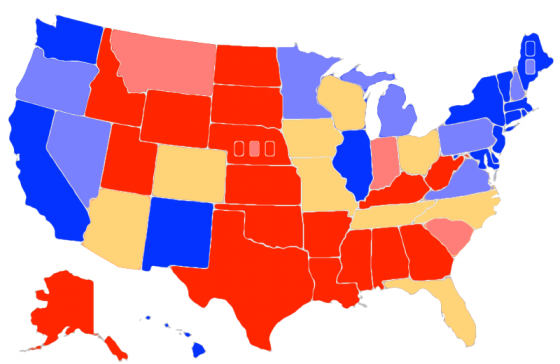
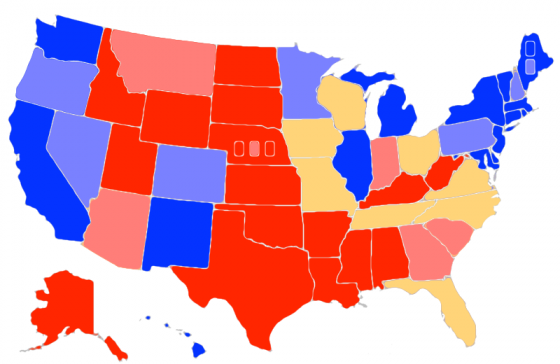
Two changes in category today, and bucking the recent trend, they are both moves toward Romney. In reverse order of electoral college weight:
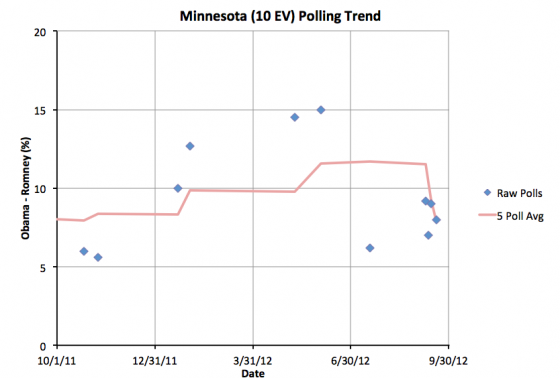
Minnesota (10 electoral votes) had been pretty sparsely polled before the conventions, and the five poll average had shown an Obama lead as high as 11.7% in July. With the batch of new polling in September, Obama’s lead has now dropped to only 7.9%. “Only” is of course relative. 7.9% is still a pretty substantial lead. Minnesota is not in play right now. The only question is how much Obama is going to win by. It looks like Obama’s margin will be less than it once looked like it might be. But this should still be an easy win for Obama.
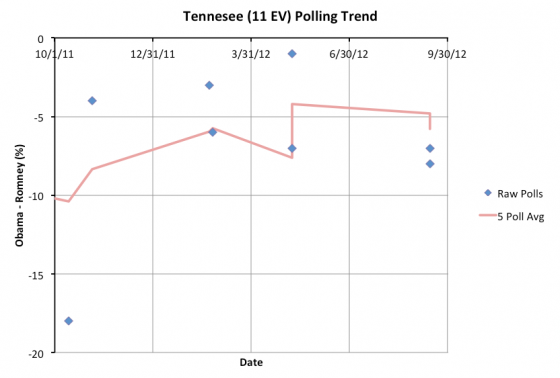
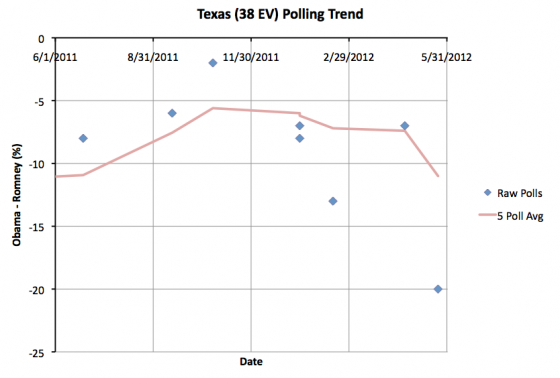
Tennessee (11 electoral votes) is another state that hasn’t been polled all that often. The last set of polls, back in May, had moved the five poll average to a Romney lead of less than 5%, specifically a 4.2% lead. That had put Tennessee into the set of states my model thought could go either way. After all, a 4.2% lead is pretty slim. The right set of things happening, and perhaps Obama could have actually taken the lead there.
Well, the new set of polls added this week, which are actually two related results from YouGov, moves the average to a 5.8% Romney lead. As far as my model is concerned, that pulls Tennessee out of reach for Obama. Tennessee always seemed like a big stretch for Obama. It always seemed a bit odd that it was showing up in the “close states” category. Well, it now resumes a more natural looking position as a “Weak Romney” state, meaning that Romney has a big lead there, but maybe not so big a lead that he should completely ignore it.
Of course it will get ignored, because Obama doesn’t need it to win. Any scenario that has Obama winning Tennessee is probably an Obama landslide. So Obama isn’t going to pay attention to it. Meanwhile, if Romney is in a position where he is really fighting to win Tennessee, he has already lost. Given he is way behind right now, he needs to be concentrating on states where Obama is ahead to try to bring them back over to his side of the line. Spending time shoring up a state like Tennessee would be a waste of resources for Romney too. So, no attention for Tennessee. Poor Tennessee.
So where does this put the summary? Minnesota has no effect because it was never close. I no longer consider winning Tennessee to be a possibility for Obama, so Obama’s “best case” gets a little worse:
| Romney | Obama | |
|---|---|---|
| Romney Best Case | 278 | 260 |
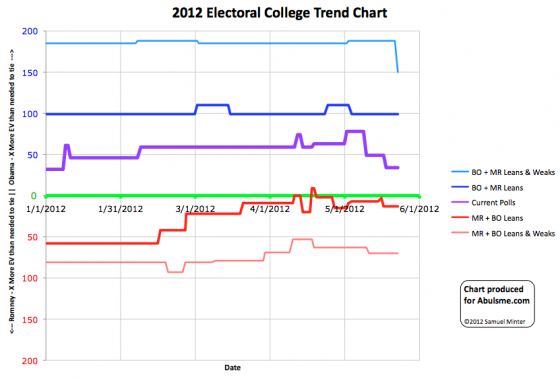
| Current Status | 191 | 347 |
| Obama Best Case | 191 | 347 |
The interesting thing here is of course that the current status is now the same as Obama’s best case. This is because there are no longer ANY close states where Romney is ahead. Tennessee is no longer close because it is now more solidly Romney. So that is good for Romney. Two states moved TOWARD Romney today. This is GOOD for Romney compared to yesterday.
But the overall situation remains very very difficult.
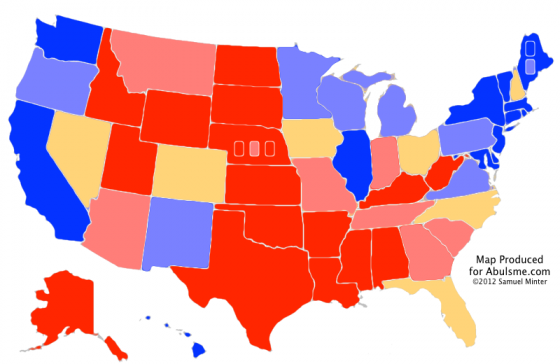
The remaining close states… Florida (29), Ohio (18), North Carolina (15), Colorado (9), Iowa (6), Nevada (6), and New Hampshire (4)… are all states where Obama is ahead.
Now, all of those states are close, and some of them are very close, with Obama’s lead no more than a sliver. Romney could retake the leads in one or more of these states with a little bit of a good news cycle and just one or two good polls.
But what this effectively does is put Obama at his ceiling. Previously, there was headroom above the “current” situation. You could imagine Obama doing a bit better and moving one or more states that were close but leaning Romney to being close but leaning Obama. Now there are no more Romney states that are close… states that one could easily imagine Obama picking up.
To do any better than a 347 to 191 win… which is where the state by state polls put him right now… Obama would need to start picking up states where Romney is ahead by more than 5% (but ones where he is ahead by less than 10%, because we need to retain at least some realism).
The areas in this category are now Georgia (16), Arizona (11), Indiana (11), Tennessee (11), Missouri (10), South Carolina (9), Montana (3) and Nebraska’s 2nd Congressional District (1). With the possible exception of Nebraska’s 2nd, which is very infrequently polled but where a poll this week showed the race tied, all of these seem like BIG stretches right now. Even if Romney collapses further and Obama expands his national lead, one could maybe see some of these getting closer again, but they have a long way to go to actually end up in the Obama win column.
As he was looking at the wiki between my update there and this post, a reader asked a question: Has this happened before?
I knew it hadn’t happened in this cycle, but I had a vague memory of there being some time in 2008 where all the close states were leaning in one direction. But I was wrong. Looking at my 2008 analysis, this didn’t happen then either. (I wasn’t doing this in 2004 or before, so I can’t speak to those years.) So indeed,with my method of classifying states… with leads in a five poll average less than 5% being considered “close” states that could go either way… this is the first time in two election cycles where ALL of the “close” states have leaned toward one candidate.
The positive spin for Romney is that Obama has reached a top. It will be very hard for him to do any better in the electoral college than where things are right now.
Of course, the flip side of that is that at the moment Obama is pretty far ahead, and to win Romney has to win almost all of the close states… all of which he is behind in at the moment.
This is not where a candidate wants to be in late September.
It isn’t quite time to just call the race for Obama and go home.
But it is getting close.
Last time around I “called the race” on October 3rd. In 2008 that was the first time we had a situation where McCain’s “best case” in my model was still losing. I didn’t actually think that situation would be sustained through November, but it the end it was. From October 3rd onward, the state by state polls showed a clear Obama win.
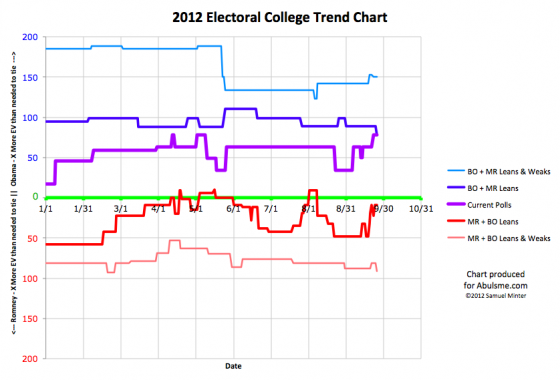
This time around, Romney has already been in that “best case is to lose” situation in my model three times. Each time he has recovered, but if Obama increases his lead in one or two key states, he could end up there again pretty easily. Unlike the last three times, there will be very little time to recover if he falls that far behind again. Of course, he would have to not just improve from that point, he would have to get to a point better than he has been at any time this year to actually pull into the lead.
At this very moment, his “current” line is well behind where McCain’s was four years ago too. Four years ago today it looked like McCain would get 256 electoral votes if the election was held then. That wasn’t enough to put him in the lead of course, but it was a lot better than the 191 Romney has in his column at the moment.
Romney needs some major game changing event to make this an interesting race again. He is running out of time for it.
He must wake up every day hoping that Obama will make some major mistake. Instead though, in the last few weeks anyway, it seems like it is Romney putting his foot in his moth over and over again. That isn’t what he needs to be able to start closing the gap, let alone to take the lead.
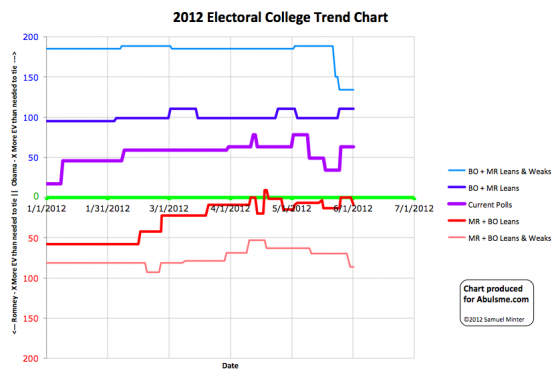
Note: With a new poll that I added to my spreadsheet today, the date that Wisconsin moved from Lean Obama to Weak Obama shifts from September 20th to September 21st. The trend chart at the top of this post reflects that adjustment.
Note: Chart and map from the Abulsme.com 2012 Electoral College Prediction page. Both assume Obama vs Romney with no strong third party candidate and show polling as it currently exists. Things will change before election day. On the map red is Romney, blue is Obama, gold states are too close to call. Lines on the chart represent how many more electoral votes a candidate would have than is needed to tie under several different scenarios. Up is good for Obama, Down is good for Romney.
