Wyoming allocated delegates in a two stage process. 12 were determined back on March 12th. At that point the count was Cruz 9, Rubio 1, Trump 1. One uncommitted delegate was elected as well. He appears to still be uncommitted.
On April 16th Wyoming completed their process, allocating their remaining 14 “normal” delegates at their state convention. All 14 delegates went to Cruz. There are three more delegate slots for party leaders. They have not yet expressed their preferences.
This once again appears to be a case of the Trump team not even bothering to “play” in Wyoming and just letting Cruz clean up essentially unopposed. This in a race where Trump needs every delegate.
In addition, since my last post there was an update in North Carolina that resulted in moving one delegate from the Trump column to the Carson column of all places. So the net change in the last week is Cruz +14, Carson +1, Trump -1.
This obviously represents less than the 57.07% of delegates Trump needed to be on pace for a win.
Time to look at some charts:
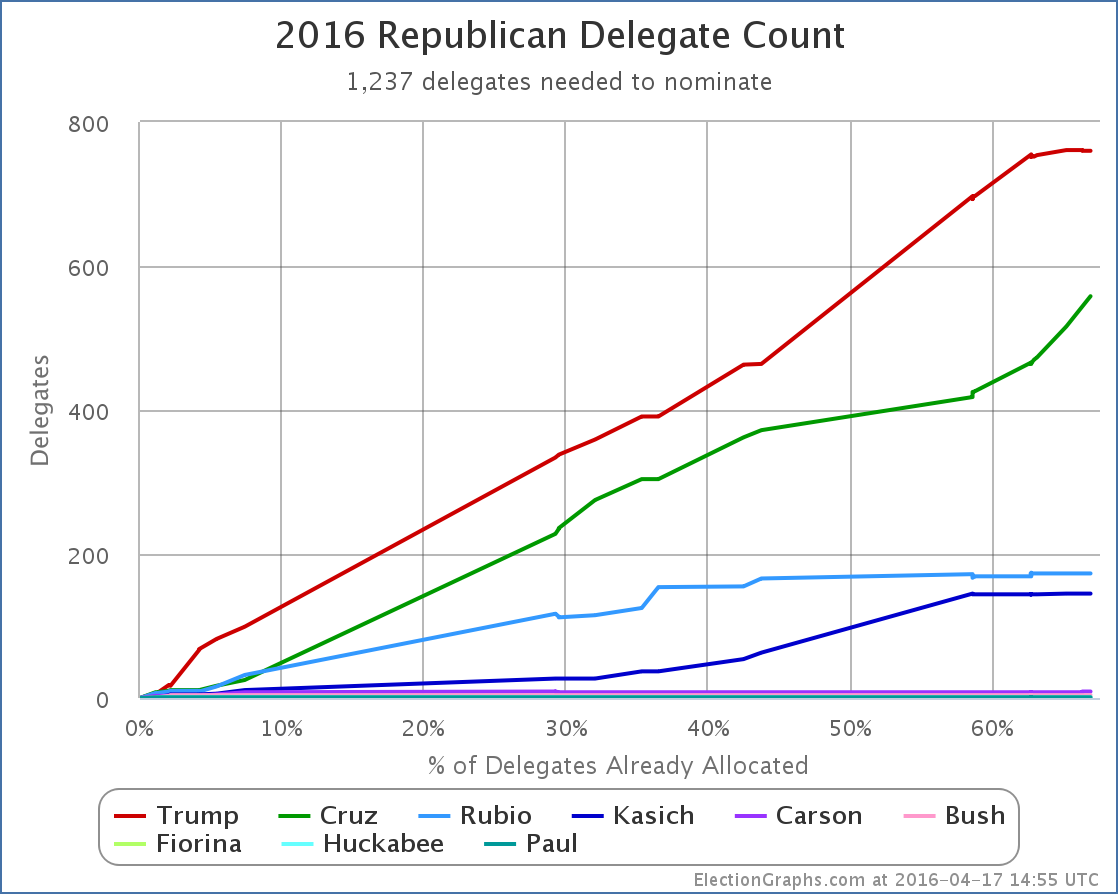
Looking at the raw delegate count, Cruz looks like he is catching up quickly. And he has been doing extremely well recently. But there is a problem. It is very late in the process.
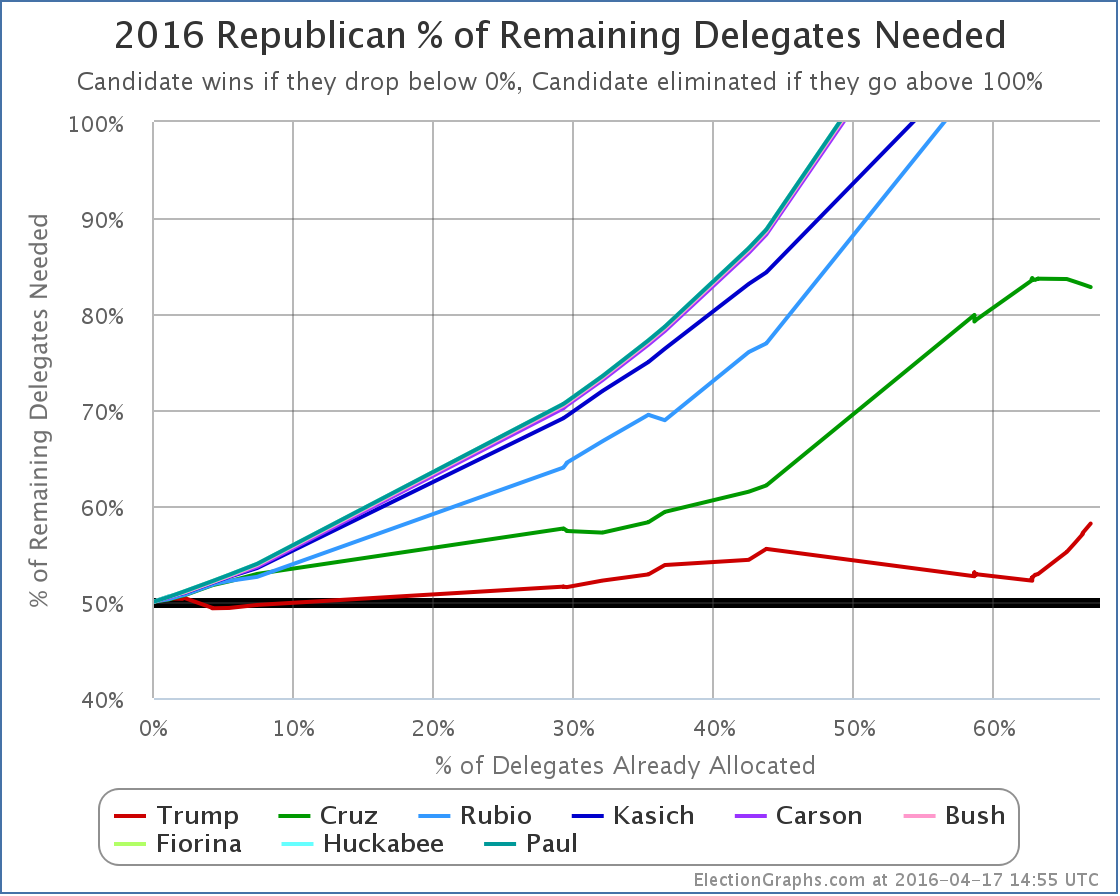
Cruz’s win streak has succeeded in lowering his % of remaining delegates needed to win, but not by a lot. It has dropped from 83.68% to 82.80%. This is still a number that Cruz can not realistically reach.
So Trump. His 57.07% increased to 58.17%.
New York is next. Trump is expected to do very well in New York. But the specific line to watch is the 58.17% line. Translated into delegates, this means to be on track to get to a delegate majority, he needs at least 56 of the 95 delegates. The expectation seems to be that he will exceed this bar, probably by a significant margin.
Even if Trump got all 95 delegates though, it still wouldn’t completely undo the damage of Cruz’s winning streak. In that case Trump would need 52.69% of the remaining delegates. Trump had been down to 52.22% before his string of losses. So shutting everybody out in New York wouldn’t quite get him back there. Close though.
After New York, there are quite a few more states where Trump is expected to do very well and some of them are winner take all. We’re still right on the edge between an outright Trump win and a contested convention. Anybody who says either of those two outcomes is certain at this point is premature.
We’ll see what happens in New York shortly, and the “narrative” of the race will almost certainly turn again. In the meantime, let me update the comparisons to 2008 and 2012 that I did back on March 13th.
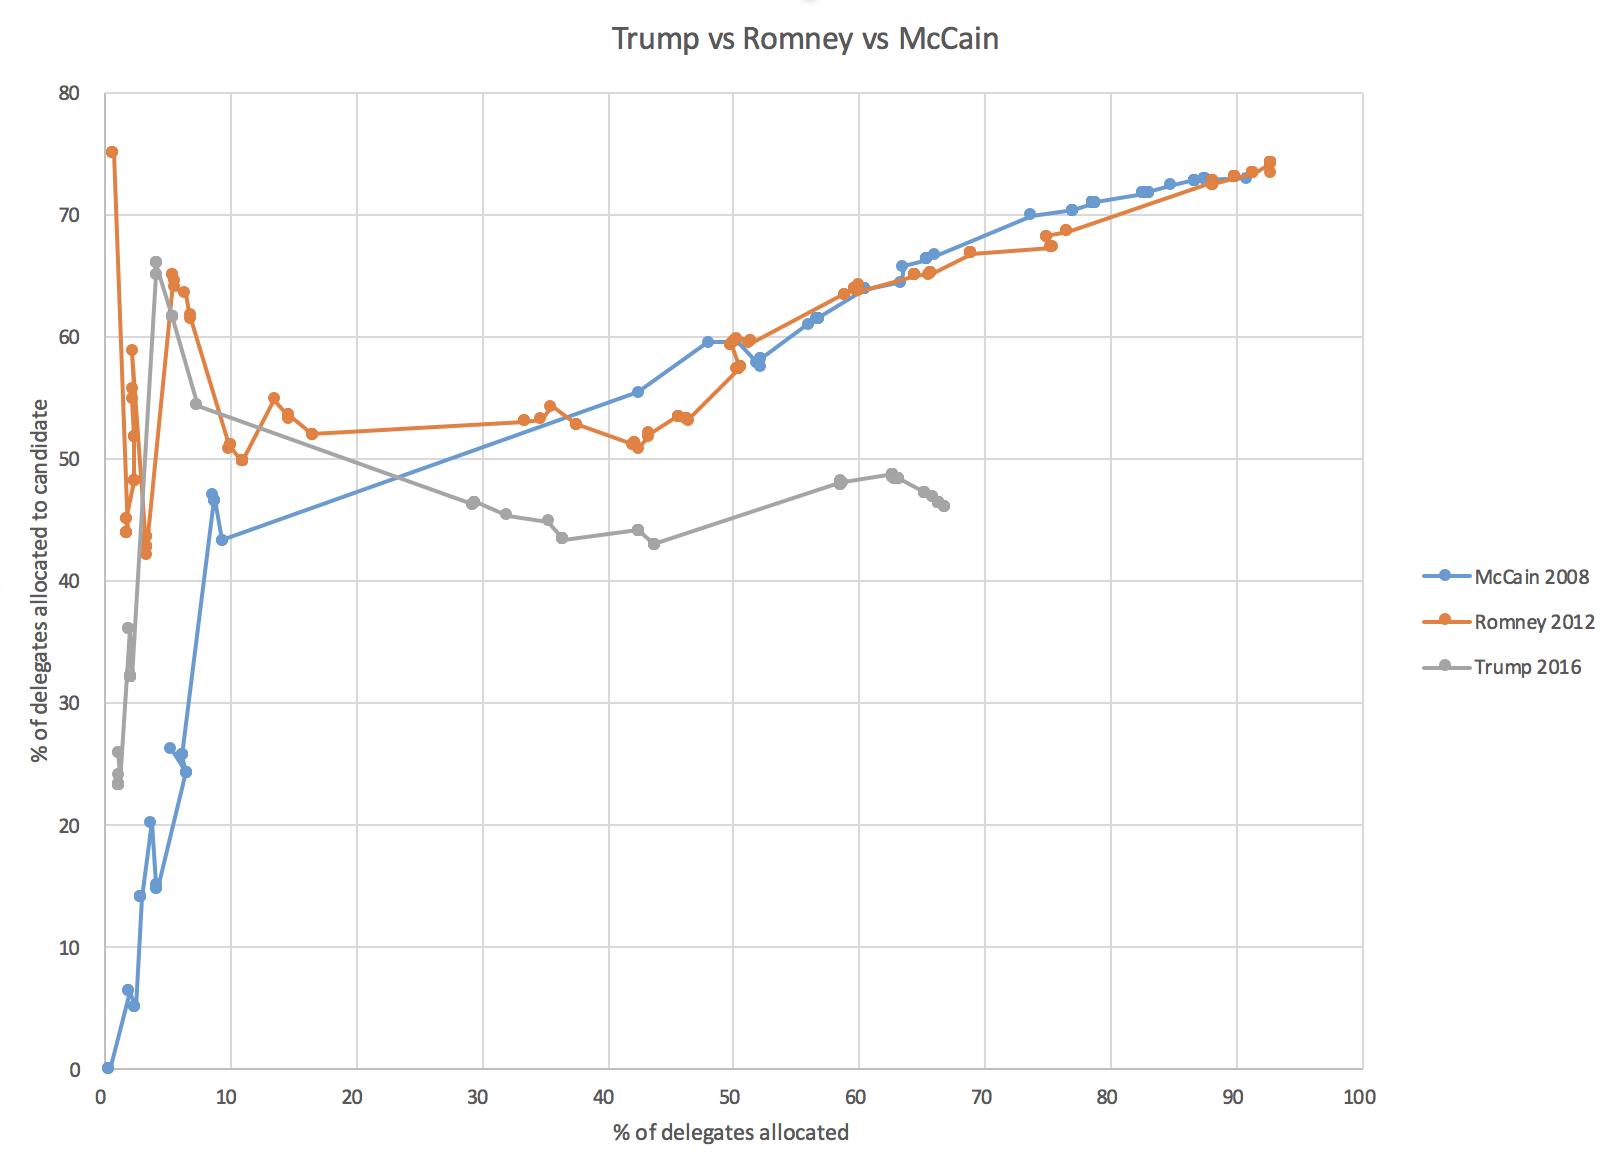
First of all just the % of delegates won:
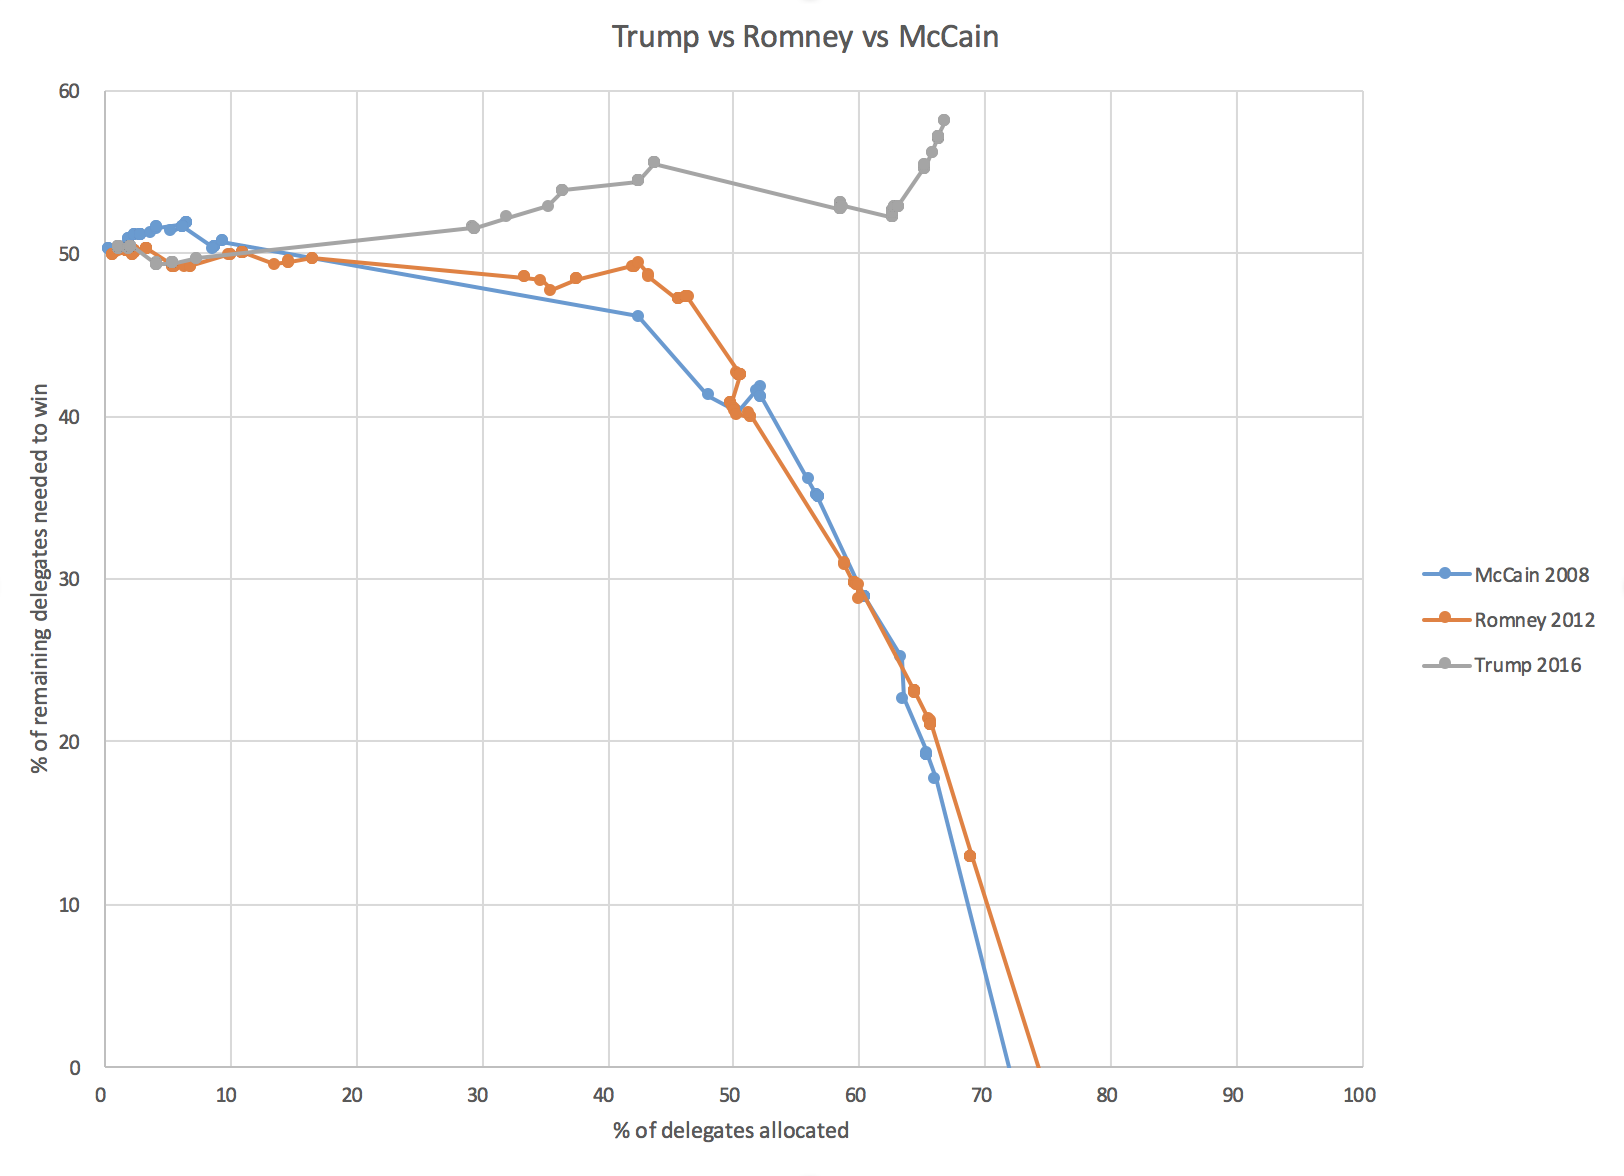
Then the more important “% of remaining delegates needed to win”:
It is still possible for Trump to win outright. Barely. But it is very very clear that his path is dramatically different than the McCain or Romney patterns. In both of those cases, by this point the frontrunners were clearly the presumptive nominees, even though they hadn’t quite wrapped it up mathematically yet.
This year Trump still has a minority of the delegates, and he hadn’t even been trending in the right direction. We’re not in the “wrapping things up” stage, instead, we clearly still have a fight going on.
Which of course makes this all much more fun to watch than 2008 or 2012 were. :-)
[Update 2016-04-20 01:27 UTC: New delegate estimate from Georgia nets Cruz +1, Trump -1. This does not change the analysis above.]
Note: This post is an update based on the data on ElectionGraphs.com. Election Graphs tracks both a poll based estimate of the Electoral College and a numbers based look at the Delegate Races. All of the charts and graphs seen in this post are from that site. Additional graphs, charts and raw data can be found there. All charts above are clickable to go to the current version of the detail page the chart is from, which may contain more up to date information than the snapshots on this page, which were current as of the time of this post. Follow @ElectionGraphs on Twitter or like Election Graphs on Facebook to see announcements of updates or to join the conversation. For those interested in individual general election poll updates, follow @ElecCollPolls on Twitter for all the polls as they are added.


