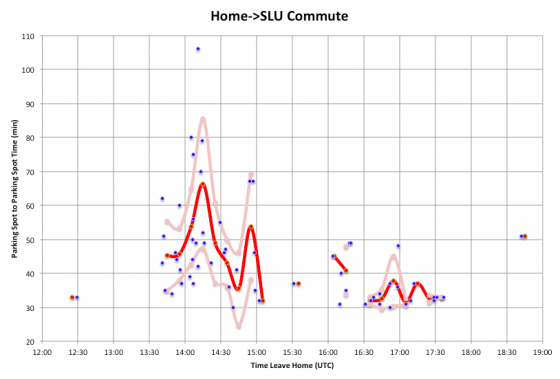
From February 20th to August 2nd, I tracked my inbound commute time from my house in Snohomish County to work in South Lake Union in Seattle.* We changed buildings last week, and the commute will be different, so time to review my results. The most critical chart is the one above, showing the parking space to parking space time, given different times I left home. As you can see, this is highly variable, from a minimum of 30 minutes a couple of times, to a maximum of 106 minutes. (That was a pretty awful commute day!)
As can be expected, the worst time to leave is during the morning rush. Duh. But specifically the 10 minute bucket from 14:10 to 14:20 UTC is the worst possible time to leave for work, with the 95% confidence interval for the trip being 47 to 85 minutes and the average trip time being 66 minutes.
So how often did I hit that worst case?

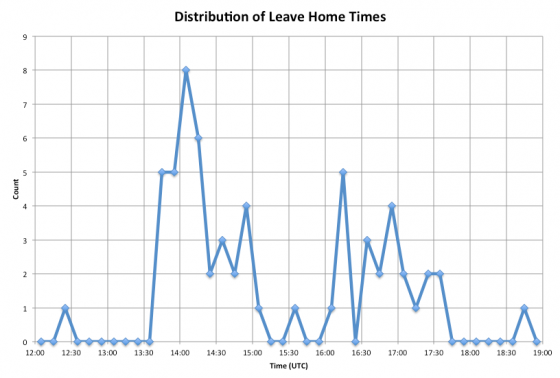
Too much. My most frequent time to leave home was between 14:00 and 14:10 UTC, where the 95% confidence interval was 43 to 65 minutes, with an average of 54 minutes. But the second most frequent bucket was indeed at the worst possible time. Ouch. Unfortunately, if I was leaving at that time of day, it most likely meant I had a meeting at 15:00 UTC, and leaving between 14:00 and 14:10 I had a 63% chance of getting to work by 15 UTC. Leaving between 14:10 and 14:20 UTC those odds dropped to 17%. By comparison, if I actually managed to leave between 13:50 and 14:00 UTC, I had a 100% chance of getting to work by 15 UTC, because the confidence interval for the trip at that time was 37 to 65 minutes with an average of 46 minutes. It just proved really difficult for me to get myself regularly up and out of bed in time to leave quite that early. I was often running 10-15 minutes late for that goal, which was enough to make the commute dramatically worse, and cause me to be a few minutes late for those 15 UTC meetings. Oops.
You can also see a bimodal distribution starting to be evident in my departure times. I’d either leave between 13:30 UTC and 15:00 UTC, or I wouldn’t leave until after 16:00 UTC. It was pretty rare for me to leave home between 15 and 16 UTC. This distribution is closely related to when my first meetings of the day happen to be. If I don’t have the early meeting, when I leave for work is significantly later, and shows a much more spread out distribution. This shows I probably could use a lot more discipline about getting up and out and to work at a consistent time on days I don’t have a meeting driving the arrival time.
Oh, and the best time to leave, at least of times I have tried enough to have data for, is between 17:00 and 17:10 UTC with a 95% confidence interval from 31 to 33 minutes, with a 32 minute average. I only have two data points at that time though, so probably not a really reliable estimate, but certainly much nicer than leaving between 14:10 and 14:20 UTC.
Anyway. Fun data to look at. We’re at a new building now, so I have to start collecting data from scratch to reflect the new commute. So far I only have 3 data points inbound and 2 data points outbound, so not enough to draw any conclusions yet. My gut feel is that on average the commute will be a bit longer, the raw distance is slightly greater and it seems like it takes longer to get to a parking spot in the new garage too, but it will take awhile to confirm that with data.
* There isn’t data for every day I went to work, because this only includes direct trips with no stops or detours. So if I needed to stop for gas, or to drop off Alex at daycare, or otherwise did anything other than a direct trip from home to work, I would not take a data point. I also tried to do the same exercise for the commute home, but as it turned out I very rarely went straight home from work with no stops, and when I did I often forgot to note the times, so I didn’t have enough data to draw a meaningful chart.
Edit 2012 Aug 11 16:52 to add the bit about the best time to leave.
Edit 2012 Aug 11 18:41 to add axis labels to the second graph.
![]() 1-Click Subscribe in iTunes
1-Click Subscribe in iTunes![]() View Podcast in iTunes
View Podcast in iTunes![]() View Raw Podcast Feed
View Raw Podcast Feed![]() Download MP3 File
Download MP3 File![]() Follow the podcast on Facebook
Follow the podcast on Facebook

