This is the website of Abulsme Noibatno Itramne (also known as Sam Minter).
Posts here are rare these days. For current stuff, follow me on Mastodon
|
New polls since last update: Texas (x2), Arizona, Iowa, New Hampshire, Ohio, Pennsylvania, Wisconsin.
Well, that didn’t last long. Less than a week ago the polling average in Arizona moved to the blue side of the center line. With today’s update, Arizona is once again tinted the more familiar red color.
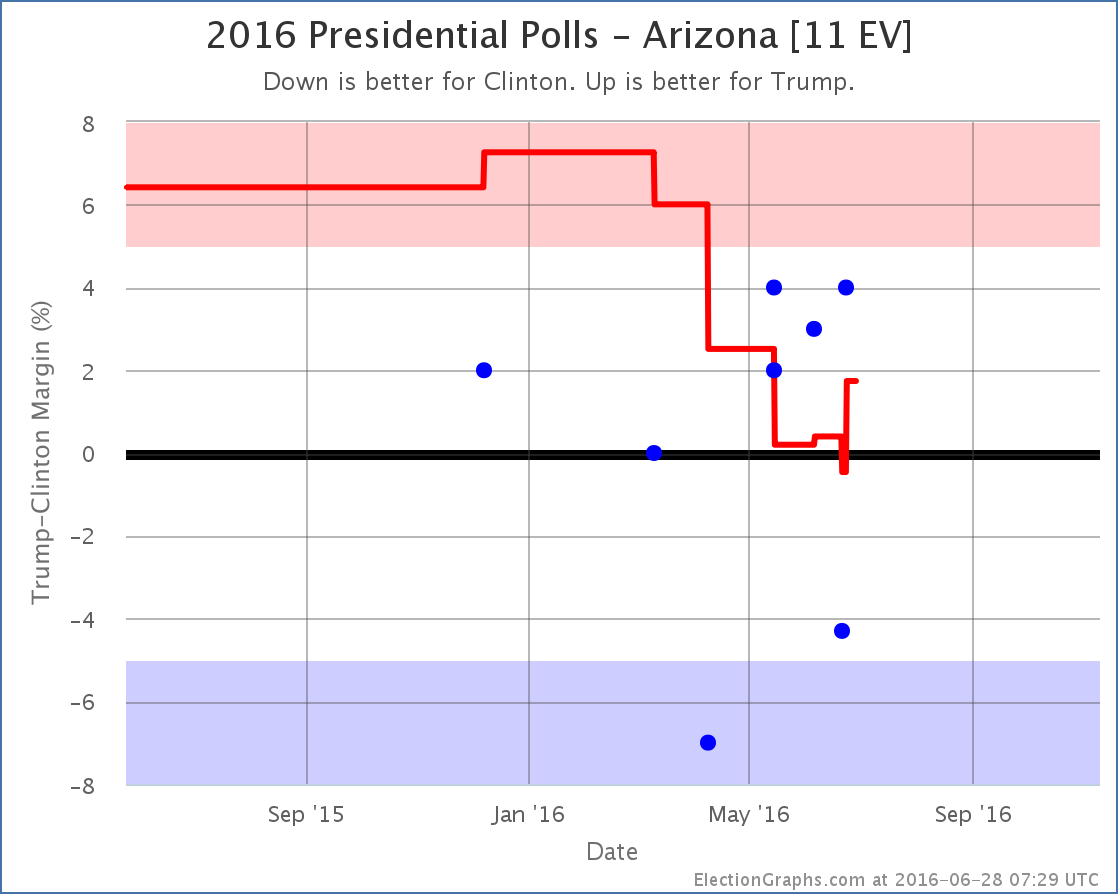
One of the two polls showing Clinton leading in Arizona falls off the average, and so it rises to a 1.7% Trump lead. Arizona is still looking close, which is itself remarkable given the electoral history there, but once again it is on the Trump side of the line.
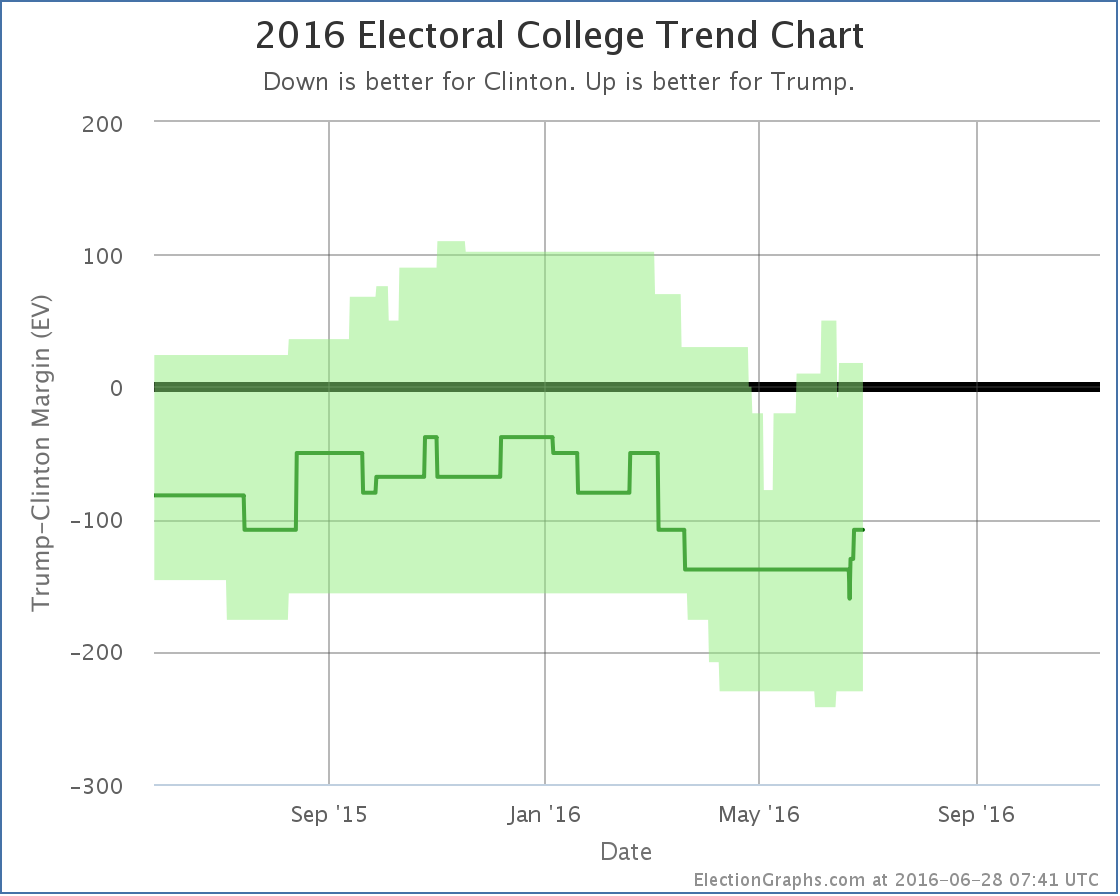
The “expected case” where each candidate wins all the states where they lead in the poll average, no more, no less, now sits at Clinton 323, Trump 215. This is a 108 electoral vote win for Clinton. We are back where we were in mid-March.
With this scenario, Trump is still losing, but not by as much as either Romney (126 EV loss) or McCain (192 EV loss).
So to repeat a theme I have touched on a number of times before, yes, Trump is behind here. Clinton is winning. But we are NOT seeing a historically bad Republican candidate. Trump is actually doing better than his immediate predecessors at the moment.
And compared to both two months ago and one month ago, he is still up or flat on all four metrics tracked here at Election Graphs, not in the midst of and epic collapse. Or, at least, there isn’t one in evidence yet at the state level. If anything, it looks like he is still in the process of recovering from the collapse in support he did indeed see during the months the primaries were in full swing.
133.2 days until the polls start to close.
Note: This post is an update based on the data on ElectionGraphs.com. Election Graphs tracks both a poll based estimate of the Electoral College and a numbers based look at the Delegate Races. All of the charts and graphs seen in this post are from that site. Additional graphs, charts and raw data can be found there. Follow @ElectionGraphs on Twitter or like Election Graphs on Facebook to see announcements of updates or to join the conversation. For those interested in individual general election poll updates, follow @ElecCollPolls on Twitter for all the polls as they are added. If you find the information in these posts interesting or useful, please consider visiting the tip jar.
Since the last update, which was only a day ago, new poll data was added for Florida, Colorado, Wisconsin, North Carolina, Maine (at large and each congressional district), and Arkansas. The Colorado poll was much needed as it has been under polled. Arkansas and Maine as well. But only the Florida poll made a difference. Specifically, the polls in question actually covered a timeframe from earlier in the month, so the last couple weeks of the charts are modified.
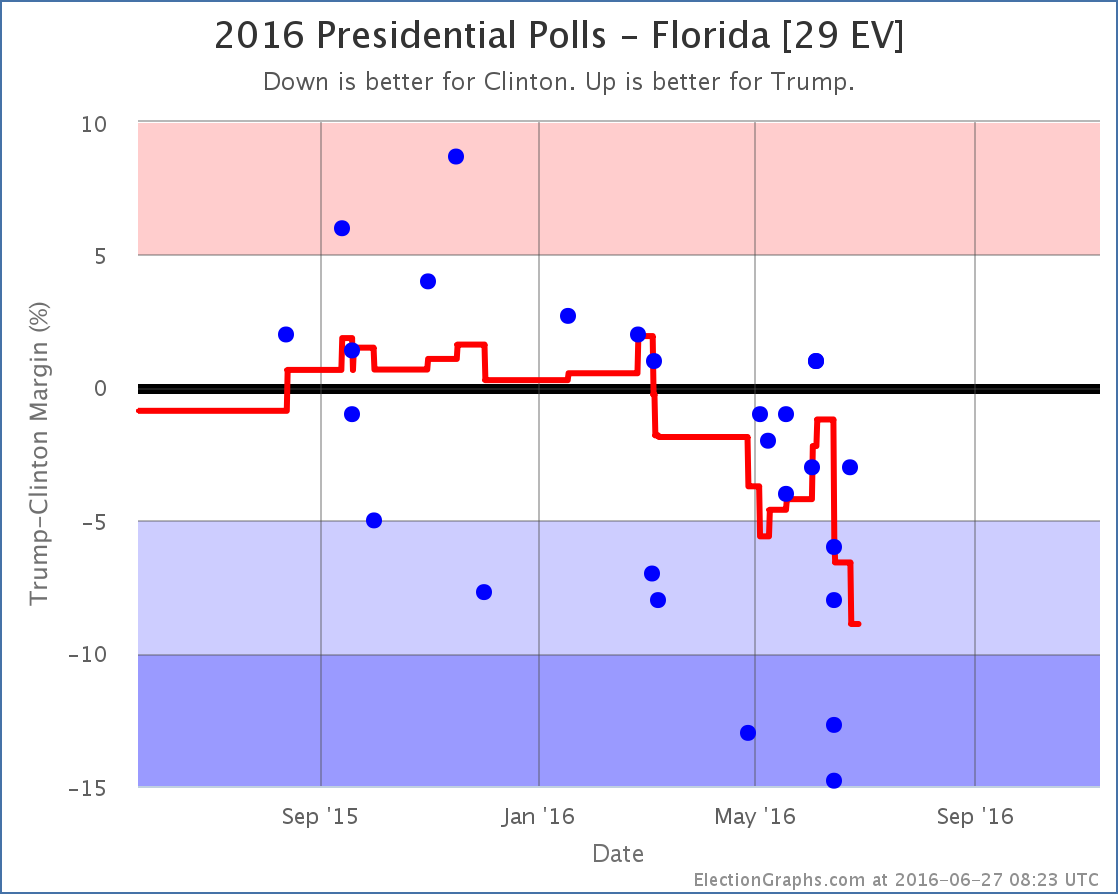
The poll average in Florida now only covers two weeks of polling. We are definitely in the general election season.
The last two weeks of polls have not been kind to Trump in Florida. With this update earlier polls showing Florida close fall off the calculation and so the average drops rapidly. The two worst results for Trump in the current average were the ones added in this update. They are from Saint Leo University (one including Johnson as an option and one without). These are the 1st and 3rd worst numbers Trump has ever had in Florida. They may prove to be outliers. We’ll see what the next polls bring.
For the moment though, Clinton’s lead in Florida grows to 8.9%. This is a rapid drop and takes Florida from “Weak Clinton” to “Strong Clinton”. So we take Florida out of the list of potential Trump states in his best case.
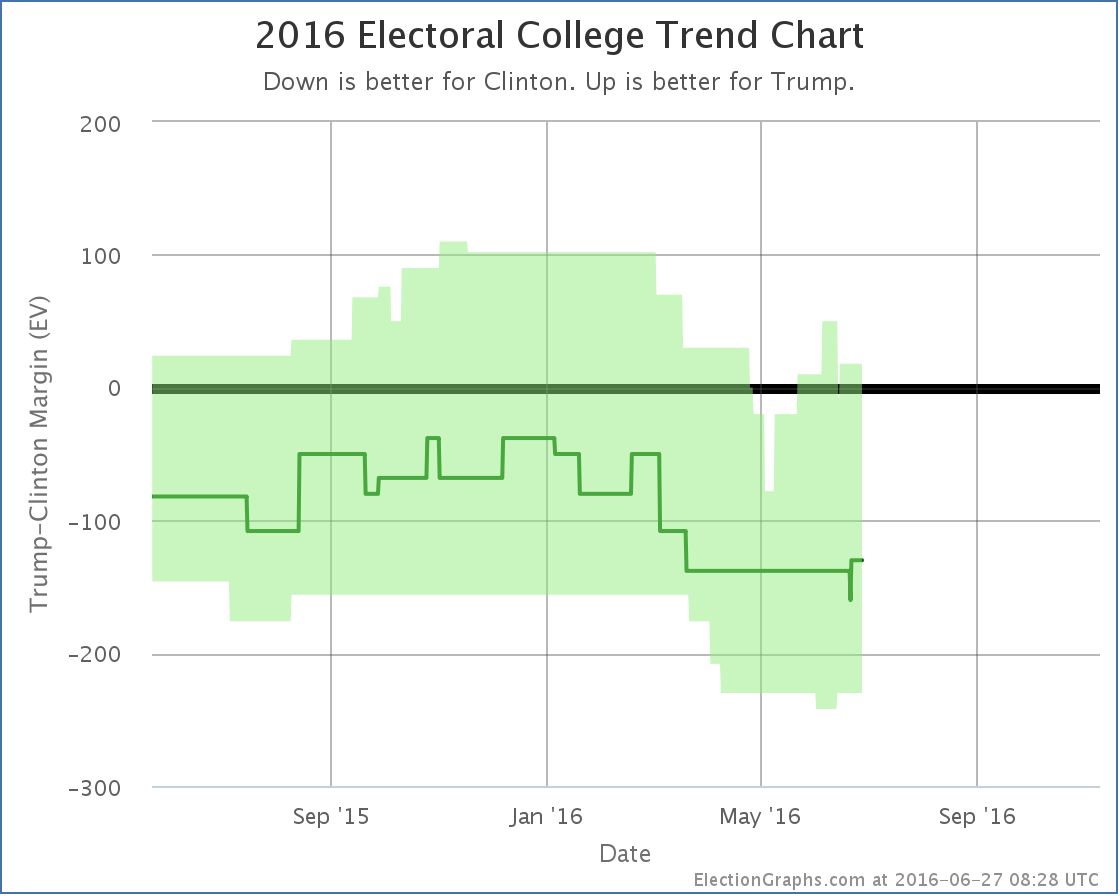
As mentioned, the timeframes covered by the Florida polls that were just added and which caused the change are older… June 10-16.. so the drop in the best case from Florida actually gets inserted before the bump up caused by Trump getting closer in Virginia. So the chart now actually shows a huge drop due to Florida, then a day later the bump up caused by Virginia.
With this update Trump’s best case dropped from a 76 electoral vote win to a 18 electoral vote win, but that 78 vote win is actually wiped off the chart entirely since the Florida change actually happened before the Virginia one.
Since Florida was the tipping point state, the tipping point also moves:
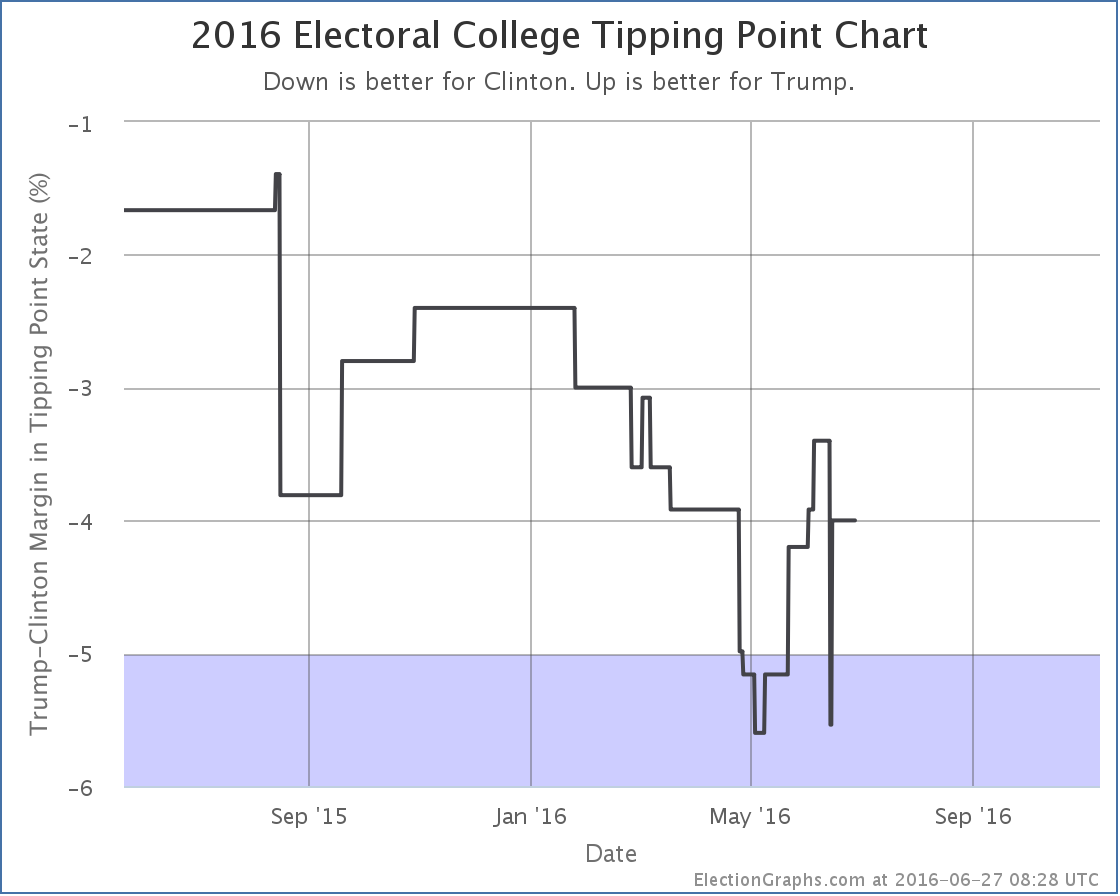
As with Trump’s best case, the tipping point now shows a big drop from Florida, then a gain a day later when Virginia moved in the opposite direction. In the end this update causes the tipping point to move from Clinton by 3.0% in Florida to Clinton by 4.0% in Ohio. And once again that previous peak is just wiped off the chart because the Florida change happened before Virginia.
Just yesterday I noted that when looking over a two month time horizon 3 out of the 4 metrics Election Graphs tracks have moved in Trump’s direction, and the fourth was flat. This is still true today, and it is even true if you only look at a one month time horizon, but without Florida those gains are lessened significantly.
With today’s updates however, you can now start to see some movement away from Trump in the last two to three weeks. We will not know for a while yet though if this is the start of a larger trend toward Clinton, or if Trump will bounce back.
Without Florida in play, to win Trump has to almost sweep the states where Clinton leads by less than 5%… Arizona, Pennsylvania, Iowa, Virginia, Nevada and Ohio… he can afford to lose one of the small 6 EV states (Iowa and Nevada)… as well as holding all the states where he has only a narrow lead. That is a tall order given current polling.
134.3 days until polls start to close on Election 2016.
Note: This post is an update based on the data on ElectionGraphs.com. Election Graphs tracks both a poll based estimate of the Electoral College and a numbers based look at the Delegate Races. All of the charts and graphs seen in this post are from that site. Additional graphs, charts and raw data can be found there. Follow @ElectionGraphs on Twitter or like Election Graphs on Facebook to see announcements of updates or to join the conversation. For those interested in individual general election poll updates, follow @ElecCollPolls on Twitter for all the polls as they are added. If you find the information in these posts interesting or useful, please consider visiting the tip jar.
Edit 17:40 UTC to add “Without Florida in play…” paragraph near the end.
Edit 18:55 UTC to acknowledge that Trump could actually afford to lose one of the 6 EV states.
Since the last update there have only been polls in North Carolina and Texas, but North Carolina makes a difference:
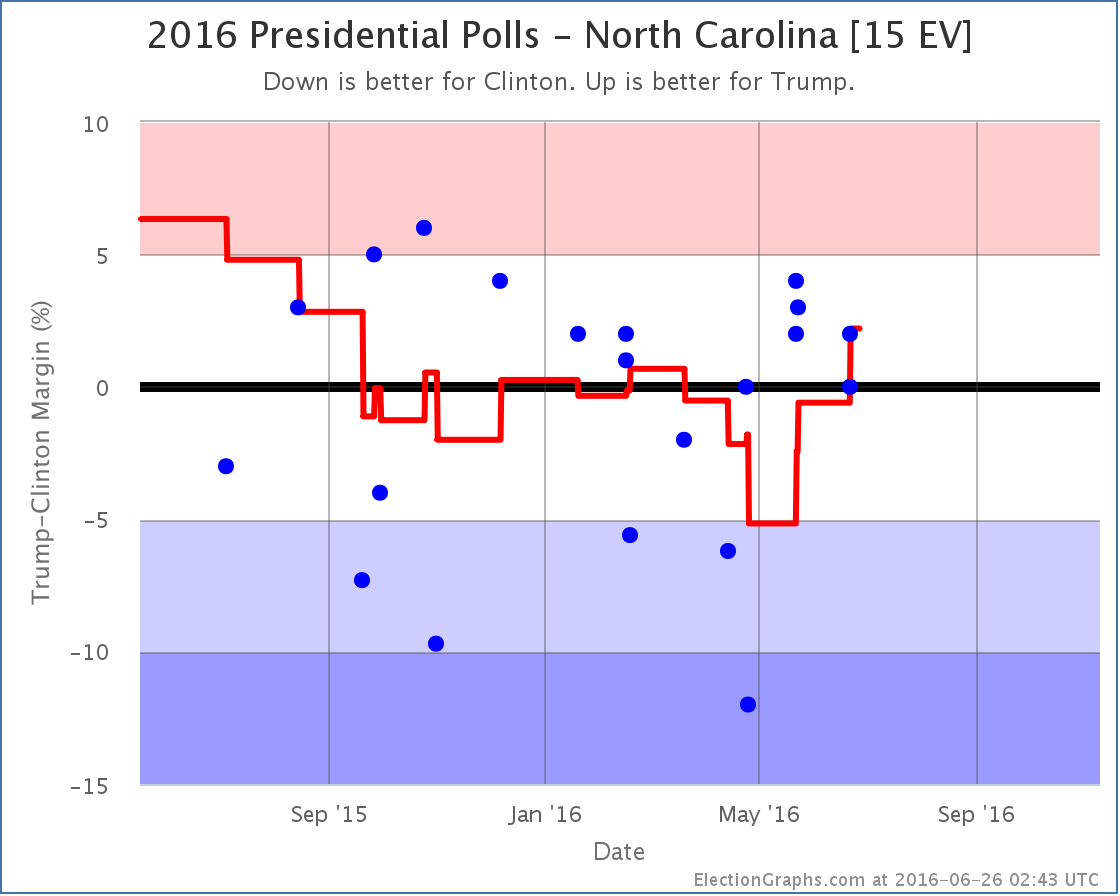
A particularly good poll for Clinton from April rolls off the average and now all the recent polls have Trump ahead or tied in North Carolina. The average is now a 2.2% Trump lead. North Carolina has been back and forth between Clinton and Trump several times over the last year, but Trump’s position at the moment is now better than it has been since last September.
Only a month ago, Clinton was at her best position in the last year. Is this an actual dramatic swing toward Trump in North Carolina? Maybe. It is also possible that there is just highly volatile polling, and Clinton had a good run, and now Trump is having a good run. The bottom line is that North Carolina has spent all but a handful of weeks in the last year with neither candidate having a lead of more than 5%. In other words, it is a close state that could go either way.
But for now, Trump is once again in the lead, so North Carolina goes into his column for the expected results:
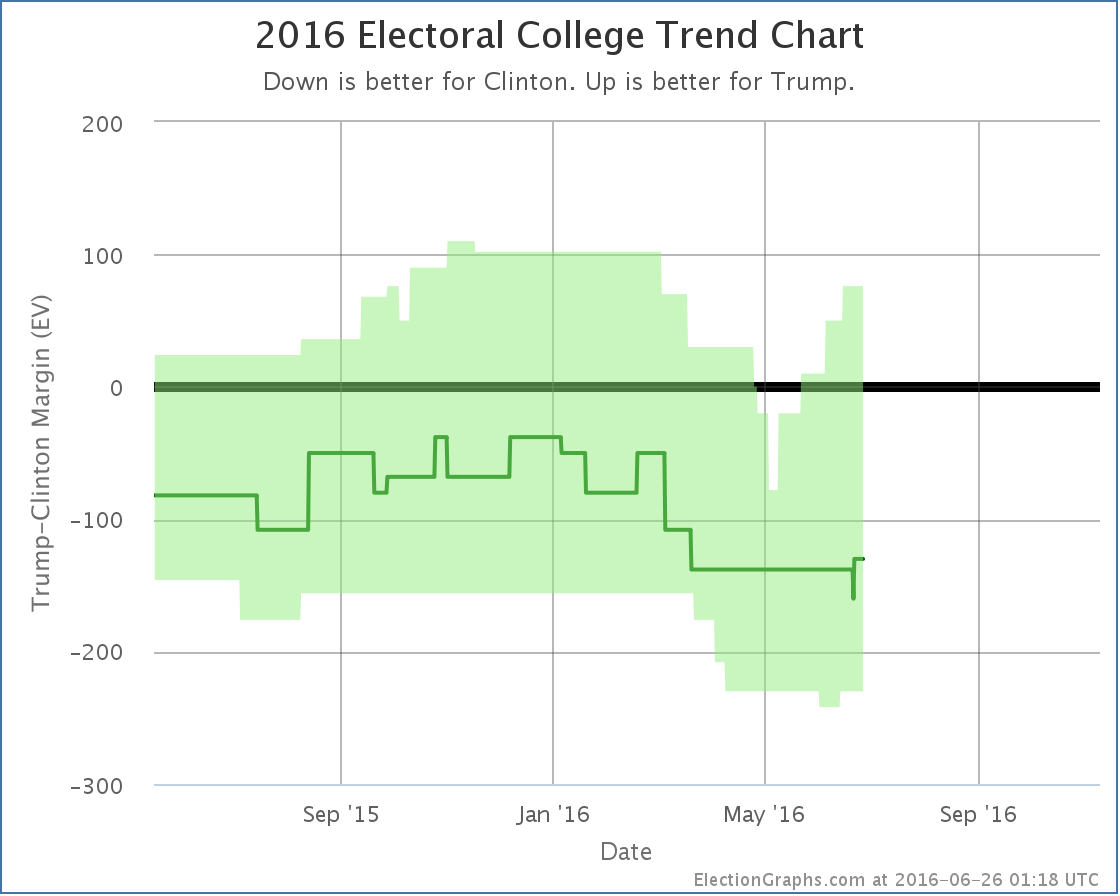
Since North Carolina has more electoral votes than Arizona, this more than reverses the movement of the expected result from a few days ago when Arizona flipped (just barely) to the blue side.
Looking back and comparing now with exactly two months ago, we see that Trump’s best case has improved from a Clinton 20 EV win to a Trump 76 EV win. The “expected” case has improved from a 138 EV loss to a 130 EV loss. Clinton’s best case has stayed the same. The tipping point has also moved from Clinton by 5.2% to Clinton by 3.0%.
So in 3 out of 4 measures, Trump has improved. In the other there has been no change.
In the Pollster national poll average over the same time period Trump has gone from being behind by 7.4% to being behind by 6.6%. Wait… what was that last one?
Hasn’t everybody been talking about how Trump has been collapsing in the national polls? But he has actually gained ground in the past two months! What is going on here?
Here is the national chart from Pollster:
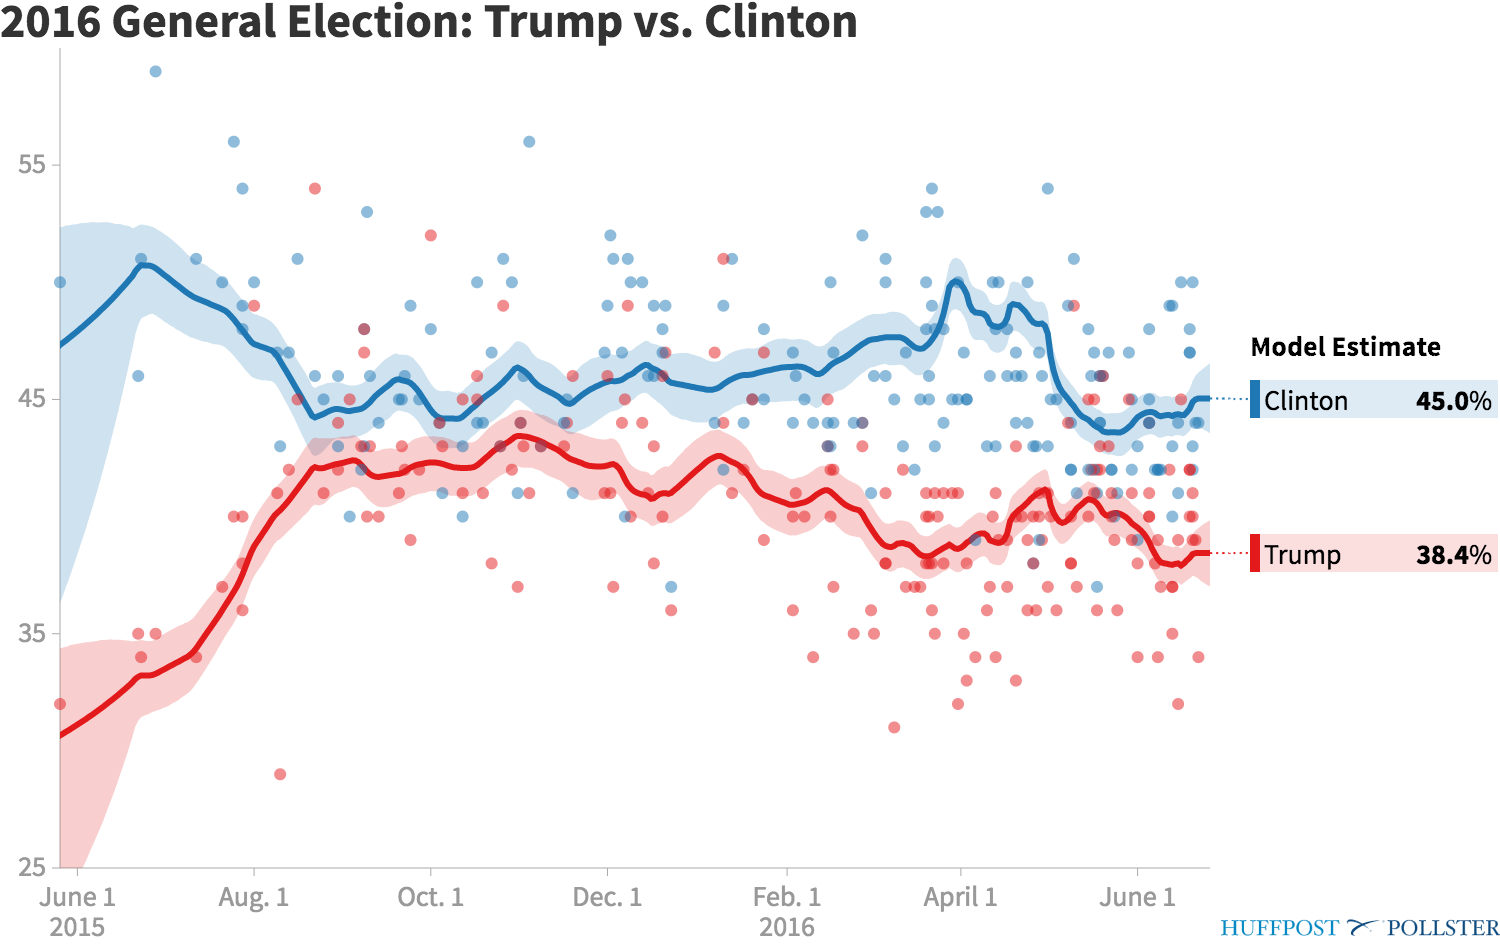
How much and in what direction the gap has changed of course all depends on what timeframes you are comparing.
Trump had narrowed the national gap with Clinton to only about 3.2% in mid May. (The RCP average actually had him very slightly ahead at the peak.) Since then, he has fallen back.
But he is still better off than he was in late April. And he has improved even more dramatically if you compare to late March. So the longer term national trend is the gap between Trump and Clinton narrowing, despite the opposite movement in the last month.
With the high resolution polling on the national picture, you could see the “Trump Bump” when after securing the nomination Trump closed the gap and then fell back again. With the slower state by state picture, that essentially may have happened too quickly for it to be visible.
Overall Clinton is clearly in a dominant position over Trump.
But Trump has indeed been catching up in a number of states. He hadn’t actually pulled a state over to his side since February though. Just as it is now, it was also North Carolina back then… and that time it only lasted a month or so before the state went blue again.
We will see soon enough if North Carolina stays red longer this time, and if Trump can pull more “Weak Clinton” states to his side. Pulling back Arizona would be the obvious first target, followed by Pennsylvania, Iowa and Florida. With those four states, Trump would take an overall lead for the first time.
That is all it would take. Four states. Of these Trump is furthest behind in Florida, but he is only behind by 3.0% there. With all the talk of how dire Trump’s situation is, he really isn’t that far back.
If Trump has a few good weeks and Clinton has a few bad weeks, that can change quickly.
Keep watching. 135.8 days until the polls start closing on election day.
Note: This post is an update based on the data on ElectionGraphs.com. Election Graphs tracks both a poll based estimate of the Electoral College and a numbers based look at the Delegate Races. All of the charts and graphs seen in this post are from that site. Additional graphs, charts and raw data can be found there. Follow @ElectionGraphs on Twitter or like Election Graphs on Facebook to see announcements of updates or to join the conversation. For those interested in individual general election poll updates, follow @ElecCollPolls on Twitter for all the polls as they are added. If you find the information in these posts interesting or useful, please consider visiting the tip jar.
Since the last update there have been new polls in Arizona, Washington, Illinois, Iowa, Florida, Ohio, Pennsylvania, and Utah. The latest ones in Pennsylvania, Arizona and Utah made differences to the Electoral Graphs model. Two of these moves favored Trump, but one favored Clinton.
We’ll cover them in order of how many electoral votes each state has.
Pennsylvania (20 EV)
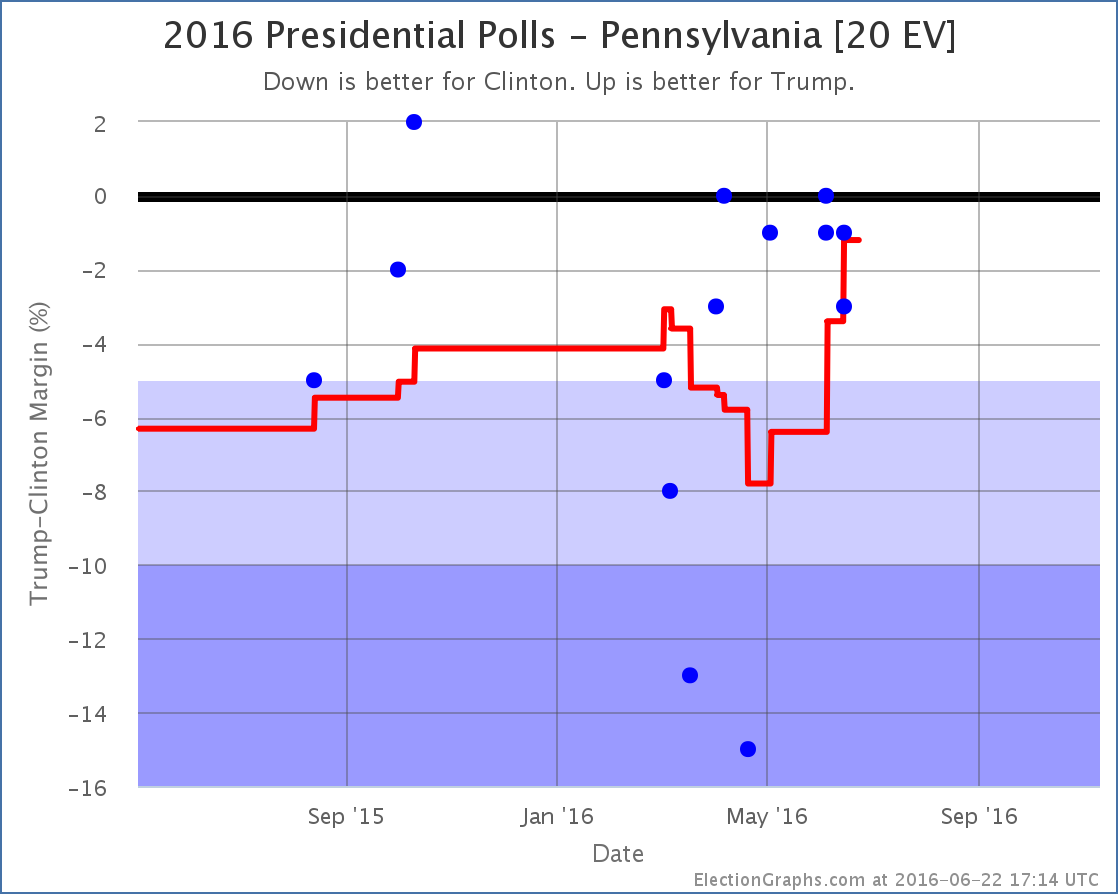
The polling average moves from Clinton by 3.4% to Clinton by 1.2% as a really good poll for Clinton (15% lead) from April rolls off the average, replaced by polls showing a close race. The state doesn’t change categories, it is still a “Weak Clinton” state, but this continues the Trumpward movement in Pennsylvania, and since Pennsylvania was the tipping point state, it moves the tipping point in Trump’s direction:
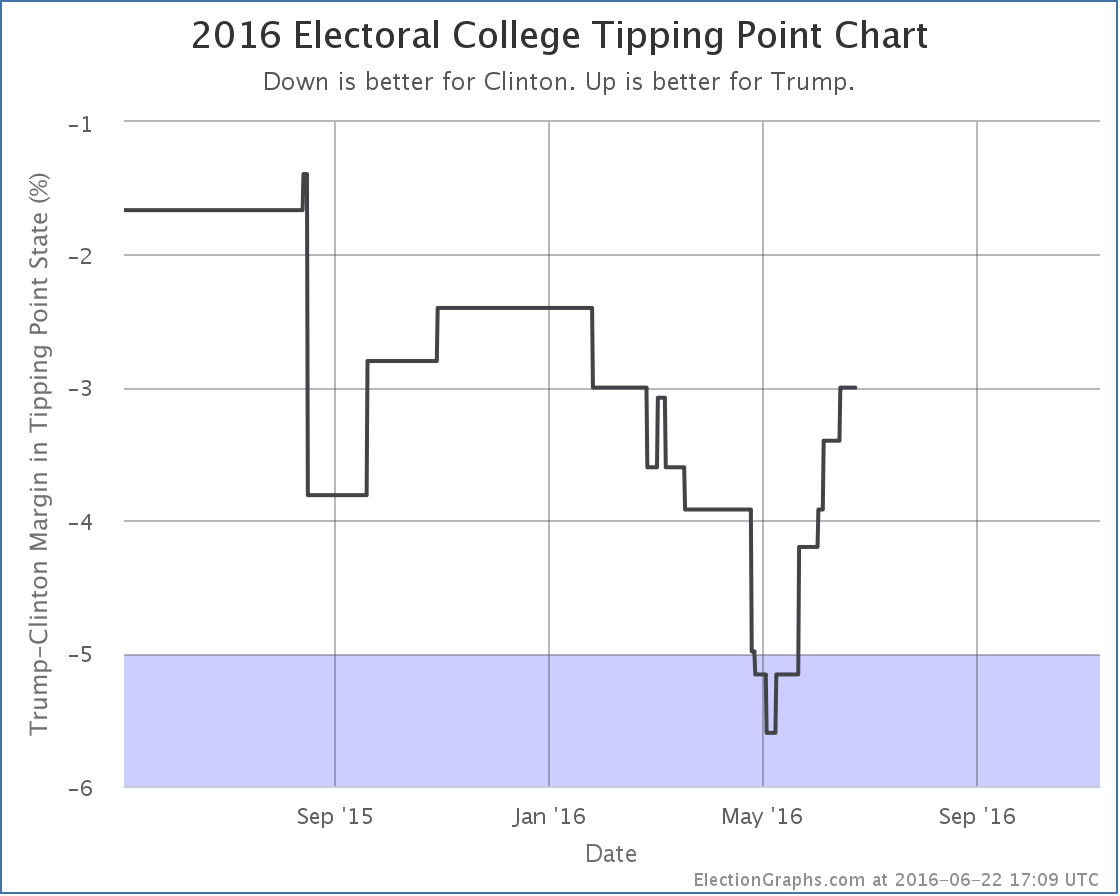
On the tipping point metric, Trump has been improving consistently since the beginning of May. This despite the continued downward trend in the national numbers. As I discussed last time, this has happened in enough states at this point that it seems like it may be a real thing. Trump is getting closer in some states, while simultaneously falling further behind nationally.
Arizona (11 EV)
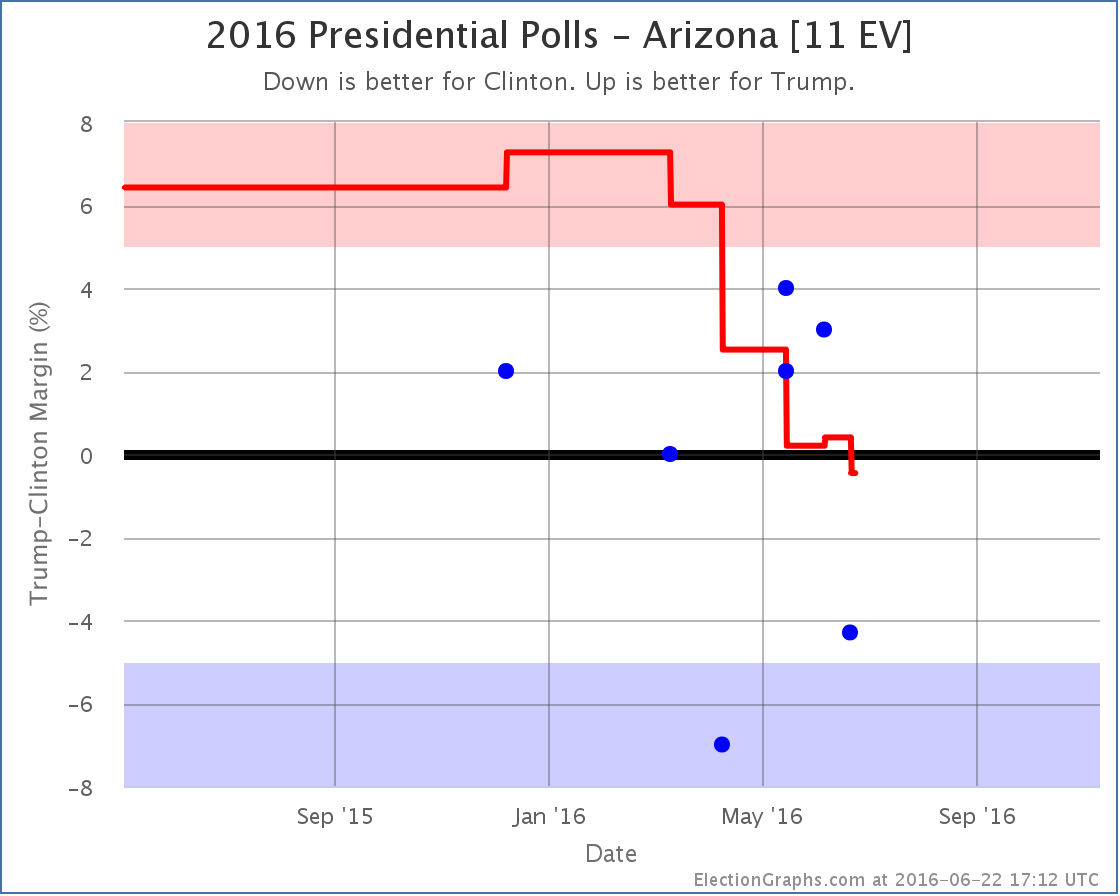
While the tipping point was moving toward Trump, Arizona has been moving toward Clinton. With the latest updates, Arizona moves from an 0.4% Trump lead to a 0.5% Clinton lead. Either way, Arizona is currently looking like a state that could go either way. But for the first time this cycle, Arizona is now on the blue side of the line. Arizona hasn’t gone Democratic in a presidential election since 1996. That isn’t as long as a state like Utah, but it is still quite some time, and it is remarkable that the poll average is showing Democrats with a lead, no matter how small.
Utah (6 EV)
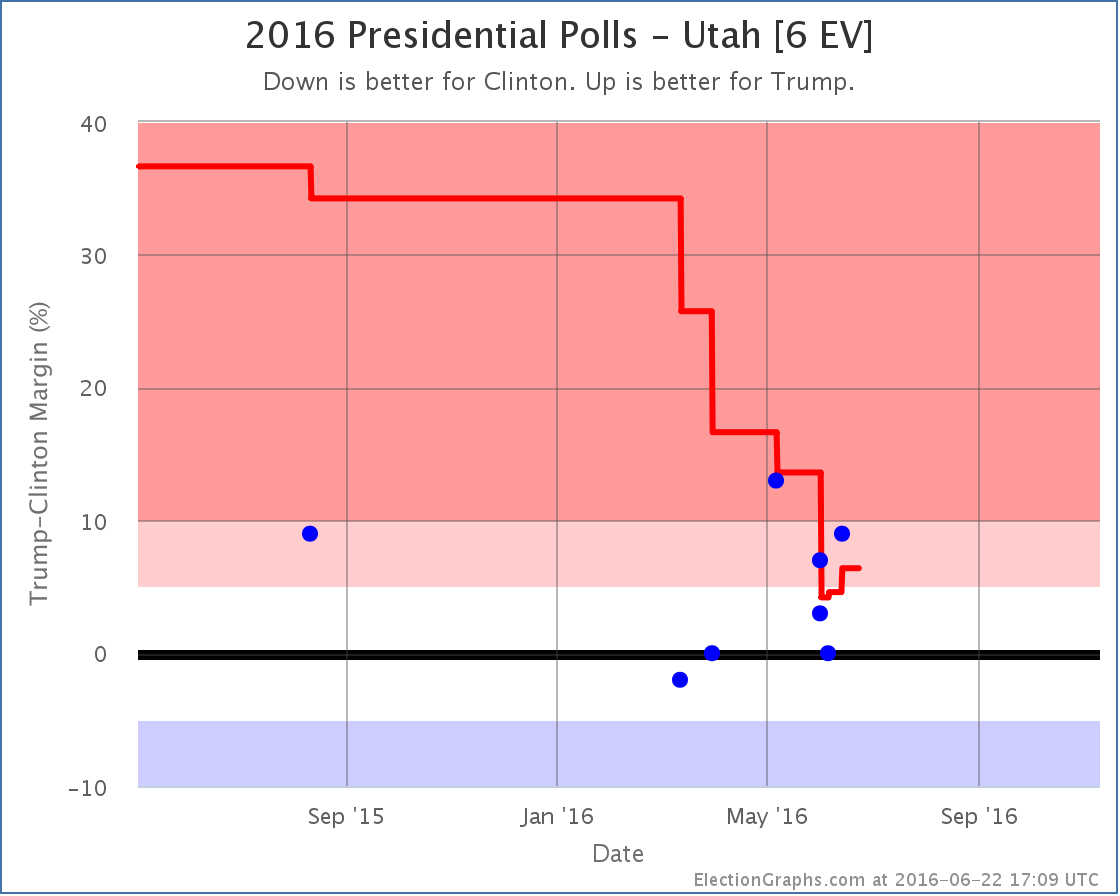
Meanwhile, as Arizona dips into the blue, Utah, which had briefly dropped into the competitive zone, once again looks a little stronger for Trump, and thus moves out of the category that could go either way. Having said that, we’re still looking at the smallest Republican margin in Utah in many decades. Just not quite as narrow as it looked.
National Summary
With Arizona flipping to the blue, improving the expected case for Clinton, and Utah pulling back out of the competitive zone, reducing Clinton’s best case, the national map now looks like this:
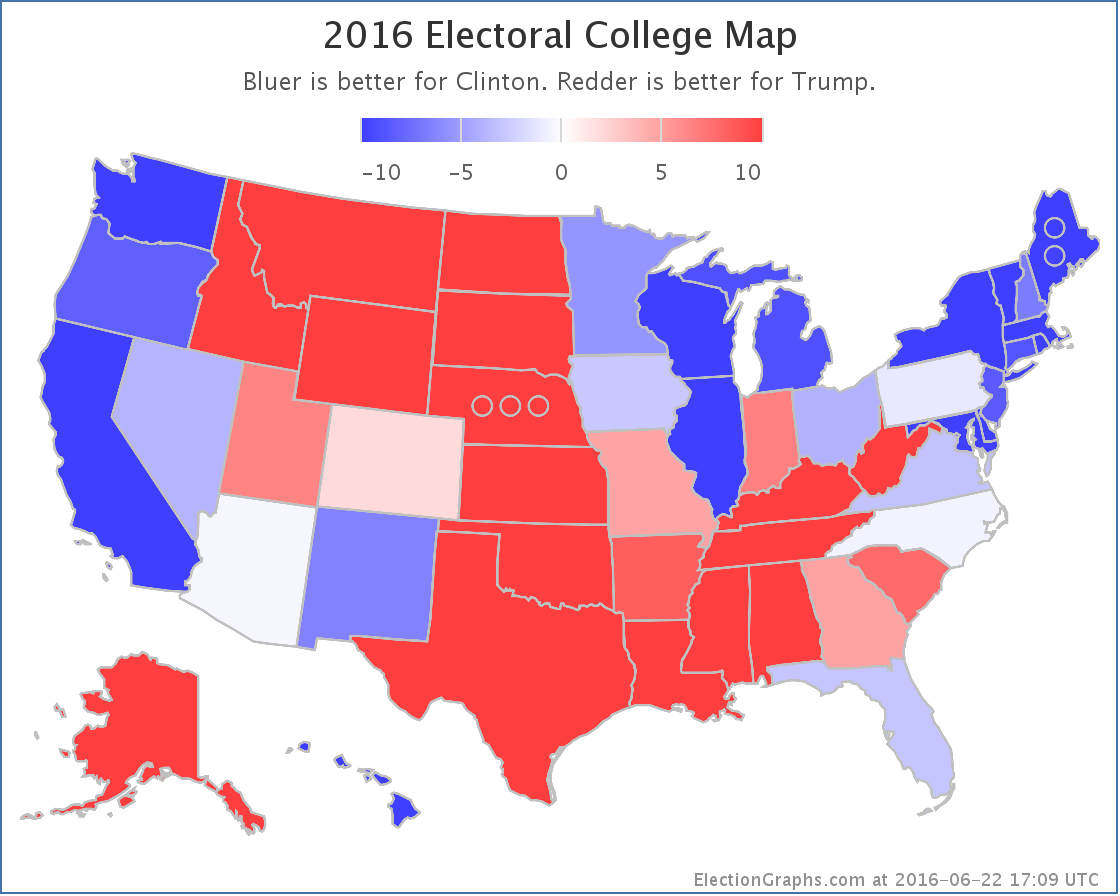
The center of the spectrum of the states (excluding the solid states where one candidate leads by more than 10%) looks like this:
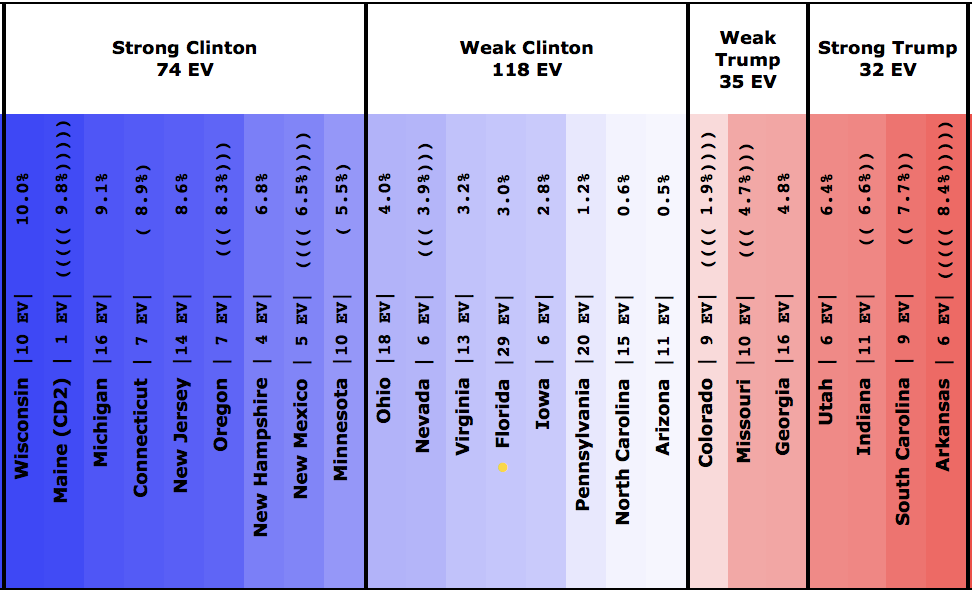
And the trend bubble…
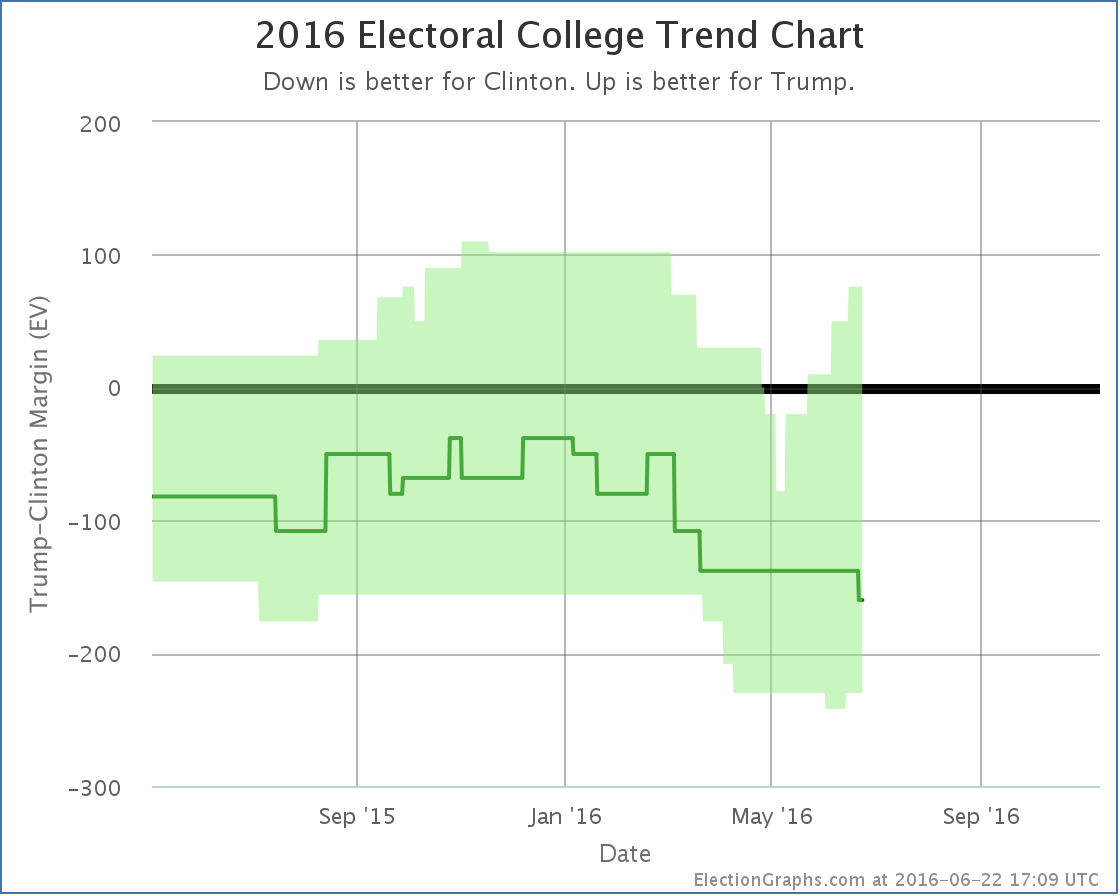
It is hard to call a trend on this.
Look at the center line (the expected case) and every move since February has been toward Clinton.
Look at the top of the bubble (Trump’s best case) or the tipping point (see chart earlier in this post) and every move since early May has been toward Trump.
Look at the bottom of the bubble (Clinton’s best case) and things were moving toward Clinton until June, then started moving back toward Trump.
And of course the national polls have been moving toward Clinton for awhile now.
So what is really the trend? Well, all of them. They measure different things. Clinton’s absolute electoral college and popular vote leads are growing. But Trump is making more states close, which means his best case is improving, and the tipping point is getting closer. While meanwhile, for the moment anyway, Clinton’s best case may have hit a ceiling and be bouncing off it.
It is more complex than just looking at which direction a single number is going.
But in the end, if you have to look at only one number, it is probably the “expected” line. To win, Trump has to make that line move upward. It hasn’t been going that way for months, and it has never shown a Trump win.
Trump has 138.7 days to change that.
Note: This post is an update based on the data on ElectionGraphs.com. Election Graphs tracks both a poll based estimate of the Electoral College and a numbers based look at the Delegate Races. All of the charts and graphs seen in this post are from that site. Additional graphs, charts and raw data can be found there. Follow @ElectionGraphs on Twitter or like Election Graphs on Facebook to see announcements of updates or to join the conversation. For those interested in individual general election poll updates, follow @ElecCollPolls on Twitter for all the polls as they are added. If you find the information in these posts interesting or useful, please consider visiting the tip jar.
Sam and Ivan are together again for this week’s Curmudgeon’s Corner podcast. Topic #1 is of course the mass shooting in Orlando. Then we return as always to the latest developments in Election 2016. Rounding it out we have some thoughts on WWDC, the Disney Alligator incident, the new Napster, and more. Oh, and Sam’s 6 year old son Alex pops in several times to give his thoughts on the events of the day as well.
Click below to listen or subscribe… then let us know your own thoughts!

Recorded 2016-06-16
Length this week – 1:51:17
 1-Click Subscribe in iTunes 1-Click Subscribe in iTunes
 View Podcast in iTunes View Podcast in iTunes
 View Raw Podcast Feed View Raw Podcast Feed
 Download MP3 File Download MP3 File
 Follow the podcast on Facebook Follow the podcast on Facebook
Show Details:
- (0:00:10-0:10:33) But First
- Ivan’s Bad Weeks
- Agenda
- Preview of Next Week
- New Napster
- Feedback
- (0:11:49-0:51:04) Orlando
- Alex thoughts on Orlando and Stamps
- What Happened
- Puerto Rican connection
- Motivations
- Warning signs
- The gun debate
- (0:51:54-1:23:05) Election 2016
- Primaries Over
- Trump national poll collapse
- Trump on the Prompter
- Trump support demographics
- Dump Trump
- Wikileaks on Clinton
- (1:24:16-1:50:57) Hodgepodge
- Alex has more thoughts
- WWDC
- DNC Hack
- Trump Drop Out?
- Disney Alligator
Since the last notable change, Jill Stein became the presumptive nominee of the Green party. So I folded in 4-way poll results that included her in AZ/NC/OH/NJ/GA/PA/FL/CT. I also added new polls in VA/WI/CA. Of all of these updates, changes only resulted from the additions in Virginia and Pennsylvania.
Interestingly, although Trump has been plummeting in the national polls the last few weeks (see Pollster and RCP), 4 out of the 5 state level category changes and 4 out of 4 tipping point changes here at Election Graphs since Trump became the presumptive Republican nominee have been in Trump’s favor.
I have been attributing this to the natural lag in the kind of state poll averages tracked here… but the trend has gone on long enough that there may be something else happening. It is actually starting to look like Clinton’s lead has been narrowing in a number of states, even while Trump has been falling further behind at a national level. This is an odd pattern. It will be interesting to see if it continues.
In the mean time, lets look at the latest example:
Virginia
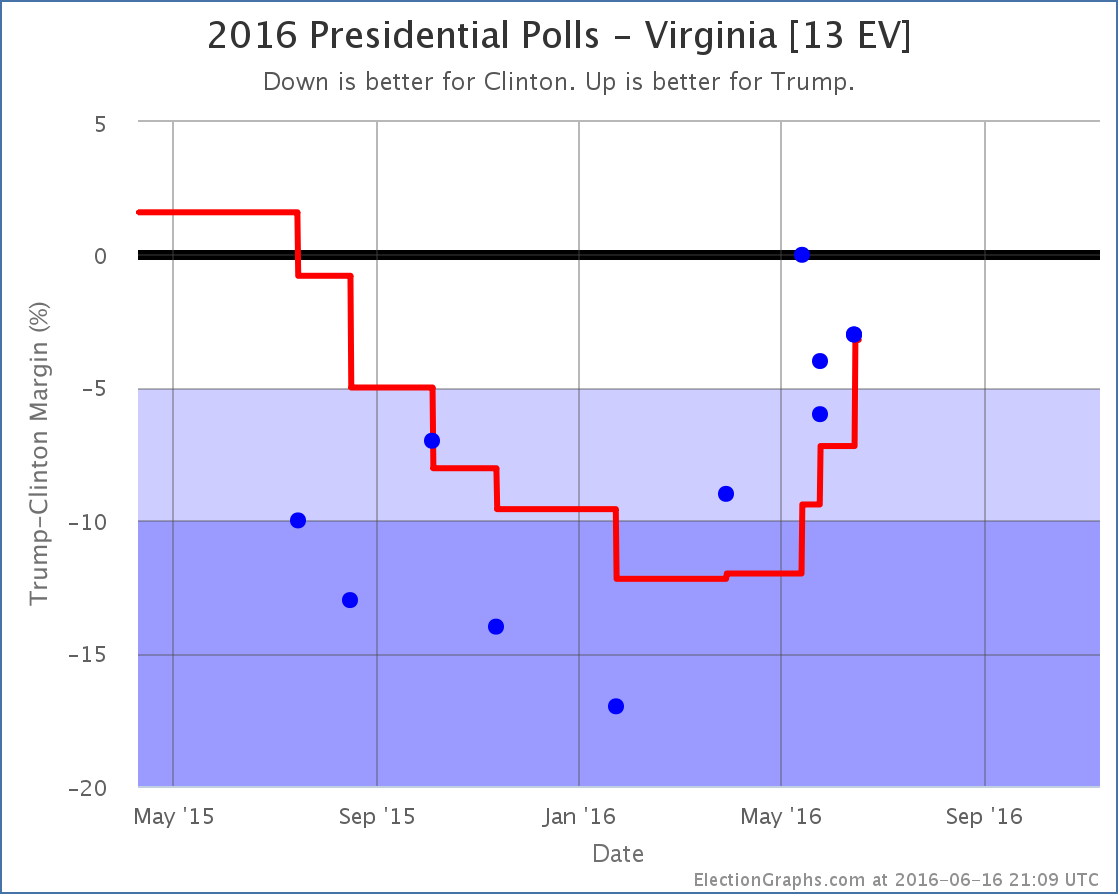
In Virginia on the eve of Trump becoming the clear winner on the Republican side he was behind by 12% in the Election Graphs average. With every poll since then, his position has improved. He’s now behind by only 3.2%. The most recent results were from June 13-15… well after the narrative of Trump’s collapse in the national polls was taking hold, and after weeks of Trump doing and saying things that seemed to be damaging his prospects nationally.
But yet the newest results have Trump down only 3% in a state where he had a poll showing him down 17% back in January. This trend does not look like a collapse. Quite the contrary. It does look like Trump is in a downward spiral in the national polls. But in Virginia specifically, he is doing better than he has since last August.
It seems strange that Virginia would be rapidly moving in the opposite direction than the national polls. Perhaps if we had weekly polls in Virginia we might have seen a different picture. Perhaps there have been large swings up and down that are just invisible because there have not been enough polls to show it. Maybe. But with the data we have, it really looks like Virginia has been on a Trumpward swing, despite the national trends.
With Virginia now close, we now include Trump winning it in “Trump’s best case”. So a quick look at the national trend:
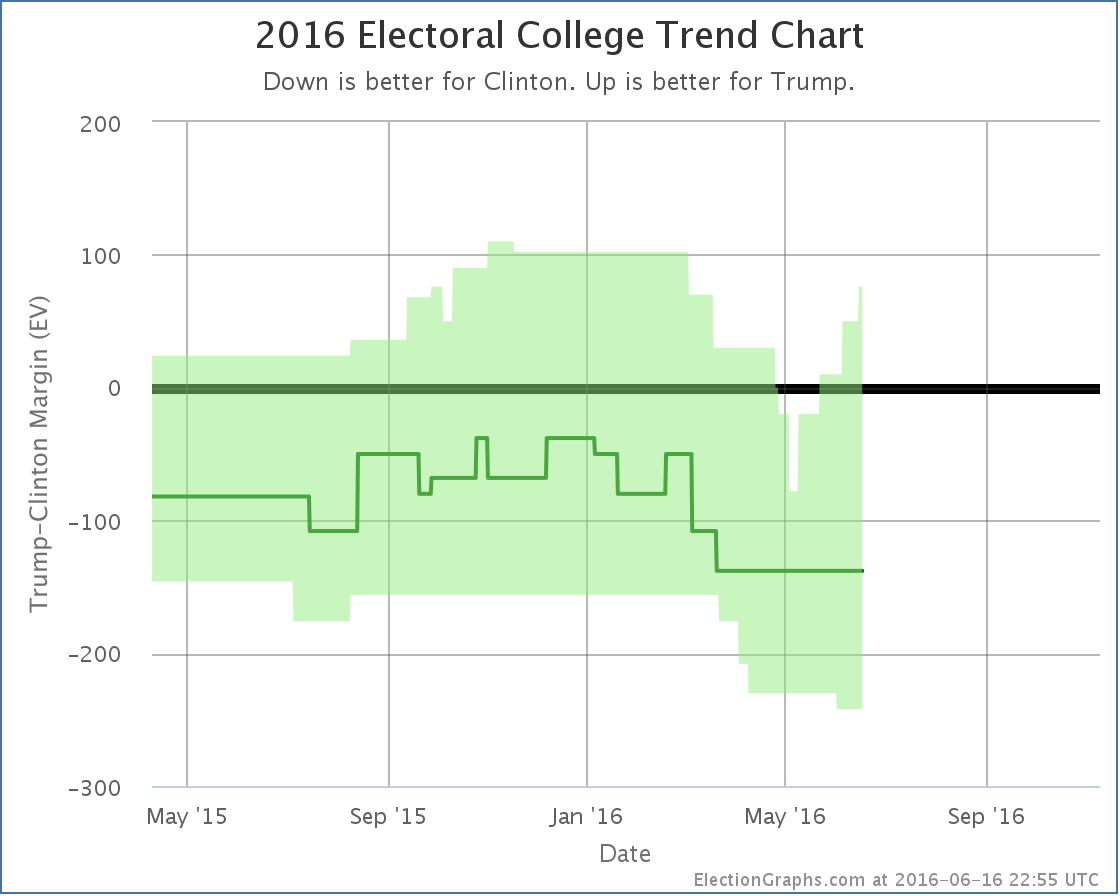
Aside from the one bump showing Clinton making Utah close, the trend here at the state level looks like Trump making a number of states closer. First Florida, then North Carolina, then Pennsylvania, now Virginia.
Trump isn’t flipping states, but he is making more states close. The national picture may look different, but at the state level, which is what actually determines the winner in November, there isn’t a Trump collapse visible yet. Trump is actually looking stronger.
Pennsylvania
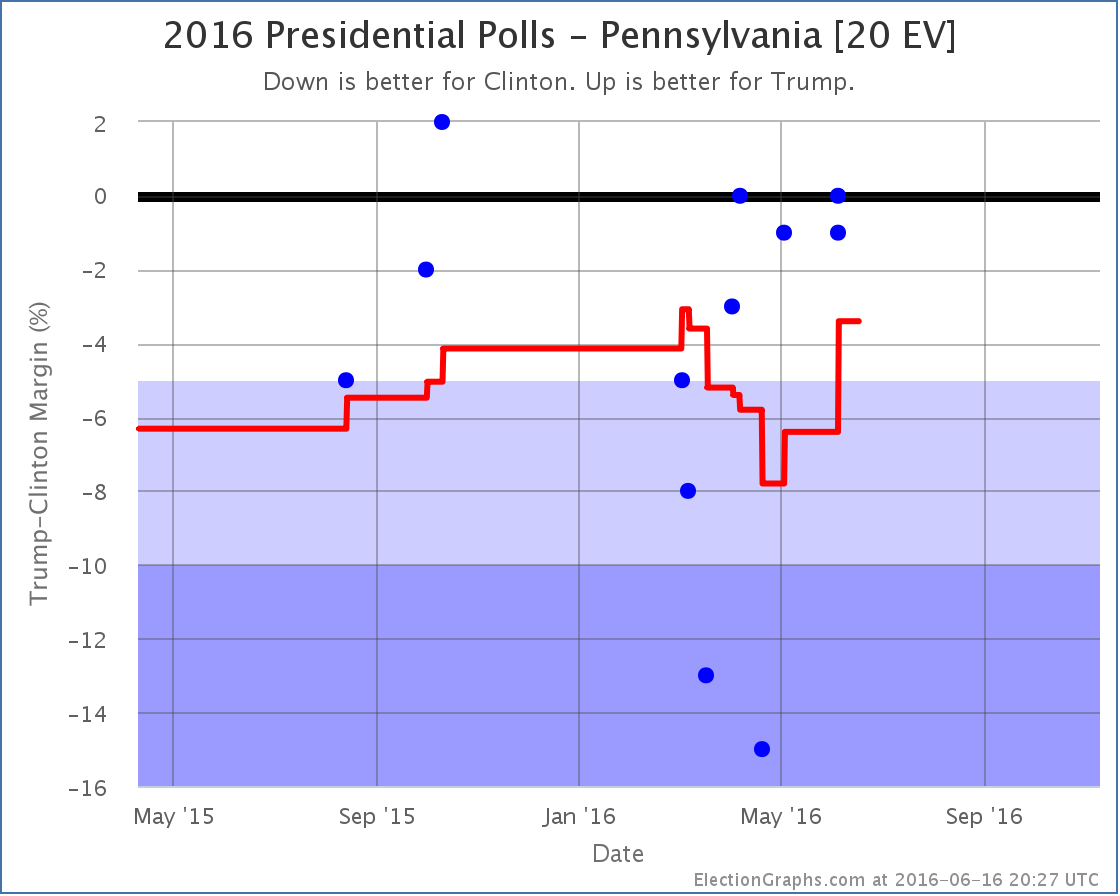
With Jill Stein now the presumptive nominee of the Green party, I added in a number of polls I had been tracking but not yet including in the analysis that included Jill Stein along with the major party candidates and Gary Johnson for the Libertarians. Among those was a poll in Pennsylvania showing a 1% Clinton lead over Trump. This did not change the status of Pennsylvania, which had already moved to Weak Clinton in the last update, but since Pennsylvania was the tipping point state, it moved that metric:
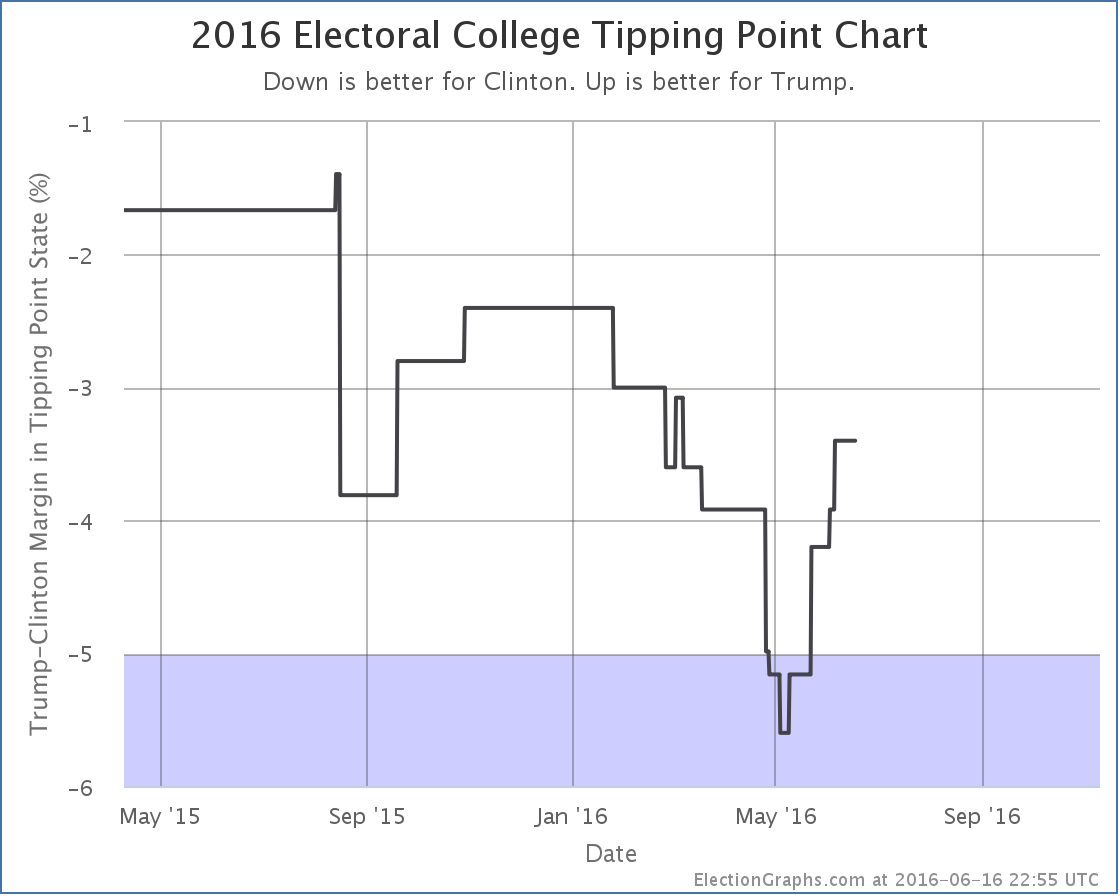
The tipping point state remains Pennsylvania, but the margin moves from a 3.8% Clinton lead to a 3.4% Clinton lead.
So with today’s updates, both Trump’s “best case” and his tipping point improve.
The downward trend in the national numbers may eventually show itself at the state level, but it hasn’t yet.
144.9 days until the polls start closing on Election Day 2016.
Note: This post is an update based on the data on ElectionGraphs.com. Election Graphs tracks both a poll based estimate of the Electoral College and a numbers based look at the Delegate Races. All of the charts and graphs seen in this post are from that site. Additional graphs, charts and raw data can be found there. Follow @ElectionGraphs on Twitter or like Election Graphs on Facebook to see announcements of updates or to join the conversation. For those interested in individual general election poll updates, follow @ElecCollPolls on Twitter for all the polls as they are added. If you find the information in these posts interesting or useful, please consider visiting the tip jar.
Clinton clinched the nomination last week, but DC still hadn’t voted. Now they have.
Clinton got 16 delegates, Sanders got 4.
Since last week when I posted the CA/NJ/NM/MT/SD/ND results, we had updates from CA/NJ/SD as well as many to superdelegate preferences. The net result of all of these was Clinton +7, Sanders +5.
So net change since last week: Clinton +23, Sanders +9.
All the caucuses and primaries are now over. There are still 116 superdelegates who have not expressed a preference publicly, but what they do at this point no longer matters to the nomination. Similarly, while it is possible that the superdelegates who have already supported someone could change their minds, it is unlikely to happen in significant numbers absent an earthshaking surprise.
So we are done.
Lets look at the updated graphs:
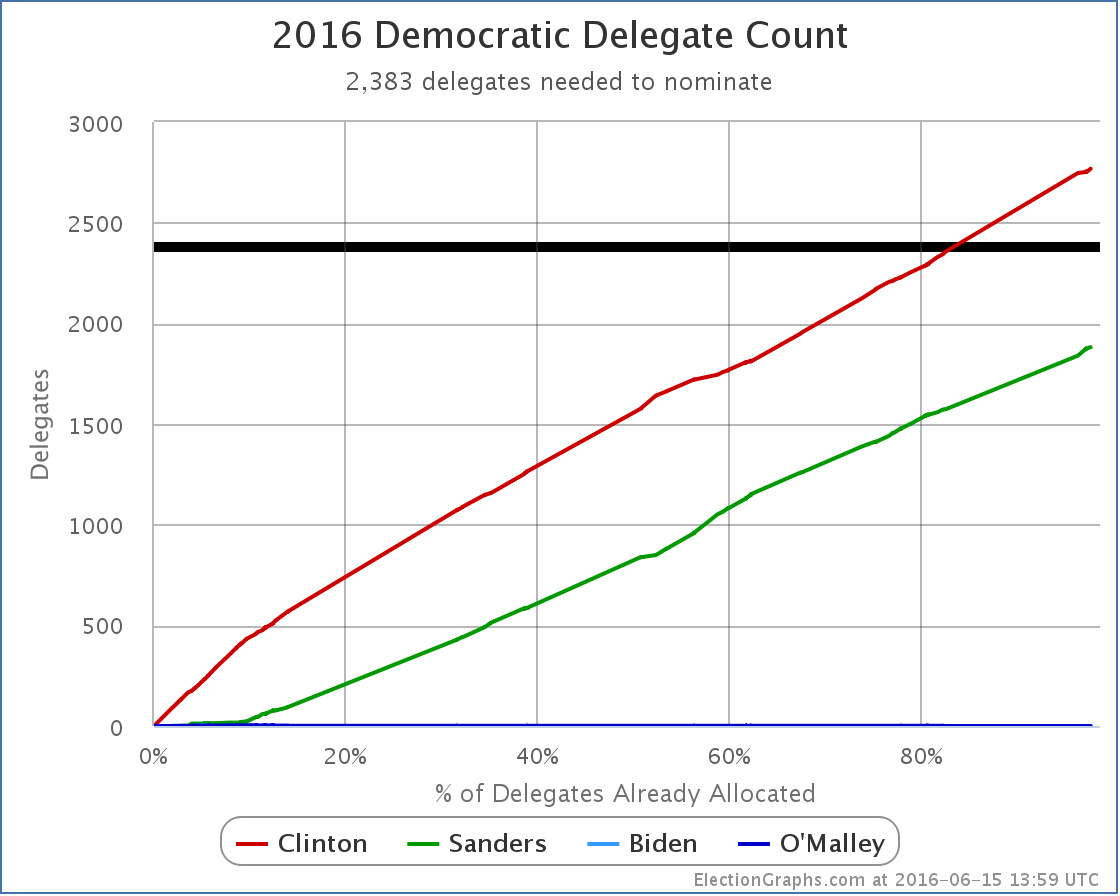
The delegate count is now: Clinton 2768, Sanders 1881, with 116 TBD.
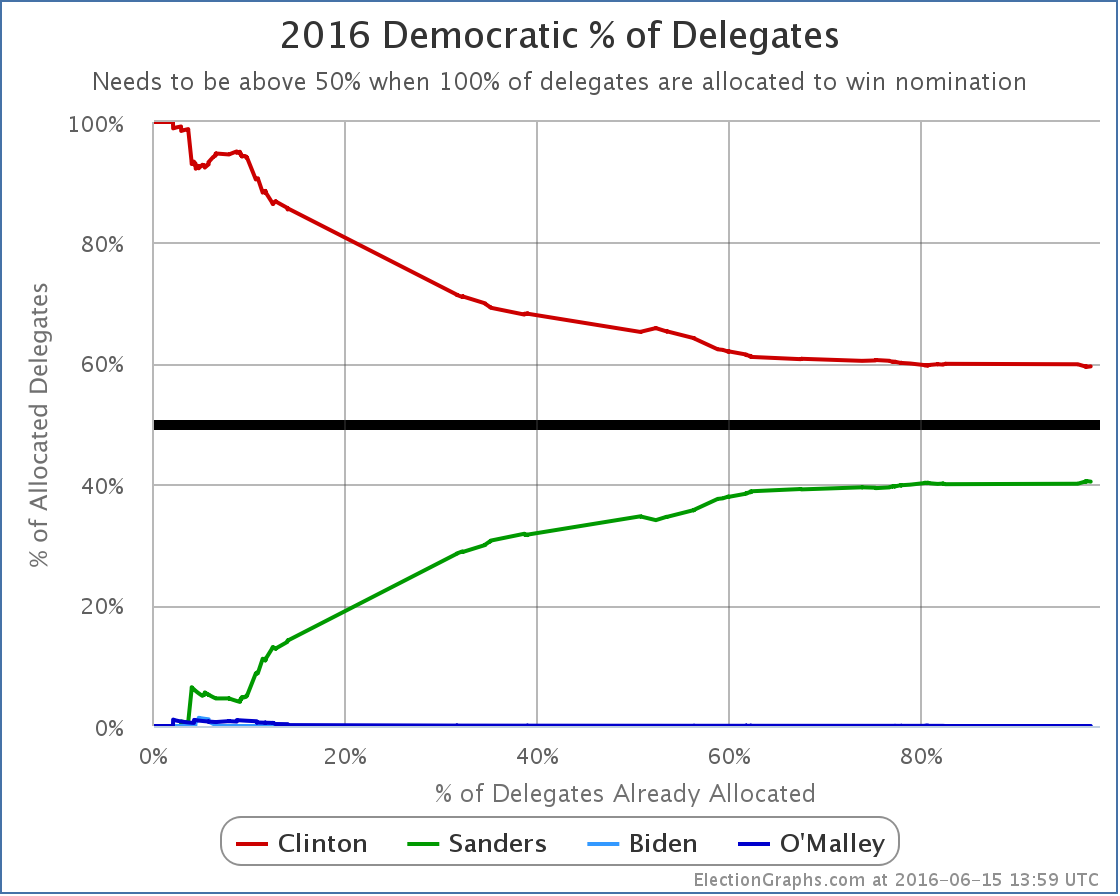
Clinton now has 59.54% of the delegates, Sanders has 40.46%.
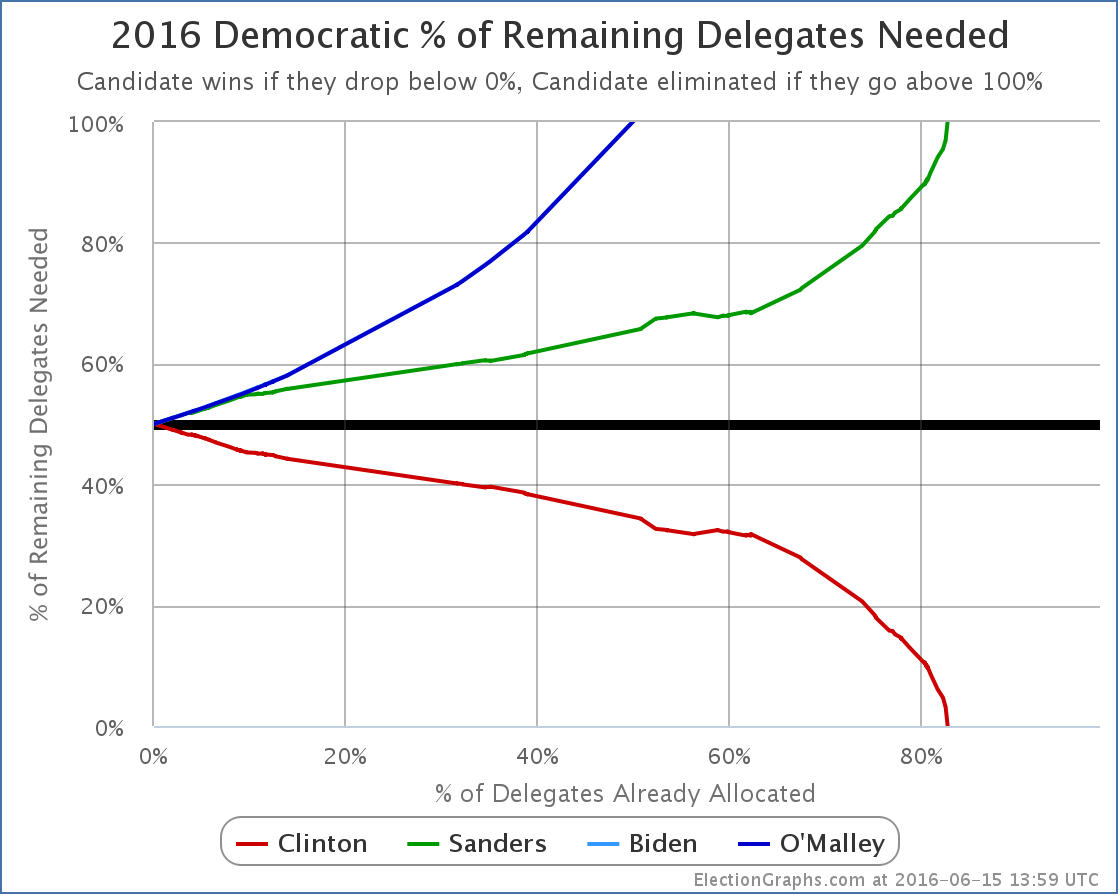
It didn’t change with the DC results since the race was already won, but here again is the “% remaining needed to win” chart.
There isn’t much else to see here absent unexpected craziness. I gave my thoughts wrapping up the Democratic race last week. If there are any additional developments you will see them here. But aside from straggler superdelegates revealing their preferences, nothing of significance is expected.
The Republicans are done too of course.
We have Clinton vs Trump. It is time to settle down and get comfortable for the general election coverage.
146.4 days until the polls start to close on Election Day 2016. Buckle up!
Update 2016-06-18 16:19 UTC – Superdelegate update: Clinton +12, Sanders -1.
Update 2016-06-22 15:47 UTC – Superdelegate update: Clinton +3.
Update 2016-06-22 15:48 UTC – Update from California: Clinton -8, Sanders +8.
Update 2016-06-24 17:06 UTC – Superdelegate update: Clinton +2.
Update 2016-06-28 06:39 UTC – Superdelegate update: Some shuffles, but zero net change.
Update 2016-06-30 06:00 UTC – Update from California. Net change: Clinton -1, Sanders +1
Update 2016-07-01 05:00 UTC – Update from California. Net change: Clinton -1, Sanders +1
Update 2016-07-10 16:00 UTC – Update from California and the Virgin Islands. Net Change: Clinton -1, Sanders +2
Update 2016-07-12 03:33 UTC – Superdelegate update: Clinton +2
Update 2016-07-13 03:56 UTC – Superdelegate update: Net change Clinton +1, Sanders -1. This is Sanders endorsing Clinton.
Update 2016-07-17 15:30 UTC – Superdelegate update: Clinton +3. Update from Puerto Rico: Clinton +1, Sanders -1
Update 2016-07-18 14:25 UTC – Superdelegate update: Clinton +1.5, Sanders -1.5
Update 2016-07-20 07:27 UTC – Superdelegate update: Clinton +2, Sanders -1
Update 2016-07-21 15:56 UTC – Superdelegate update: Clinton -1. This was due to Rep Takai (HI) dying, so total number of delegates also -1.
Update 2016-07-26 07:27 UTC – Final superdelegate update: Net change Clinton +1. This makes the final totals Clinton 2782.5, Sanders 1889.5. Next update will be the convention roll call.
Update 2016-07-28 15:34 UTC – Actual convention roll call results were Clinton 2842, Sanders 1865, DNV 56. So Clinton gained 59.5 delegates while Sanders lost 24.5 delegates compared to the last estimates here.
Note: This post is an update based on the data on ElectionGraphs.com. Election Graphs tracks both a poll based estimate of the Electoral College and a numbers based look at the Delegate Races. All of the charts and graphs seen in this post are from that site. Additional graphs, charts and raw data can be found there. Follow @ElectionGraphs on Twitter or like Election Graphs on Facebook to see announcements of updates or to join the conversation. For those interested in individual general election poll updates, follow @ElecCollPolls on Twitter for all the polls as they are added. If you find the information in these posts interesting or useful, please consider visiting the tip jar.
Sam is solo again on this week’s Curmudgeon’s Corner podcast. As you would expect, the big topics are election related. Clinton clinching. The Sanders dead enders. Trump’s really bad week. Veep speculation. All of that. In addition, some brief hits on the Brock Turner case, the Gawker bankruptcy, some Apple stuff… and more!
Click below to listen or subscribe… then let us know your own thoughts!

Recorded 2016-06-11
Length this week – 1:36:22
 1-Click Subscribe in iTunes 1-Click Subscribe in iTunes
 View Podcast in iTunes View Podcast in iTunes
 View Raw Podcast Feed View Raw Podcast Feed
 Download MP3 File Download MP3 File
 Follow the podcast on Facebook Follow the podcast on Facebook
Show Details:
- (0:00:10-0:07:16) But First
- Alone Again
- Agenda
- Early Mornings
- (0:08:06-0:38:24) Election 2016 – Democrats
- Clinton clinches
- Sanders dead enders
- Will Sanders get what he wants?
- Clinton/Warren?
- Stein effect?
- Sanders as an independant?
- (0:39:28-1:11:04) Election 2016 – Republicans
- Trump’s bad week
- Trump’s fundraising
- Where Trump is spending money
- Dump Trump?
- Trump veeps
- Johnson effect?
- (1:12:08-1:36:02) Lightning Round
- Alex promotes his channel
- Brock Turner case
- Gawker bankruptcy
- Some Apple Stuff
- I got tipped!
A couple of days ago, Utah moved from Strong Trump to Weak Trump in my classifications, so I speculated that Trump’s post-clinching bump might be over. But with the most recent batch of polls (from Pennsylvania, Florida and Connecticut) there is already another move in Trump’s direction. Remember that the picture given by trailing state poll averages will always “lag” the underlying situation a bit, but for the moment, the trend I track here still looks like it is moving in Trump’s direction.
Lets look at the details. The state that changes status is Pennsylvania:
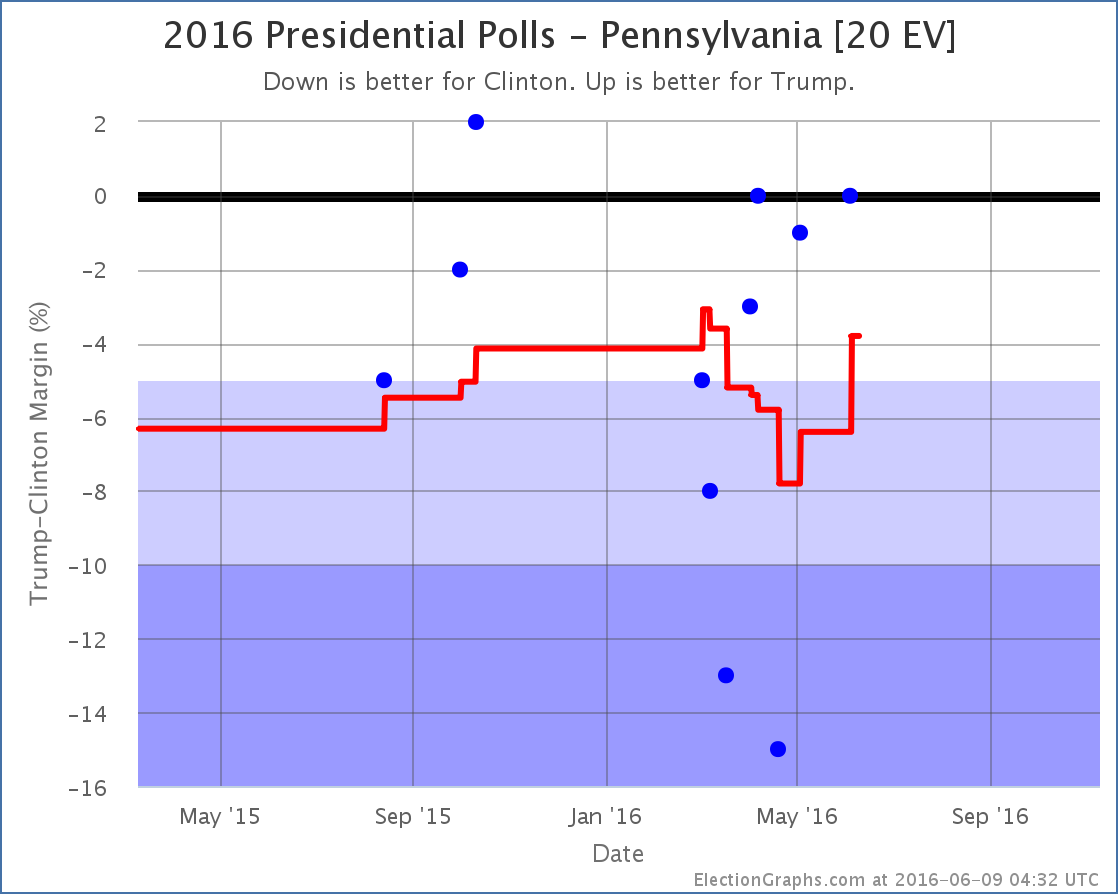
The range of poll results in Pennsylvania has been huge. From a 15% Clinton lead to a 2% Trump lead. With the addition of the latest poll, one of the two polls that showed Clinton up by more than 10% fall off the average, and therefore the average pops in Trump’s direction.This brings the average in Pennsylvania to a 3.8% Clinton lead. Clinton is still ahead, but it is once again close enough that I allow for the possibility of Trump pulling the state into his column.
If Trump actually is able to get Pennsylvania, it is a big get. Pennsylvania has the sixth largest number of electoral votes. Adding Pennsylvania into Trump’s best case, the national trend now looks like this:
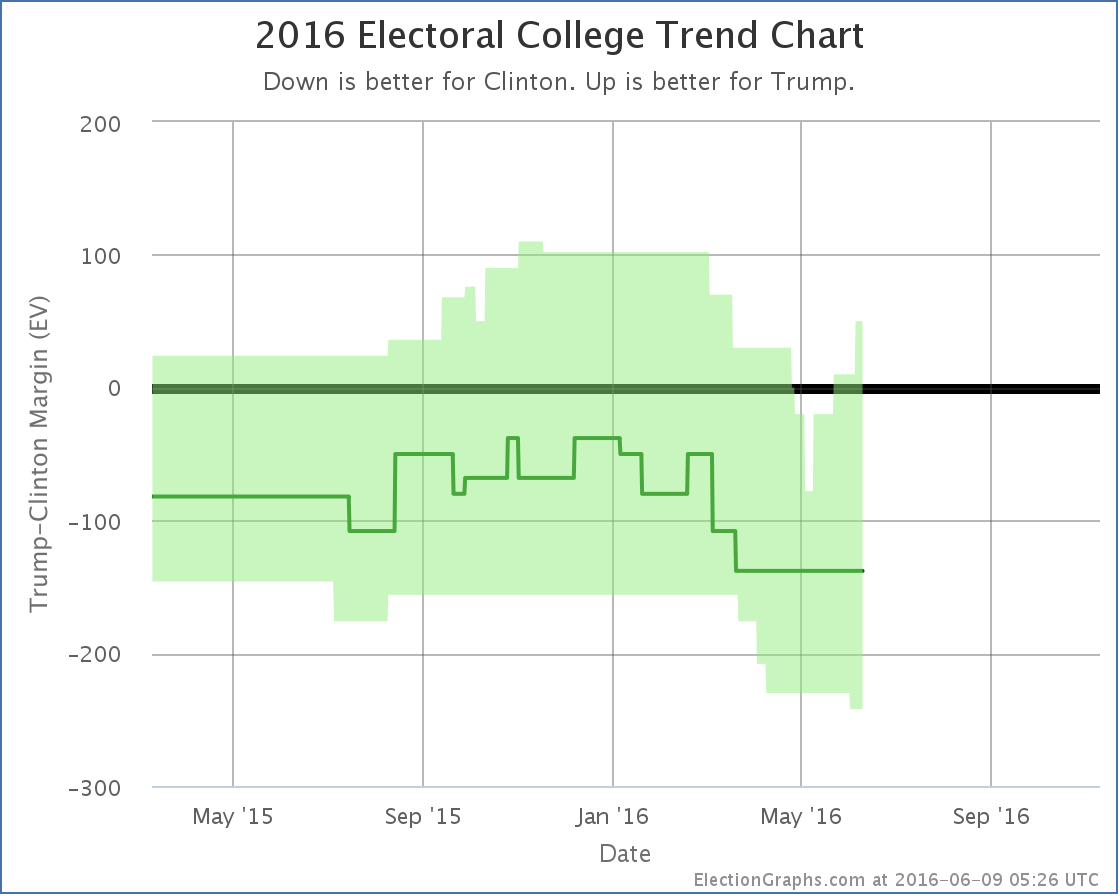
That spike in the upper right is Pennsylvania. In both electoral votes and the potential to make a difference in the race, Pennsylvania is more significant than Utah. If Clinton were to win Utah, it would be a surprise extra on top of an already large win, but a competitive Pennsylvania would potentially be very important to a winning path for Trump.
With Pennsylvania in the mix, if Trump won all the states where he leads, plus all the states where Clinton’s lead is less than 5%, Trump wins by a 50 electoral vote margin. This is his best “best case” since March.
Overall, despite Utah, and despite the fact the center “expected” line hasn’t moved, it looks like the overall trend here is still toward Trump.
The tipping point also moves with this change, and further boosts that impression:
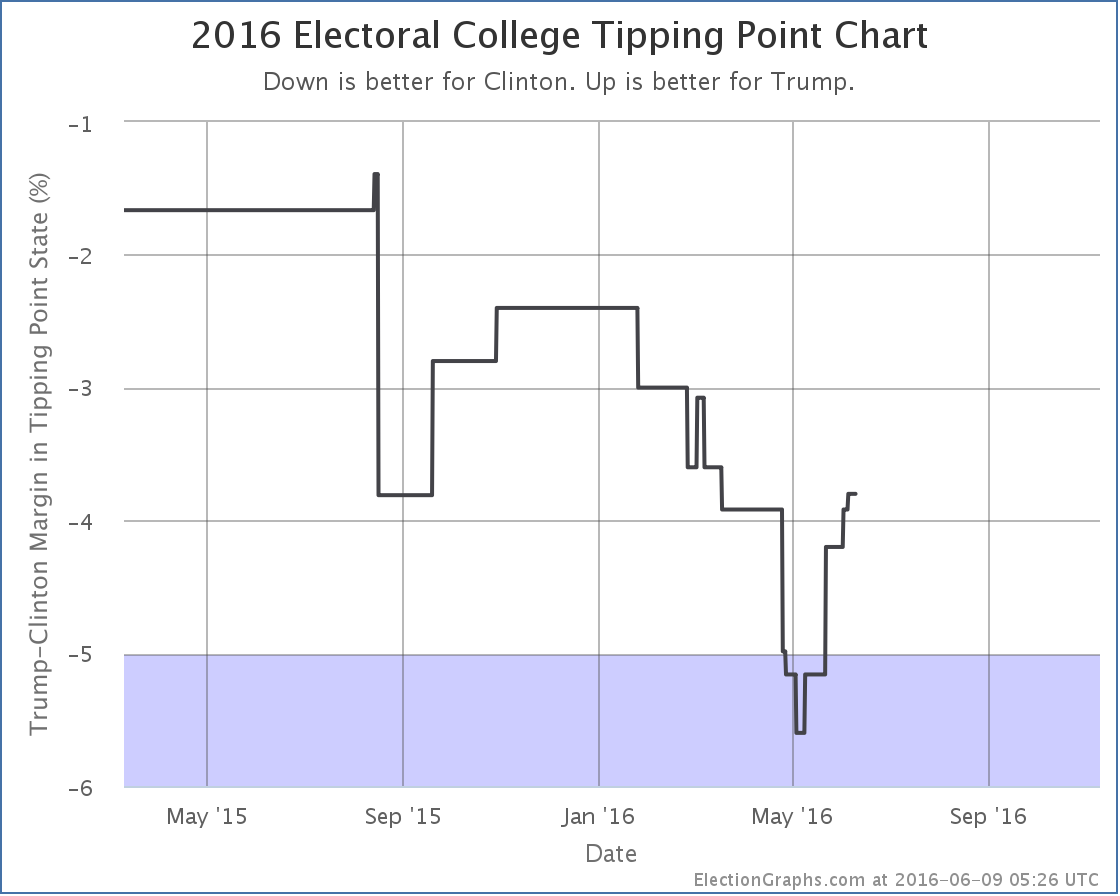
The tipping point moves from a Clinton lead of 3.9% in Nevada to a Clinton lead of 3.8% in Pennsylvania.
Given Clinton clinching the Democratic nomination and the national polls already showing Clinton pulling ahead, an end to the Trump bounce and a beginning of a Clinton bounce is to be expected. But it isn’t showing up here yet…
152.7 days until polls start to close on election night.
Note: This post is an update based on the data on ElectionGraphs.com. Election Graphs tracks both a poll based estimate of the Electoral College and a numbers based look at the Delegate Races. All of the charts and graphs seen in this post are from that site. Additional graphs, charts and raw data can be found there. Follow @ElectionGraphs on Twitter or like Election Graphs on Facebook to see announcements of updates or to join the conversation. For those interested in individual general election poll updates, follow @ElecCollPolls on Twitter for all the polls as they are added. If you find the information in these posts interesting or useful, please consider visiting the tip jar.
By the Election Graphs count, Clinton now has 2745 delegates, which puts her well over the 2383 require to clinch the nomination.
As they did with the Republicans, AP went out and called many still publicly uncommitted superdelegates and was able to get the winning candidate to the magic number in their count a little earlier than those of us only using public commitments. In this case AP made their announcement Monday. The count here went over the magic number within minutes of the polls closing in New Jersey Tuesday night.
As of the writing of this post, all but 4 straggling delegates from New Jersey out of the 694 delegates up for grabs last night seem to be reasonably determined, so lets run down then numbers.
After Puerto Rico, Clinton only needed 5.05% of the remaining delegates to win. Sanders needed 95.19% of the remaining delegates. Clinton needed 43 delegates, Sanders needed 811.
In CA/NJ/NM/MT/SD/ND Clinton got 391 delegates while Sanders got 299. (As mentioned, there are still 4 TBD from NJ as of this writing.)
In the days between Puerto Rico and the June 7th results coming in, superdelegate changes yielded a net change of: Clinton +14, Sanders +1, O’Malley -1. Yes, that lone O’Malley superdelegate finally flipped… to Clinton.
Total change since Puerto Rico: Clinton +405, Sanders +300, O’Malley -1
That is Clinton 57.53%, Sanders 42.61%. (Adds to more than 100% because Clinton took the one delegate from O’Malley.)
So Clinton met her target, Sanders did not.
405 delegates is significantly more than the 43 delegates Clinton needed to go over the top.
She clinches. She is the presumptive nominee.
Lets check out the updated graphs:
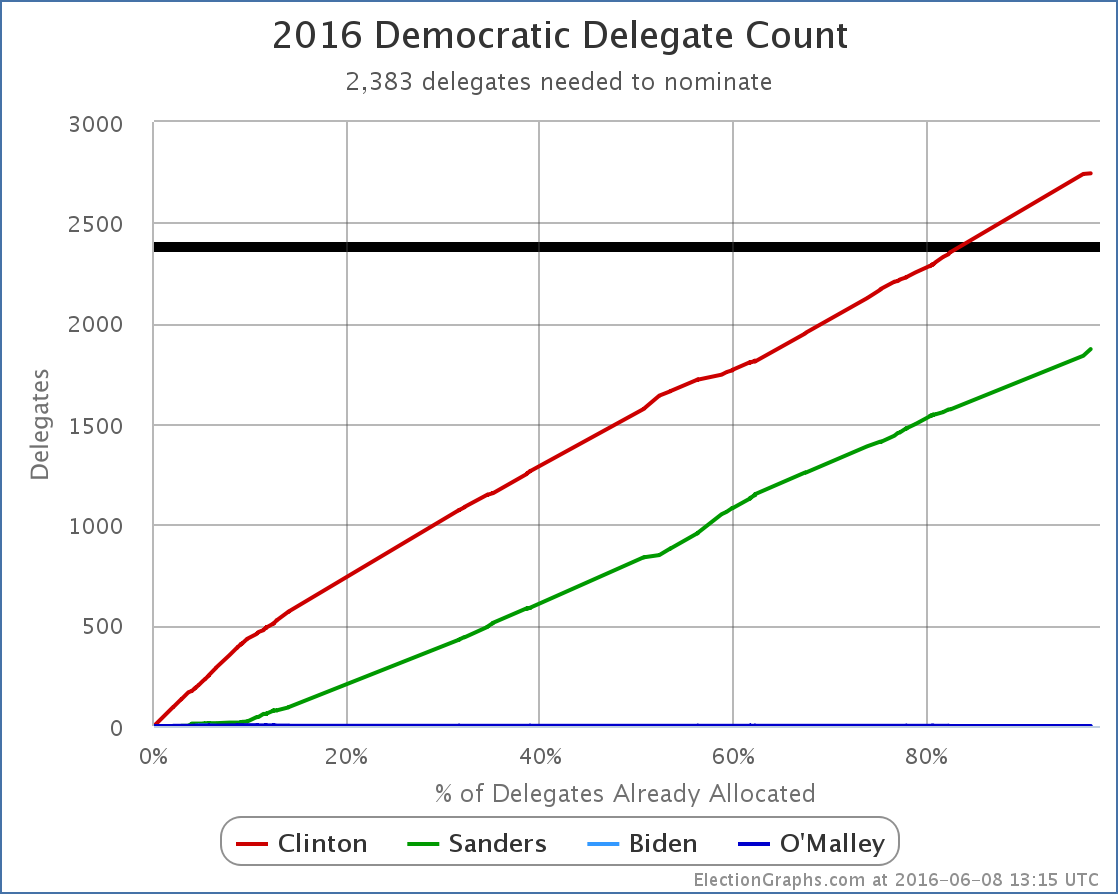
New delegate totals: Clinton 2745, Sanders 1872. Clinton blows past 2383 and is now well beyond where she needed to get.
There are 148 delegates left. Washington DC has 20 up for grabs next week. There are those 4 from New Jersey too. The other 124 are superdelegates who have not yet stated a preference. Clinton needs none of these delegates. Sanders could get every single one of these delegates, and would still lose decisively.
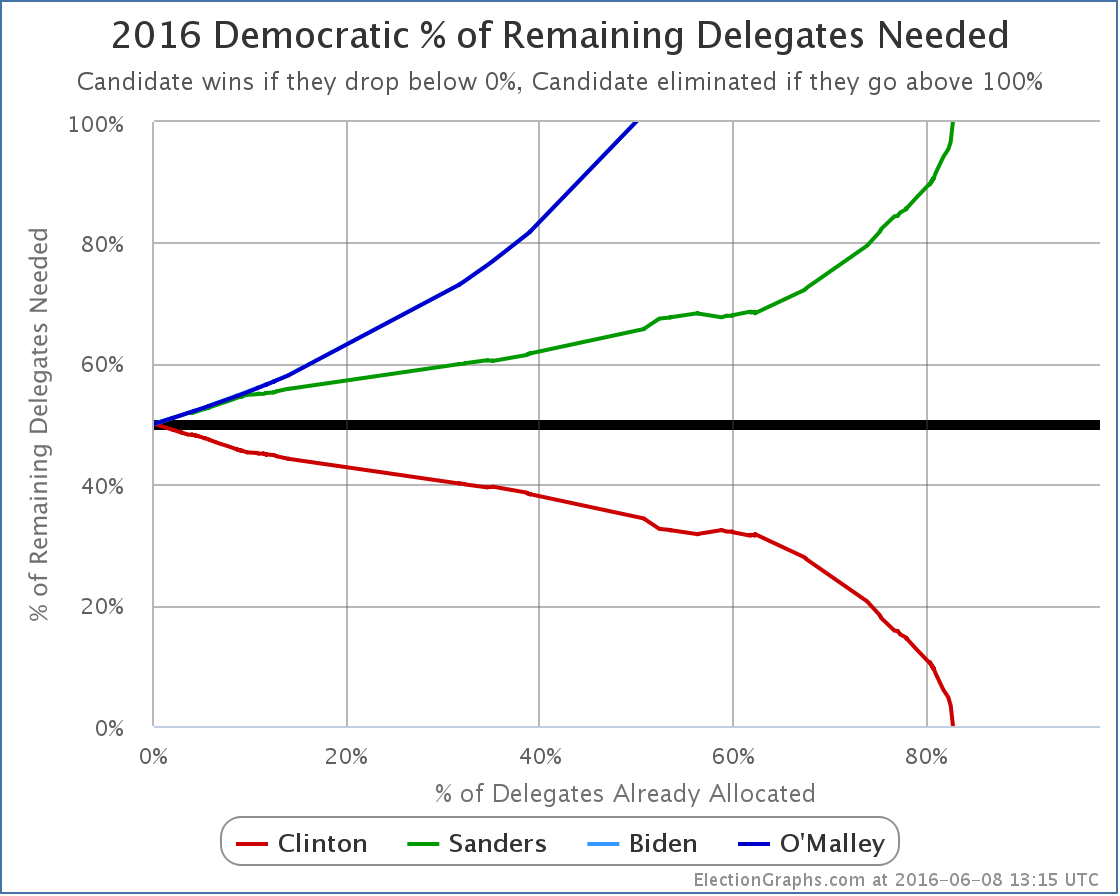
The “% of delegates needed to win” chart is complete. Clinton dropped below 0%, Sanders went above 100%.
One more graph:
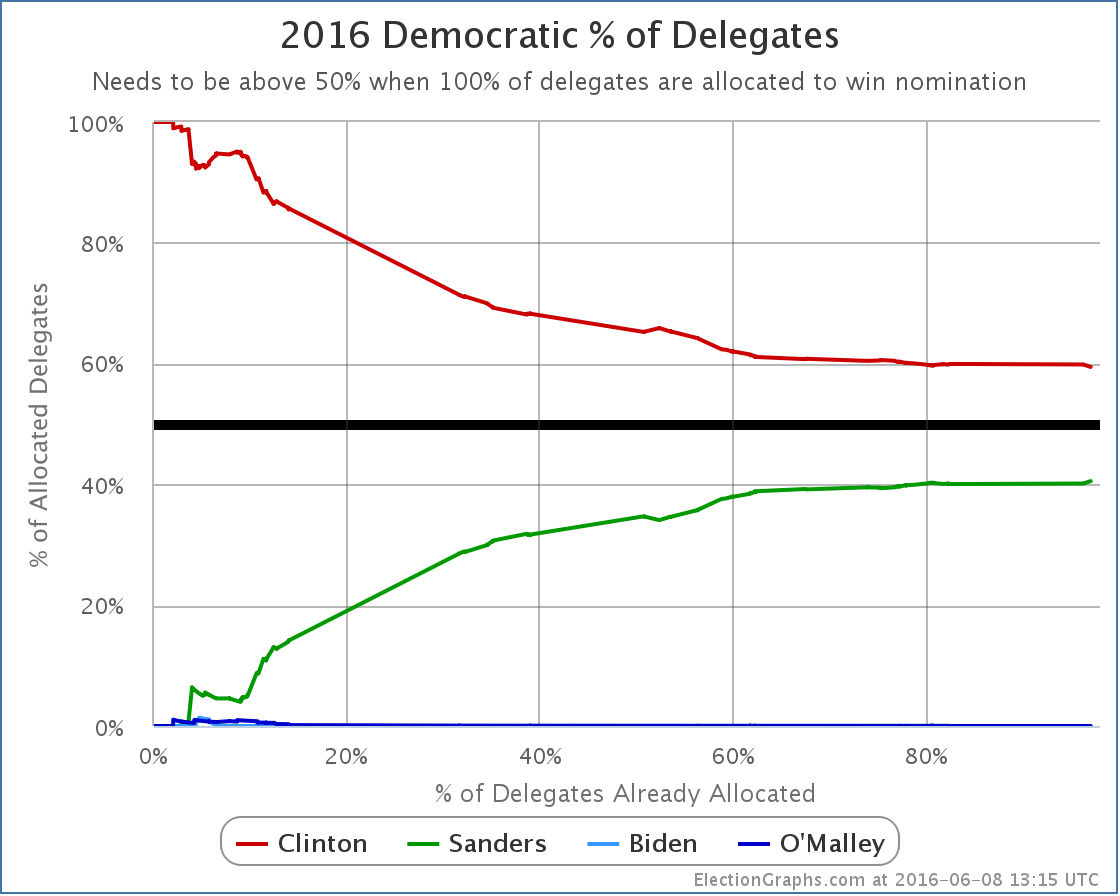
Since she started at 100% of the delegates by getting superdelegates before the first primaries or caucuses even happened, Clinton’s “% of delegates” number of course trended downward through most of the cycle. But for quite some time now the delegate race has stuck pretty close to being a 60% to 40% split in Clinton’s favor. As of now, it sits at Clinton 59.45%, Sanders 40.55%.
OK, now to step back a little…
Clinton dominated this race from the beginning. There were only a handful of moments where Sanders even managed to close the gap a little bit. Sanders was never even close. It was clear since the beginning of March… at the latest… that is being generous… it was fairly clear even before that… that Sanders catching up would take a miracle. The one thing that has been amazing throughout the primary process is the ability of many Sanders supporters to be in complete denial about this in the face of overwhelming evidence. It is one thing to be enthusiastic about your candidate and even to hope for that miracle, but it is another thing to not even recognize that you are losing and that it would indeed take that miracle to win.
And yes, some of those Sanders folks are still in denial even now. Because superdelegates. So a quick look. Right now we have Clinton 2745, Sanders 1872. There are 124 remaining superdelegates. Lets give them all to Sanders. For fun give Sanders all 20 DC delegates and the 4 from New Jersey too. Now we have Clinton 2745, Sanders 2020. All delegates are now allocated. Sanders is still short. To get to 2382 he would need at least 182 delegates who have committed to Clinton to change their minds and vote for Sanders instead. Clinton has 532 superdelegates by the latest count. So that means 34.2% of the superdelegates currently committed to Clinton would have to flip.
They would have to do that flip in the face of Clinton having won the popular vote (even if you include estimated popular vote for caucus states), Clinton having won the pledged delegate count, and Clinton having won the most states. Not to mention significant numbers of the superdelegates not simply being lukewarm Clinton supporters, but being people who she has actively cultivated for many years, a good number of which have actually been active in her campaign.
Is it mathematically possible? Yes. Of course it is. Is it going to happen absent something catastrophic happening to Clinton? No.
Some Sanders folks are still holding out the “What if Clinton is indicted?” scenario. My guess is most superdelegates would consider it an unfair and unjust indictment and stick by their candidate. It probably wouldn’t be enough. Perhaps I suppose. It is a stretch though. More realistically it would take a debilitating health issue or some brand new scandal so serious it dwarfs everything that has come up so far. Can you imagine these sorts of things? Of course. But they are all unforeseen unpredictable types of event, not things you decide to continue a campaign based on. After all, there are ways Martin O’Malley can still win the nomination too!
You can conjure similar scenarios on the other side too of course, but absent that kind of craziness, we now have our nominees in both parties.
So we have Clinton vs Trump. Time to start focusing on the general election analysis!
153.4 days until polls start to close on election day!
Update 2016-06-12 17:16 UTC – Superdelegate update. Net Change: Clinton +11
Update 2016-06-12 17:43 UTC – Missed one change in the superdelegate update above. Additional Change: Clinton -1. (So Clinton +10 for this day’s scan.)
Update 2016-06-12 18:02 UTC – Updates from California, New Jersey, and South Dakota (including the remaining 4 TBD delegates from New Jersey). Net change: Sanders +4.
Update 2016-06-15 01:40 UTC – Superdelegate update. Net Change: Clinton -3, Sanders +1.
Note: This post is an update based on the data on ElectionGraphs.com. Election Graphs tracks both a poll based estimate of the Electoral College and a numbers based look at the Delegate Races. All of the charts and graphs seen in this post are from that site. Additional graphs, charts and raw data can be found there. Follow @ElectionGraphs on Twitter or like Election Graphs on Facebook to see announcements of updates or to join the conversation. For those interested in individual general election poll updates, follow @ElecCollPolls on Twitter for all the polls as they are added. If you find the information in these posts interesting or useful, please consider visiting the tip jar.
Edit 15:19 UTC to mention the 4 delegates from New Jersey in the list of remaining delegates and the calculations for superdelegates flipping.
|
|


