Edit 2014-08-16 02:09 UTC to fix typo in title. It was supposed to be Snuffleupasam. Like Snuffleupagus. Not Suffleupasam. Like nothing.
|
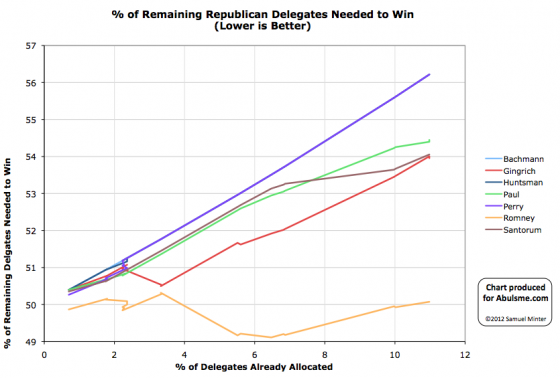
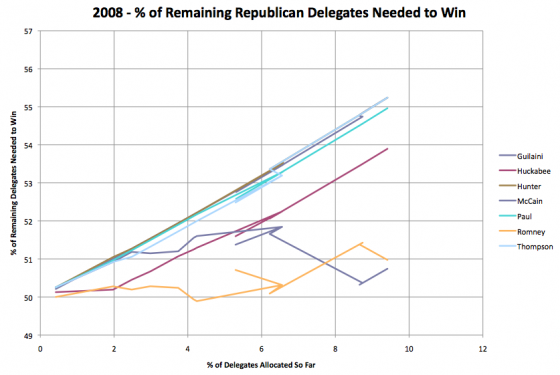
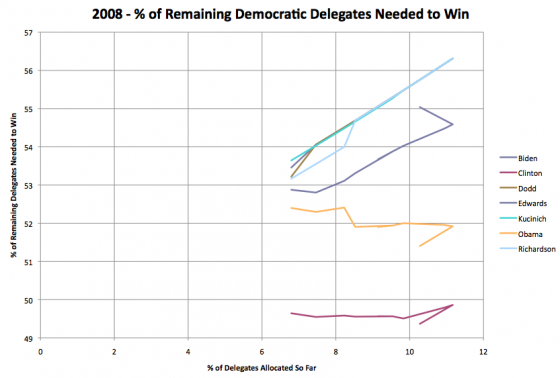
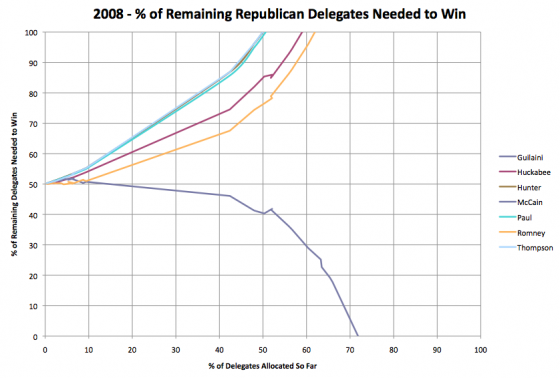
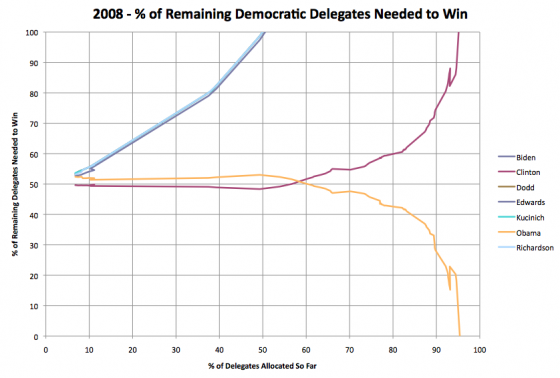
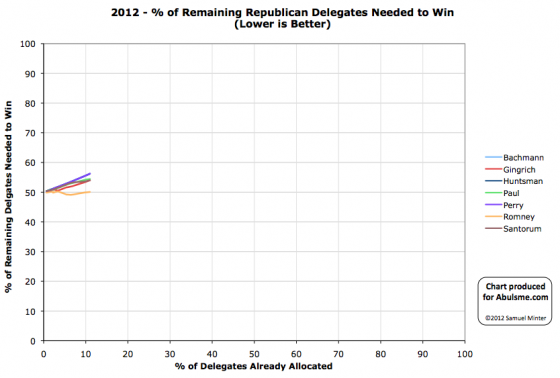
OK, beating a dead horse a bit, but I finally made graphs, so one more look. (Previous comments on this here and here, 2012 Delegate race here, 2008 Delegate races here.) The key is that while if you look at the calendar, and say where were things on February 22nd 2008… On the Republican side you’d see that McCain had for all intents and purposes wrapped things up. On that date 60.4% of the delegates had already been allocated. McCain had 63.9% of the delegates, while his closest competition (Romney) only had 19.9%. In order to get to his magic number McCain only needed 29.0% of the remaining delegates. For Romney to catch up, he would have needed 96.0% of the remaining delegates. Romney was just days away from being mathematically eliminated (that would happen on February 26th). Meanwhile on the Democratic side, 64.1% of the delegates had been allocated. Obama had 50.8% of the delegates to Clinton’s 48.2%. To win Obama needed 48.6% of the remaining delegates, Clinton needed 53.3% of the remaining delegates. Clearly the Democratic race was still close (although from here on out, Obama just increased his lead, Clinton never really made up any ground except when Florida’s delegates were reinstated near the end). But the Republican race was over. You’d then compare to Romney today and build a narrative of Romney not being able to close the deal, of wondering why he can’t just wrap this up, after all McCain had wrapped this up by this time, right? But this year, on the Republican side, as of today we only have 11.0% of the delegates allocated (and that counts estimates from caucus states, it is less without that). So how does this year look and compare with 2008 when you look at it by % of delegates allocated instead of by date? Well, here is the “% of remaining needed to win” chart with % of delegates allocated on the horizontal axis instead of date: You can see clearly that Romney is well ahead of his competition, and while he isn’t yet diving down toward zero (indicating he is heading quickly to the nomination) he is holding steady, while everybody else is trending upward toward being eliminated. Gingrich and Santorum are neck and neck for 2nd place and both need about 54% of the remaining delegates to catch up and win. 54% is not an impossible number in a two man race. It is a lot better than either has done so far, but if one of them stops getting delegates and the other picks up all of their support, it is in the realm of the possible. But it would be a significant change from what has happened so far. Note, for instance, that even when Santorum won states, he didn’t win by a big enough margin to actually be catching up. His line still went up. Now what did this look like in 2008? The closest comparison for the Republicans would be as of February 5th… the day before Super Tuesday. At that point 9.4% of the delegates had been allocated. What do we see here? A very different pattern. McCain had only recently (in terms of % of delegates) pulled ahead, but Romney was still close… and gaining! We had a two person race where both were within shooting distance of each other, and neither were yet heading either rapidly up or down on this chart, indicating that they were either on the way to elimination or to the nomination. In 2008 at this point, things really were still close. The very next day, on SuperTuesday, McCain would essentially run away with it, and that would be that. But comparing comparable points in the delegate race, Romney actually has a much bigger lead and advantage on his competition than McCain had in 2008. One more comparison though… The Democrats in 2008. The comparable date there is also February 5th, the day before Super Tuesday. 10.3% of the delegates had been allocated on that side on that day. There are a few oddities in the data from back then… my sources had allocated some delegates, then backtracked, causing the little bit of backtracking on the chart, and when my tracking started on January 1st almost 7% of the delegates were already in place because of Super Delegates who had declared their preferences)… but you can still see the trends. So, most important thing you see here… Clinton was still in the lead! Obama didn’t catch her in delegates until significantly later. But it is clear that both Obama and Clinton are still in contention. Their lines are basically horizontal, and they were pretty close to each other. Neither of them had started moving toward the nomination really, but neither was showing a pattern of getting eliminated either… like Edwards and all the rest were. In this year’s race, all of Romney’s competition are in worse positions than McCain’s competition was at the same time. It is not yet too late for one of them to mount a push and catch up… but it is getting close. Even with the vastly stretched out schedule, there is still a big enough chunk of states coming up on Super Tuesday that we’ll probably see that day be the do or die day for all the not-Romneys. At least for actually catching up and winning. Blocking Romney from 1144 is a lot easier task than actually winning at this point. We’ll know a lot more about how possible (or not) that scenario is after Super Tuesday as well. OK, long post, but finally, for reference, here are the two races in 2008 in full as they played out (rather than just looking at the first 12%). And here is this year’s Republicans at the same scale… Just a little ways left to go, huh? |
||

