This is the website of Abulsme Noibatno Itramne (also known as Sam Minter).
Posts here are rare these days. For current stuff, follow me on Mastodon
|
You may have heard all the breathless coverage last night of Sanders’ surprise win in Michigan. And it was indeed a surprise. He outperformed all the recent polls by a substantial margin. This was a big huge win, right?
Well, no. It wasn’t. The media hype is all around the fact that it is more interesting to cover an actual race than a slow march to an almost inevitable win. Time to look at the numbers.
First of all, the straight up delegates out of Michigan: Sanders 69, Clinton 61
That means Sanders got 53.1% of the Michigan delegates. To be on a pace to catch up and win, he needed 60.2% of the delegates. He may have “won”, but he didn’t win by anywhere near enough to actually catch up with Clinton.
But Michigan wasn’t the only state handing out delegates. Mississippi did too. And Mississippi went for Clinton 32 to 4. So the total for the day was actually Clinton 93 to Sanders 73.
There were also some superdelegate updates since my last post. Net change: Clinton +4, Sanders +3.
So total since the Maine results on Sunday: Clinton 97, Sanders 76.
So Sanders only got 43.9% of the delegates since Sunday. This is not close to 60.2%.
Yes, Sanders pulled out a surprise win in Michigan. But he could duplicate that win in EVERY STATE from here until the end of the primary season and he STILL would not catch up. He would not win. He can’t catch up by “just winning”. He needs to win by huge margins to catch up. That did happen (barely) in Maine. But Michigan didn’t do it, and Sanders has only very rarely managed the margins he would need to catch up.
So, looking at the graph of “% of remaining needed to win”:
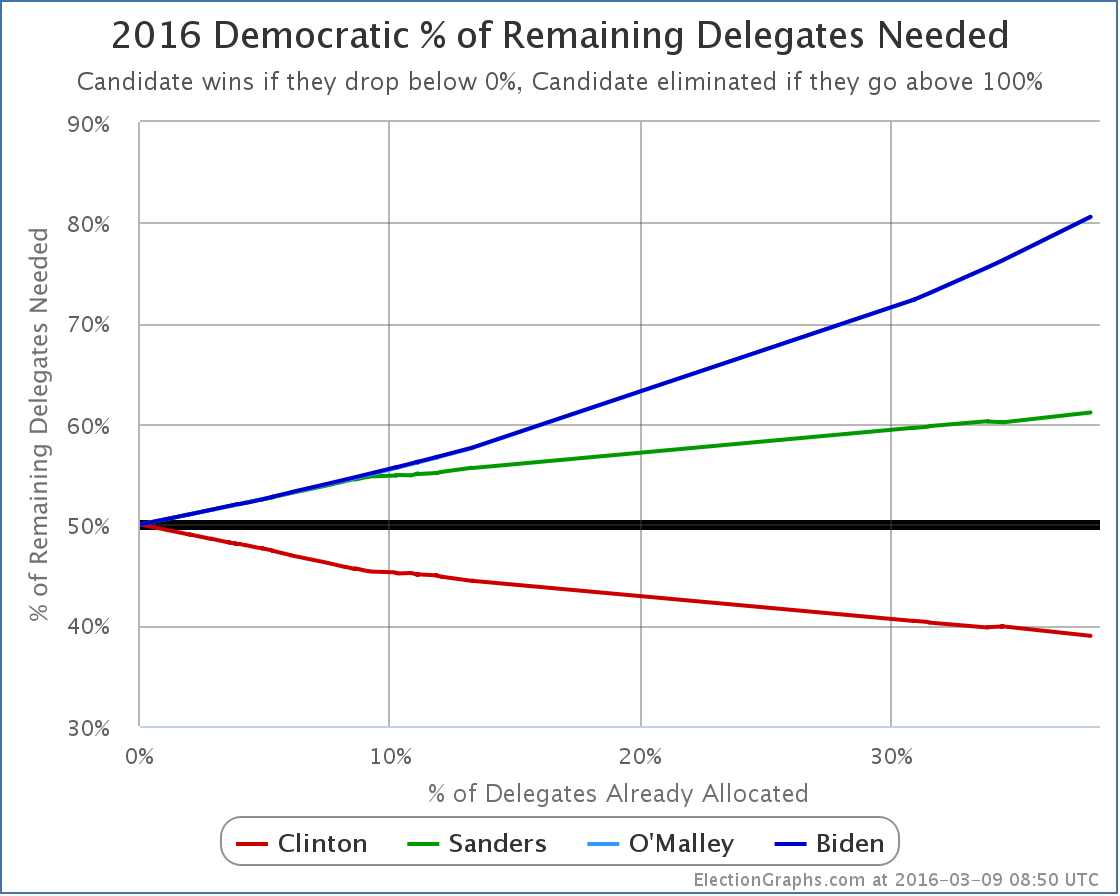
Clinton now needs 38.96% of the remaining delegates to win. Sanders needs 61.14% of the remaining delegates to catch up.
Oh, unless the superdelegates start changing their minds in massive numbers. That would make things harder for Clinton and easier for Sanders. And to be fair, if all 460 of Clinton’s superdelegates flipped to Sanders tomorrow, Sanders would indeed be ahead by 1035 delegates to 771.
I wouldn’t hold my breath on that one though.
Right now the totals are Clinton 1231, Sanders 575.
Next up are the Northern Marianas on Saturday, then Florida, Illinois, Missouri, North Carolina and Ohio next Tuesday.
[Edit 16:22 UTC to add the following exchange]
Minutes after I posted this update, I got a comment via Facebook that prompted me to do some additional analysis. It seemed directly relevant and interesting, so adding it here (lightly edited):
Jenn: Since superdelegates have never actually gone against the popular vote and could change their minds, what’s the math if we simply exclude them? I’m not saying it’ll happen. I’m just curious and too lazy to do it myself.
Sam: On superdelegates, my position is that if they ever start to change their minds because of the results of the pledged delegate race, we will see that because they will say so. So speculating about them changing their minds is pointless, you can actually watch and see if they do. If they start changing their minds, then it is a real thing and it will be measured and tracked as it happens. So long as they don’t, it is just a fantasy. But OK, I’ll quickly do the calculation of what things would look like if you only look at pledged delegates and assume superdelegates will follow the pledged delegate result.
[Edit 2016-03-10 16:07 UTC to strike through the calculation below due to really bad stupid math error that completely invalidates the result. Sanders needed percentage will be closer to 55%. Redoing calculations shortly.]
Sam: OK. Here goes. The current totals are Clinton 1231, Sanders 575, O’Malley 1. If you take out supers, that becomes Clinton 771, Sanders 552. Now, there are 2472 delegates total, so you need 1237 delegates to win. But that includes superdelegates. If the assumption is that supers will go for the pledged delegate winner, then you shouldn’t count them in the total number of delegates either because they now don’t matter. Without supers there are 1755 delegates, and you need 878 to win. Sanders therefore needs 326 more delegates to catch up and win. Between Clinton and Sanders they have collected 1323 delegates already. So there are only 432 pledged delegates remaining. 326/432 = 75.5%. So if you look only at pledged delegates it is actually WORSE for Sanders. He needs nearly 76% of the remaining delegates to catch up and win rather than “only” 61%.
[Edit 2016-03-10 17:30 to add additional conversation correcting the erroneous calculation. I am leaving the first version struck out above for the record. The below is lightly edited from the original Facebook conversation.]
Sam: Urg!!!! I made a huge error on those calculations! I blame it on…. Uh…. Being stupid. I used the total number of Republican delegates in one part of the calculation rather than the Democratic totals, which of course invalidates the whole thing. I suspect Sanders actually needs closer to 55% if you don’t count supers. I will redo the calculation.
Sam: OK, here goes again. I suck. Numbers that have changed bolded. The current totals are Clinton 1231, Sanders 575, O’Malley 1. If you take out supers, that becomes Clinton 771, Sanders 552. Now, there are 4765 delegates total, so you need 2383 delegates to win. But that includes superdelegates. If the assumption is that supers will go for the pledged delegate winner, then you shouldn’t count them in the total number of delegates either. Without supers there are 4048 delegates, and you need 2025 to win. Sanders therefore needs 1450 more delegates to catch up and win. Between Clinton and Sanders they have collected 1323 delegates already. So there are only 2725 pledged delegates remaining. 1450/2725 = 53.2%. This is significantly better than the 41.7% of pledged delegates Sanders has gotten so far, but it is not yet in the impossible zone by a long shot, and it is still better than where he is when you include superdelegates. Apologies for the stupid error.
Sam: I had actually checked and rechecked the calculation several times before posting it originally, but I made the same mistake every time. Sigh! Oh well!
Sam: See also this article by Andrew Prokop for more on what would be involved in a Sanders comeback. It was while reading this that I realized my error.
[Update 2016-03-10 06:45 UTC – Update in Michigan shifts 2 additional delegates from Sanders to Clinton. This does not substantially change the analysis above. In addition, the number of total “unpledged PLEOs” was adjusted in several states, giving a net addition of 1 total convention delegate.]
[Update 2016-03-11 05:29 UTC – Superdelegate update: Clinton loses one as a second superdelegate says they will just vote for the pledged delegate winner, putting them back in the uncommitted category for now.]
[Update 2016-03-12 23:50 UTC – Superdelegate update to prepare for March 12th results: Clinton +1, Sanders +1]
Note: This post is an update based on the data on ElectionGraphs.com. Election Graphs tracks both a poll based estimate of the Electoral College and a numbers based look at the Delegate Races. All of the charts and graphs seen in this post are from that site. Additional graphs, charts and raw data can be found there. All charts above are clickable to go to the current version of the detail page the chart is from, which may contain more up to date information than the snapshots on this page, which were current as of the time of this post. Follow @ElectionGraphs on Twitter or like Election Graphs on Facebook to see announcements of updates or to join the conversation. For those interested in individual general election poll updates, follow @ElecCollPolls on Twitter for all the polls as they are added.
[Edit 15:59 to fix one place I said Sanders instead of Clinton. Fixed. Thanks Jenn for pointing it out.]
[Edit 2016-03-10 21:12 UTC to fix author of Vox article I linked to.]
Sanders won Maine 16 delegates to 9 for Clinton.
In addition, further updates to Louisiana since yesterday gave Sanders 2 more delegates and Clinton 2 less.
So effectively, as 25 new delegates were added, Sanders increased his total by 18. So 72%. Way more than the 60.26% I said he needed to be on track to catch up and win. So how does that look on the big chart?
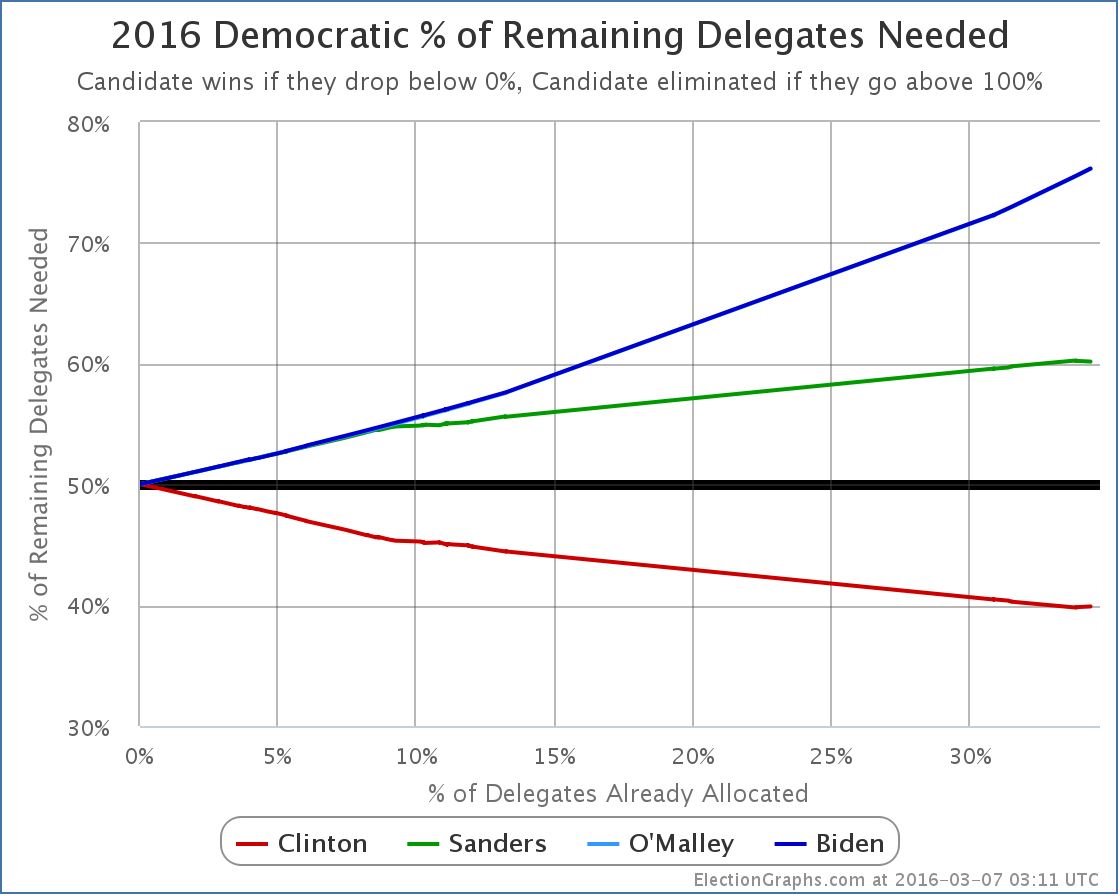
Yeah, see that little tiny change in direction at the ends of the green and red lines? That’s it.
Sanders did indeed improve his position in the race by winning Maine by a nice large margin. Yesterday he needed 60.26% of the remaining delegates to win. Today he needs… 60.17% of the remaining delegates.
Clinton of course also had a little setback. Instead of needing 39.80% of the remaining delegates, she now needs 39.90%.
Yeah, not much of a change, is it.
After the slight speed bump in Maine, Clinton’s march to the nomination continues…
Update 2016-03-09 03:19 UTC – Full superdelegate scan in preparation for adding new delegate results. Net Clinton +4, Sanders +3. Also 1 additional delegate added to the total number of delegates. This of course does not change the analysis above significantly.
Note: This post is an update based on the data on ElectionGraphs.com. Election Graphs tracks both a poll based estimate of the Electoral College and a numbers based look at the Delegate Races. All of the charts and graphs seen in this post are from that site. Additional graphs, charts and raw data can be found there. All charts above are clickable to go to the current version of the detail page the chart is from, which may contain more up to date information than the snapshots on this page, which were current as of the time of this post. Follow @ElectionGraphs on Twitter or like Election Graphs on Facebook to see announcements of updates or to join the conversation. For those interested in individual general election poll updates, follow @ElecCollPolls on Twitter for all the polls as they are added.
While we still have a live possibility of a contested convention, Donald Trump is still the Republican frontrunner and with the latest polls in Michigan, Trump weakens further against Clinton:
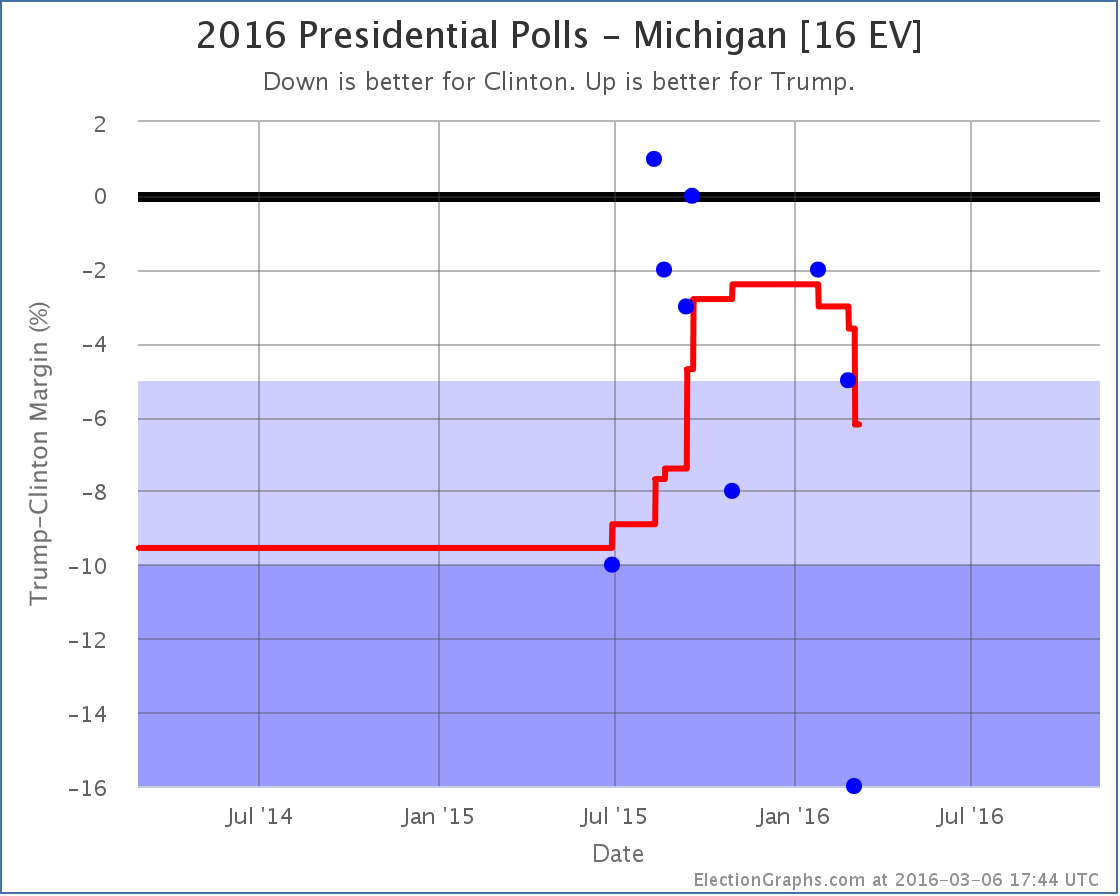
Those polls look like the long summer of Trump may be over, at least in Michigan. Trump was never leading in Michigan, but for awhile it seemed like he might make it close. The newest poll may be an outlier, no way to tell without more polling. But for now, Michigan seems like it is reverting to being a “Strong Clinton” state.
This takes Michigan out of the list of states that could easily go either way in a Clinton vs Trump general election and lower’s Trump’s best case:
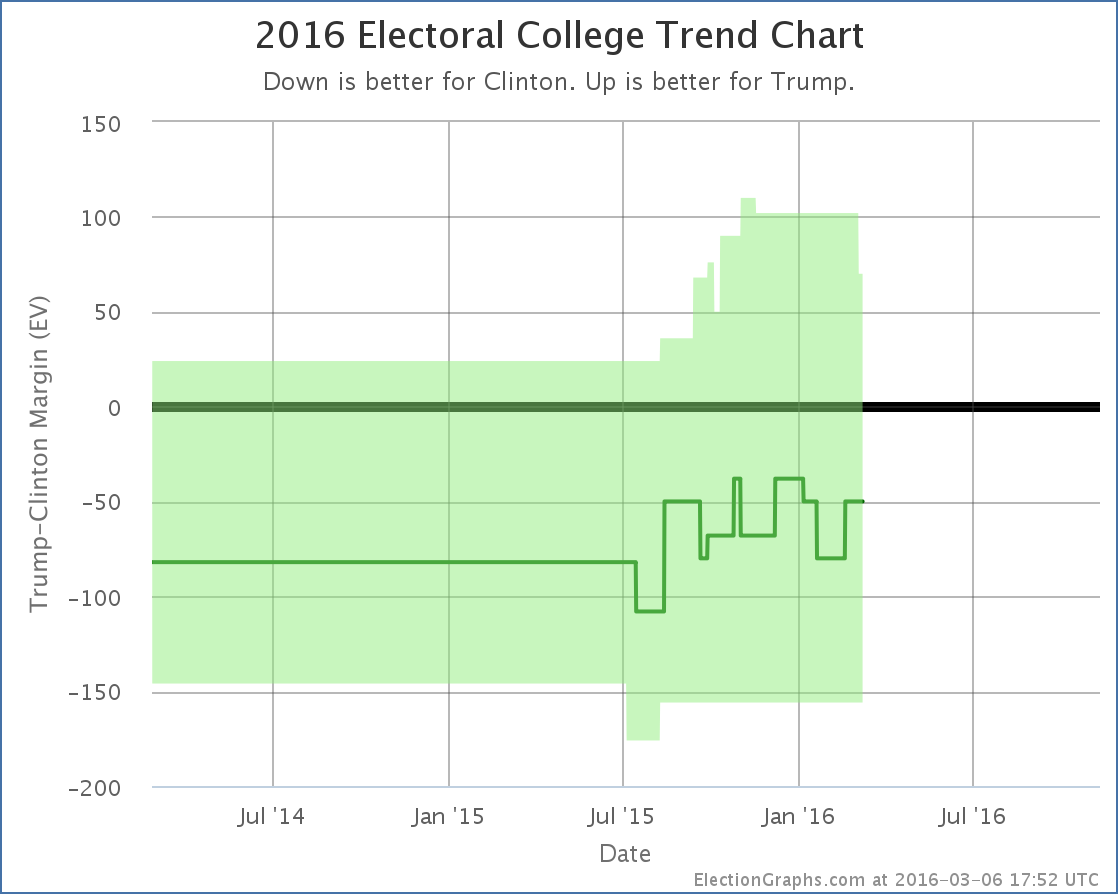
Trump’s best case drops from winning by 102 electoral votes to only winning by 70. The “expected” case remains Clinton winning by 50 electoral votes.

Looking at the spectrum of states, the “tipping point” has also changed. It used to be Michigan where before the latest poll Clinton had led by 3.6%. It is now Nevada where Clinton leads by 3.9%. This is the worst the tipping point has been for Trump since the beginning of Clinton vs Trump polling:
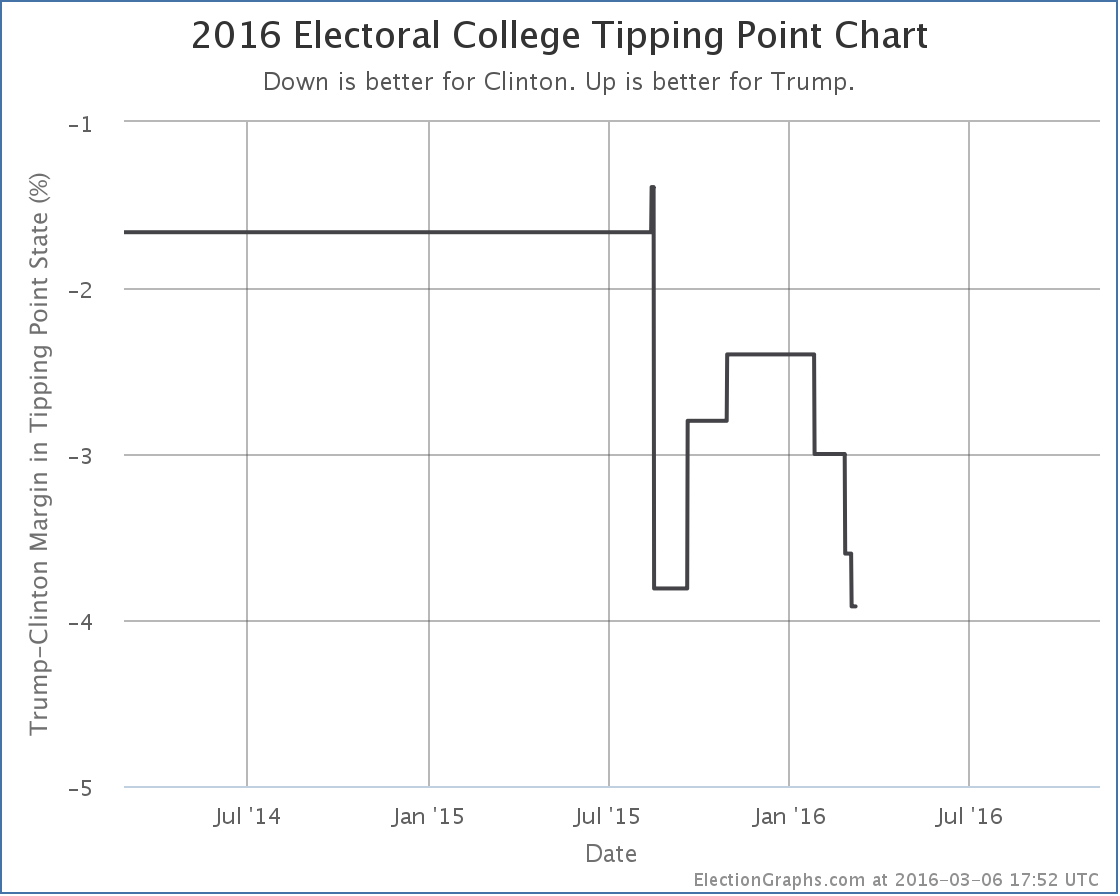
This trend is not one Trump should be happy about, but make no mistake… it is still a close race. A 3.9% lead can disappear in an instant. Just three states (Iowa, Ohio and Nevada) have to flip to make Trump the winner.
247.2 days until polls start to close. Stay tuned.
Note: This post is an update based on the data on ElectionGraphs.com. Election Graphs tracks both a poll based estimate of the Electoral College and a numbers based look at the Delegate Races. All of the charts and graphs seen in this post are from that site. Additional graphs, charts and raw data can be found there. All charts above are clickable to go to the current version of the detail page the chart is from, which may contain more up to date information than the snapshots on this page, which were current as of the time of this post. Follow @ElectionGraphs on Twitter or like Election Graphs on Facebook to see announcements of updates or to join the conversation. For those interested in individual general election poll updates, follow @ElecCollPolls on Twitter for all the polls as they are added.
Absent something really surprising happening… which you never know… could happen… the posts on the Democratic side at this point are essentially just going to be documenting Clinton’s slow but sure march to the Democratic nomination.
On March 5th if you go by states, you would see Sanders winning Kansas and Nebraska, while Clinton only won Louisiana.
Of course, states don’t matter. Delegates do. For the night, Clinton got 59 delegates and Sanders got 50.
In addition, since the post about Super Tuesday there were adjustments for finalized Super Tuesday results and new superdelegate counts. The net result was that Clinton gained an additional 22 delegates while Sanders added 13.
So total since then… Clinton +81, Sanders +63.
At the time of that last post, Clinton needed 40.52% of the remaining delegates to be on track to win. Sanders needed 59.54%.
Actual percentages since then? Clinton 56.25%, Sanders 43.75%. Clearly Clinton easily exceeded her targets, while Sanders… did not.
Actual delegate counts right now: Clinton 1127, Sanders 482, O’Malley 1.
You need 2382 delegates to win. 1610 have already been counted. There are 3153 left to be determined.
Where does that put things now?
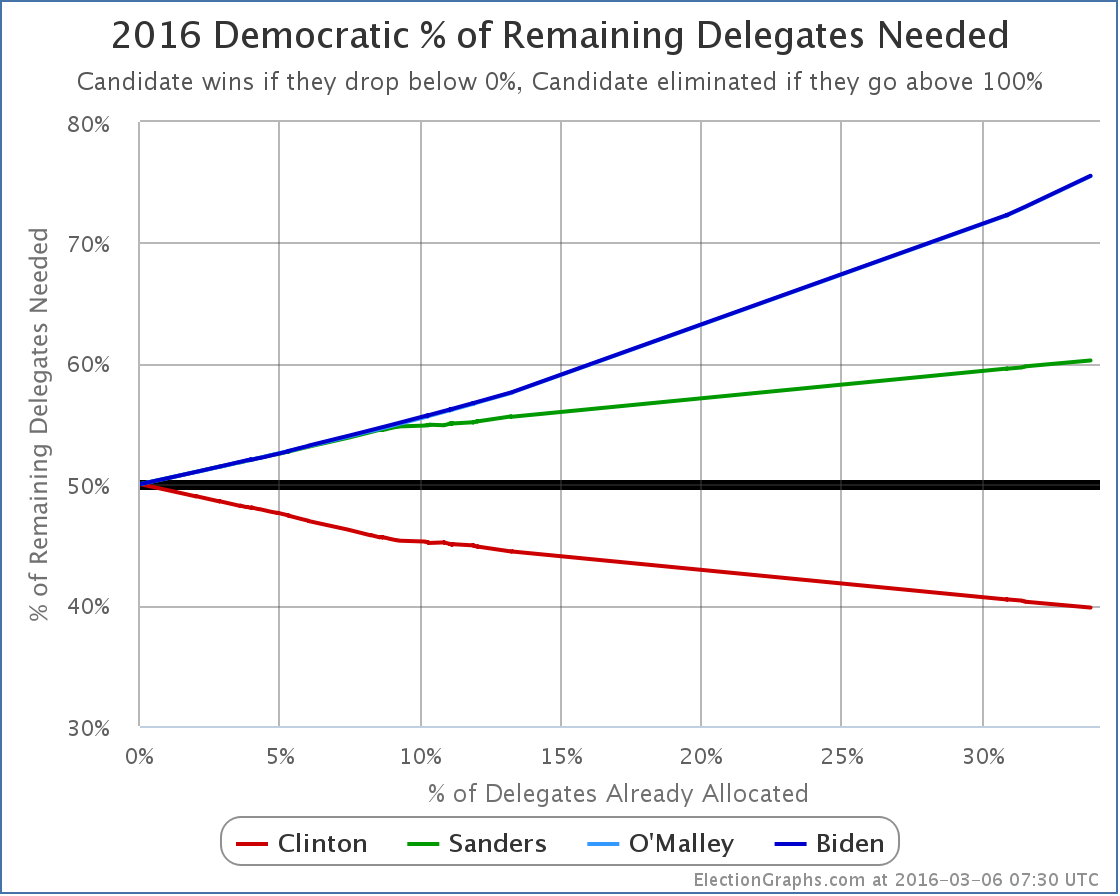
Clinton now needs only 39.80% of the remaining delegates to win.
To catch up and win, Sanders would need 60.26% of the remaining delegates.
Next up is Maine. I haven’t found any polling on Maine. It seems like it might be a good state for Sanders. But is it 60.26% good? In delegate terms that would be 16 of the 25 pledged delegates. Guess we’ll find out.
[Update 15:56 UTC: Overnight updates gave Sanders 1 additional delegate in Louisiana and Clinton 1 less. So if I’d waited until morning to post this the title would have said Clinton won 58 to 51 rather than 59 to 50. But the substance of the post remains the same.]
[Update 2016-03-07 03:07 UTC: Another update gives Sanders yet another delegate in Louisiana and Clinton yet another less. So Louisiana now Clinton 37 to Sanders 14, and March 5th contests overall Clinton 57 to Sanders 52.]
Note: This post is an update based on the data on ElectionGraphs.com. Election Graphs tracks both a poll based estimate of the Electoral College and a numbers based look at the Delegate Races. All of the charts and graphs seen in this post are from that site. Additional graphs, charts and raw data can be found there. All charts above are clickable to go to the current version of the detail page the chart is from, which may contain more up to date information than the snapshots on this page, which were current as of the time of this post. Follow @ElectionGraphs on Twitter or like Election Graphs on Facebook to see announcements of updates or to join the conversation. For those interested in individual general election poll updates, follow @ElecCollPolls on Twitter for all the polls as they are added.
Update 08:40 to add actual delegate counts, how many are left, etc.
On this week’s Curmudgeon’s Corner podcast Ivan and Sam start off talking about things OTHER than Election 2016. The upcoming small iPhone announcement, corporate reorgs, Kanye and The Pirate Bay, feedback on the show, and more! But of course then it is election time. They cover the Super Tuesday results in both parties, the Republican delegate math, the possibilities of a Republican schism, and everything else surrounding the race that they can think of.
Click below to listen or subscribe… then let us know your own thoughts!

Recorded 2016-03-03
Length this week – 1:59:20
 1-Click Subscribe in iTunes 1-Click Subscribe in iTunes
 View Podcast in iTunes View Podcast in iTunes
 View Raw Podcast Feed View Raw Podcast Feed
 Download MP3 File Download MP3 File
 Follow the podcast on Facebook Follow the podcast on Facebook
Show Details:
- (0:00:10-0:10:30) But First
- Agenda
- Small iPhone
- Mexico City
- Reorgs
- (0:11:50-0:42:03) Lightning Round
- Carillian prelude
- Apple wins a round
- Malaysian Plane
- Kanye and Pirate Bay
- Nearby House Fire
- North Korea
- Syria
- Feedback
- Sam’s Vote?
- (0:43:08-1:28:41) Election 2016 Part 1
- Democratic Super Tuesday Results
- Sanders lost, get over it
- Carson out
- Christie and Trump
- Rubio attacking Trump
- Trump’s Business Success
- Effect of Rubio’s Attacks?
- Trump Delegate Math
- Forcing a contested convention?
- Delegate Shenanagans
- Odds of President Trump?
- Trump’s Policy Details
- The Mexican Wall
- Trump and Duke/KKK
- (1:29:44-1:59:01) Election 2016 Part 2
- Never Trump Republicans
- Will the Republicans Split?
- Is Clinton more conservative than Trump?
- Trump’s Supporter’s Motivations
- Immigrant Debate
- Romney Attacks
- Trump’s Free Media
- Buying votes not working
- The Next Contests
Well, Super Tuesday is over except for a few straggling delegates that were not yet determined when it was time to start writing this post. So how did things end up? A lot of places will concentrate on “states won” and say that Clinton won 7 states and Sanders won 4. That’s well and good, but we’re going to look at what actually matters… the delegate totals.
First as a reminder, on Sunday I used current polling to predict where we would end up on delegates. Subtracting out “Delegates Abroad” which as it turns out won’t report results for a few more days, the polling suggested we would get results something like:
Estimate: 526 Clinton, 339 Sanders
And where are we actually? I’ll refrain from going through this state by state and just jump to the totals.
Actual: 504 Clinton, 335 Sanders, 26 TBD
The 26 TBD delegates are from Texas (19 delegates) and Tennessee (7 delegates). They could still split in such a way that the estimate ends up exactly correct. But even if it doesn’t, it will have been pretty close.
Bottom line is that the results are very closely in line with what would have been expected given the polling. No surprises here.
Where does that put our all important “% of remaining delegates needed to win” chart?
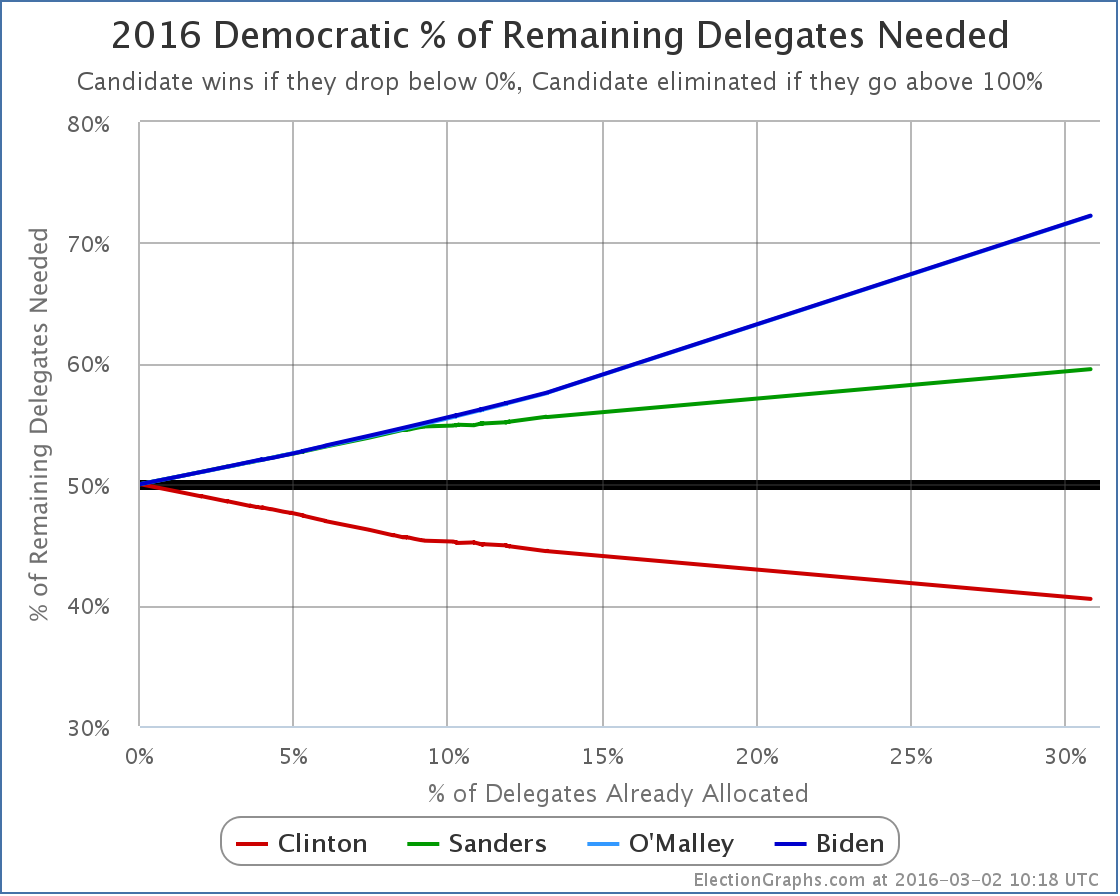
Clinton now only needs 40.52% of the remaining delegates to win the nomination. Sanders needs 59.54% of the remaining delegates to win.
Or of course large numbers of Clinton superdelegates have to start defecting to Sanders, which would raise Clinton’s number, and lower Sanders’ number. But there continues to be no sign of any such movement. And with Sanders continuing to lose the race for non-super delegates as well, it seems unlikely that a a big rush of “back the winner” movement will be heading Sanders’ way any time soon.
In the title of this post, I ask “what next?”. But even if Sanders had some “momentum” coming out of Super Tuesday (he really doesn’t) getting to 60% of the delegates in the coming contests would be a very tall order. His performance so far has been nowhere near that level. The Sanders folks may not be quite ready to admit it yet, but absent a Clinton implosion of historic proportions, the Sanders race for the nomination is over. If Sanders continues to fight on through the remaining contests, it isn’t to win, it is back to “making a point”, and “giving exposure to his issues”, and “moving the party towards him”, which was probably his original goal before he started doing a lot better than people originally expected. Those are legitimate reasons to continue a campaign. But it is not about winning the nomination.
What next? Clinton slowly but surely pushes her lead until she has 2,382 delegates and wins the nomination.
Before closing up, just a quick comparison:
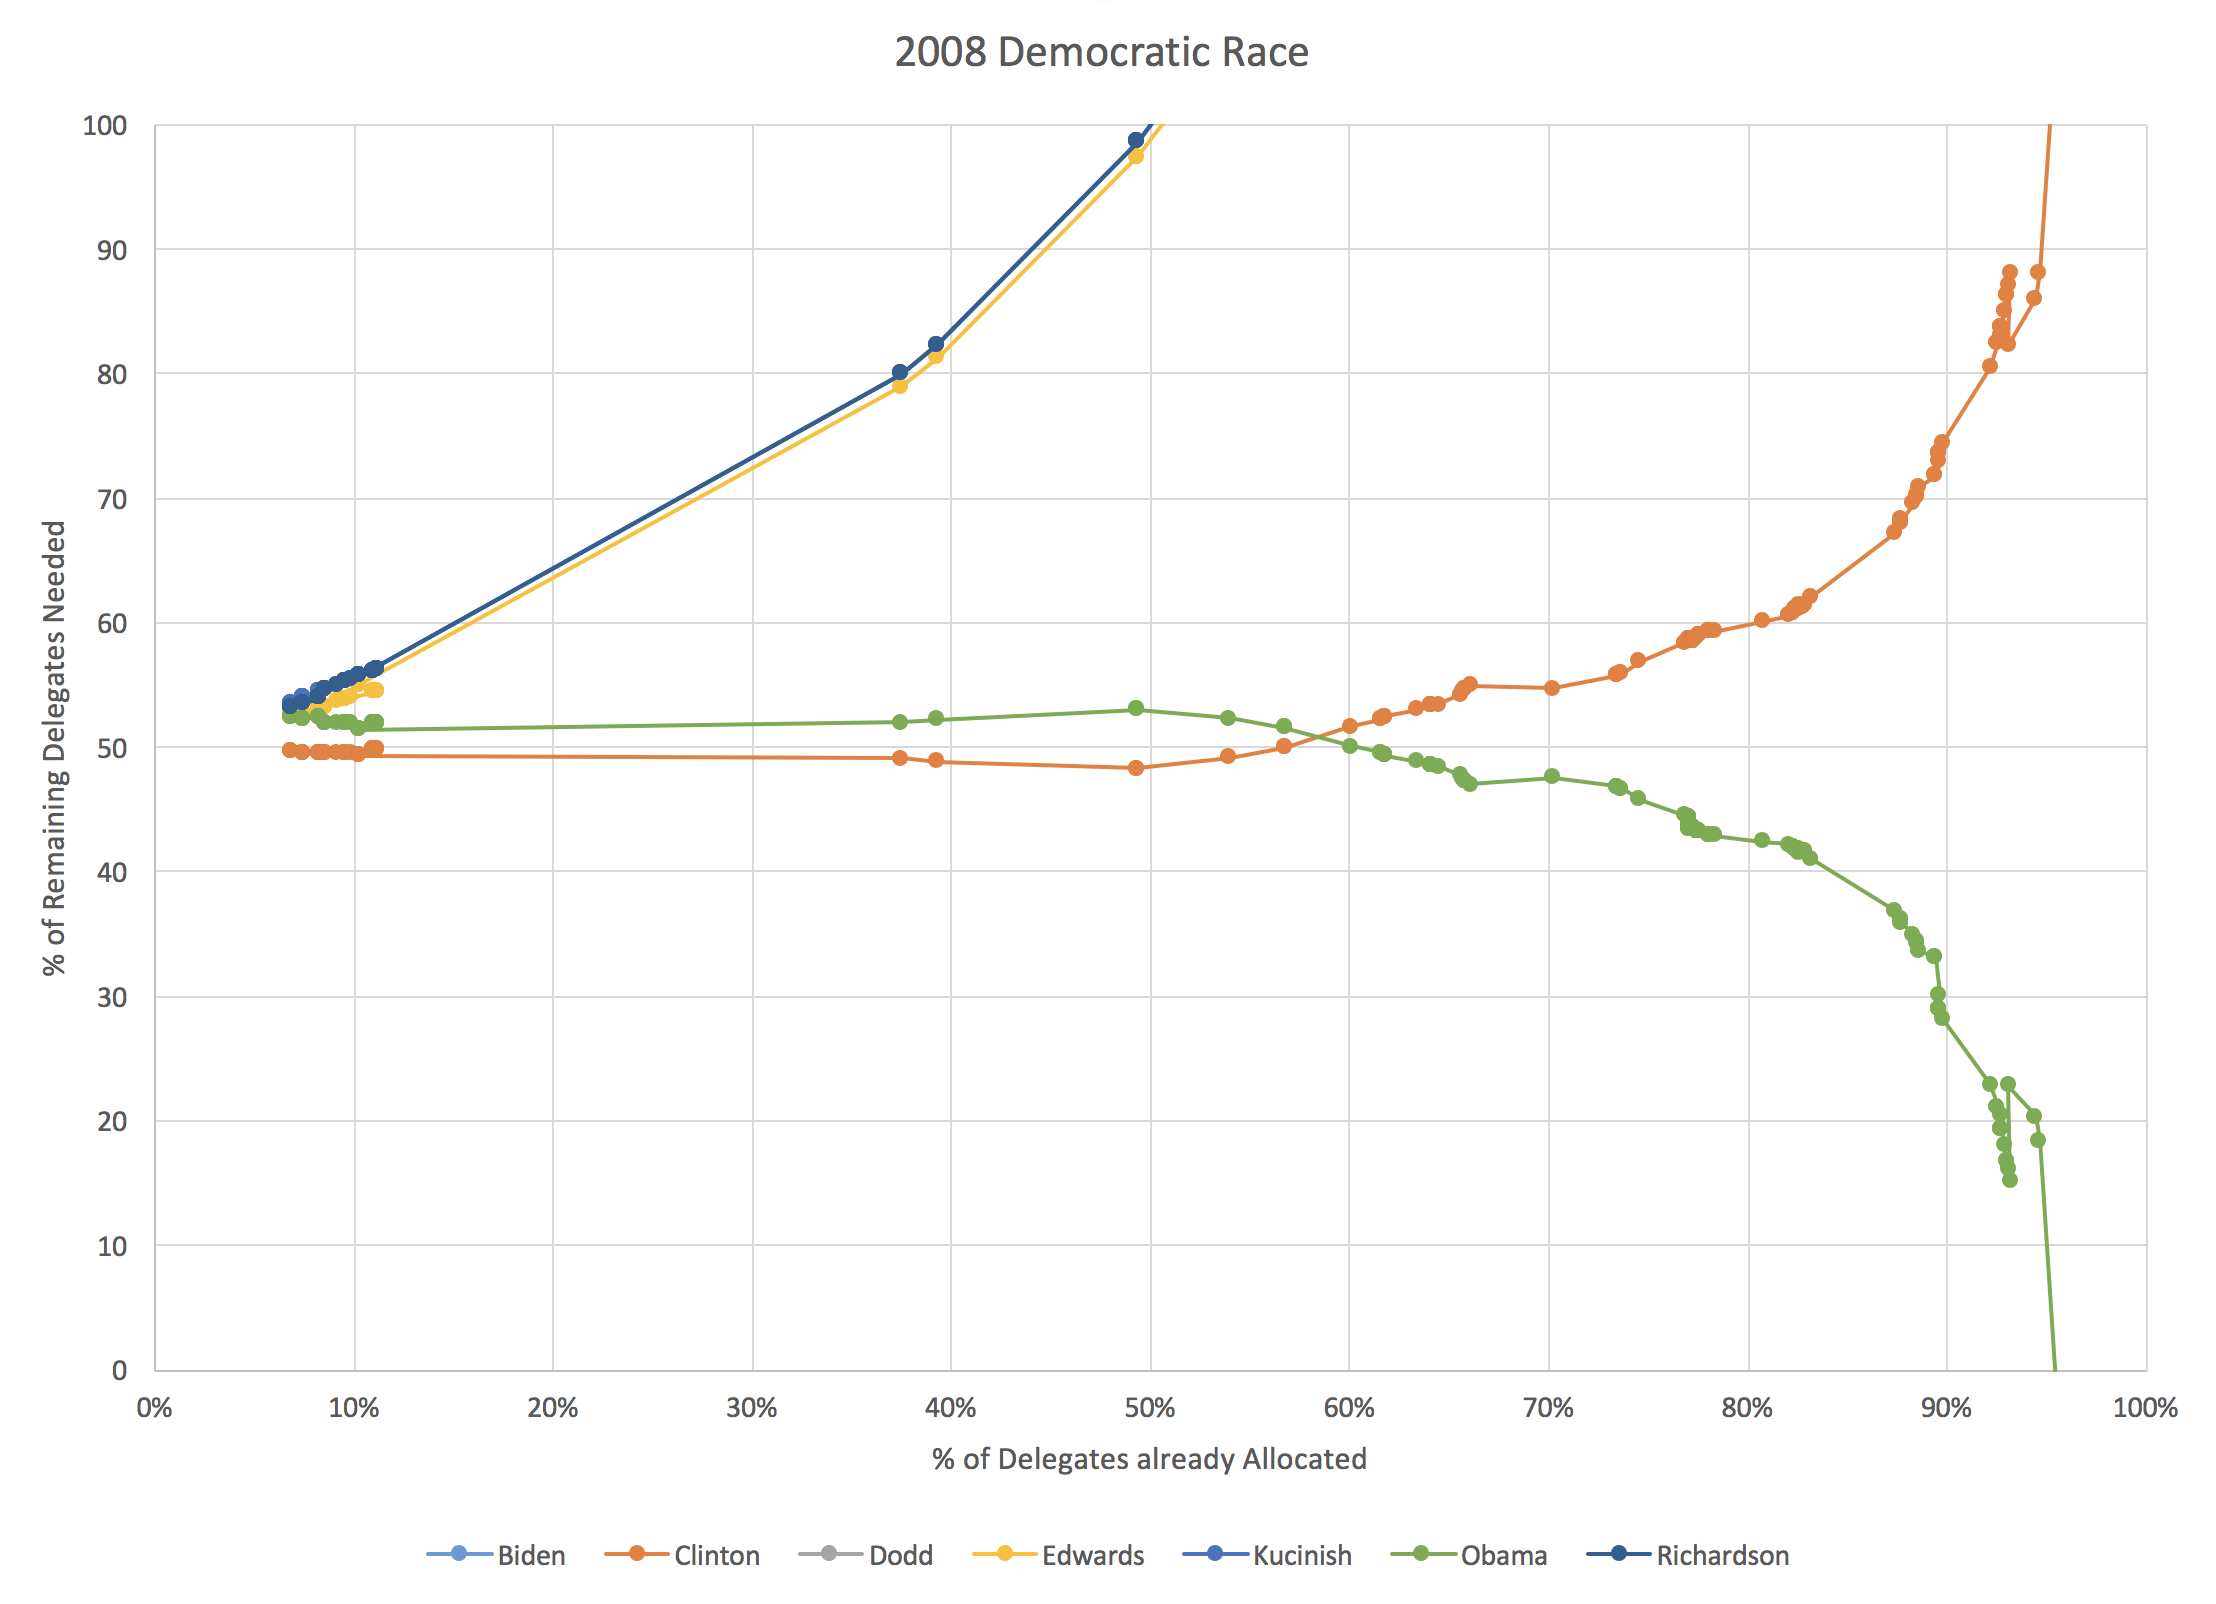
Although I didn’t produce the chart in exactly the same form when I did the analysis in 2008, a few minutes in Excel with the old data produced the equivalent chart for 2008. It is interesting to compare where we are.
First of all, at just over 30% of the delegates allocated, Clinton was still ahead in 2008! But it was much closer than things are today. She needed about 49% of the remaining delegates to win, compared to only needing about 41% today. Obama needed about 52% of the remaining delegates to catch up and win. Which he obviously did. At that point he already had about 47% of the delegates that were already allocated though… while Sanders only has about 29% of the delegates. (Both 2008 and 2016 numbers of course include superdelegates.) So while Obama was able to mount a come from behind win from this point in the delegate race, Sanders is far far behind where Obama was.
Sanders is now approximately where Clinton was when about 80% of the delegates had been determined. In 2008, that was in late April. The media was still talking about the Clinton/Obama race at that point, and hyping up increasingly outlandish scenarios where Clinton could still win, because a race is more interesting than having a clear winner, but anybody watching the numbers knew it was over at that point absent a catastrophic event.
In any case, back here in 2016, I will of course continue to watch the races and post updates after each contest. If a major event happens that changes everything and puts Sanders back on track to win you will see it here. Absent that though, we’re just going to be watching Clinton’s slow march toward mathematically clinching the nomination.
[Update 2016-03-03 02:17 UTC – Update on super Tuesday delegates. The 7 TBD delegates in Tennessee broke 6 for Clinton, 1 for Sanders. The 19 TBD delegates in Texas broke 12 for Sanders, 7 for Clinton. In addition in Minnesota the estimates were adjusted to give one less delegate to Sanders, and one more to Clinton. Net for this round of updates: Clinton +14, Sanders +12, bringing totals to Clinton 1060, Sanders 431, O’Malley 1. This does not substantively change the analysis above.]
[Update 2016-03-04 02:51 UTC – Superdelegate update: Net Clinton +2]
[Update 2016-03-05 16:41 UTC – Superdelegate update: Net Clinton +6]
[Update 2016-03-06 07:30 UTC – Final superdelegate update prior to results from March 6th states: Net Sanders +1]
Note: This post is an update based on the data on ElectionGraphs.com. Election Graphs tracks both a poll based estimate of the Electoral College and a numbers based look at the Delegate Races. All of the charts and graphs seen in this post are from that site. Additional graphs, charts and raw data can be found there. All charts above are clickable to go to the current version of the detail page the chart is from, which may contain more up to date information than the snapshots on this page, which were current as of the time of this post. Follow @ElectionGraphs on Twitter or like Election Graphs on Facebook to see announcements of updates or to join the conversation. For those interested in individual general election poll updates, follow @ElecCollPolls on Twitter for all the polls as they are added.
[Edit 16:44 UTC to actually answer the “What’s next?” from the title.]
Yeah yeah, Super Tuesday. Yeah, yeah, all the other states coming right afterwards. But we have new general election polls!
Since my last update there have been new polls in Michigan, New Hampshire and Kansas. From all of this, two major candidate pairs had changes to their summary status on my site. And this time, that includes the frontrunners:
Clinton vs Trump
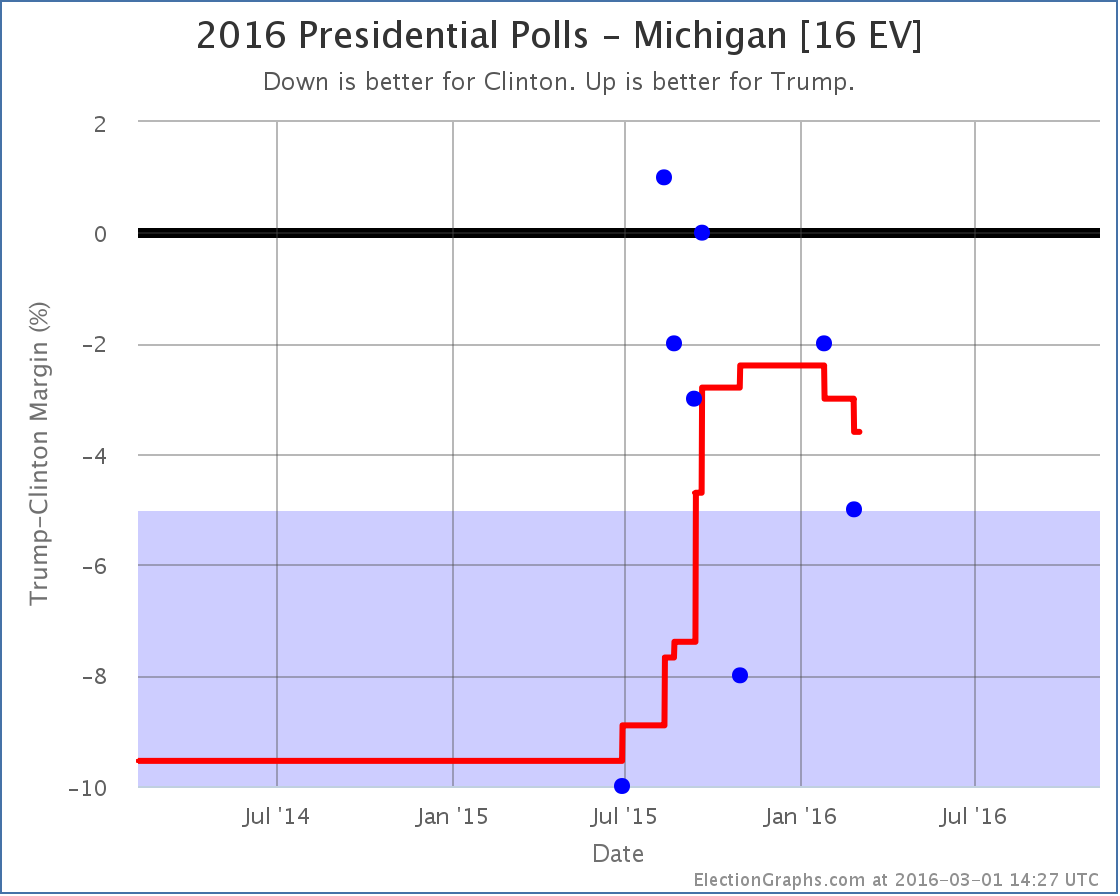
The categorization of Michigan did not change. “Weak Clinton” before, “Weak Clinton” now. But Michigan was the tipping point in Clinton vs Trump, so when Michigan moves, so does the tipping point:
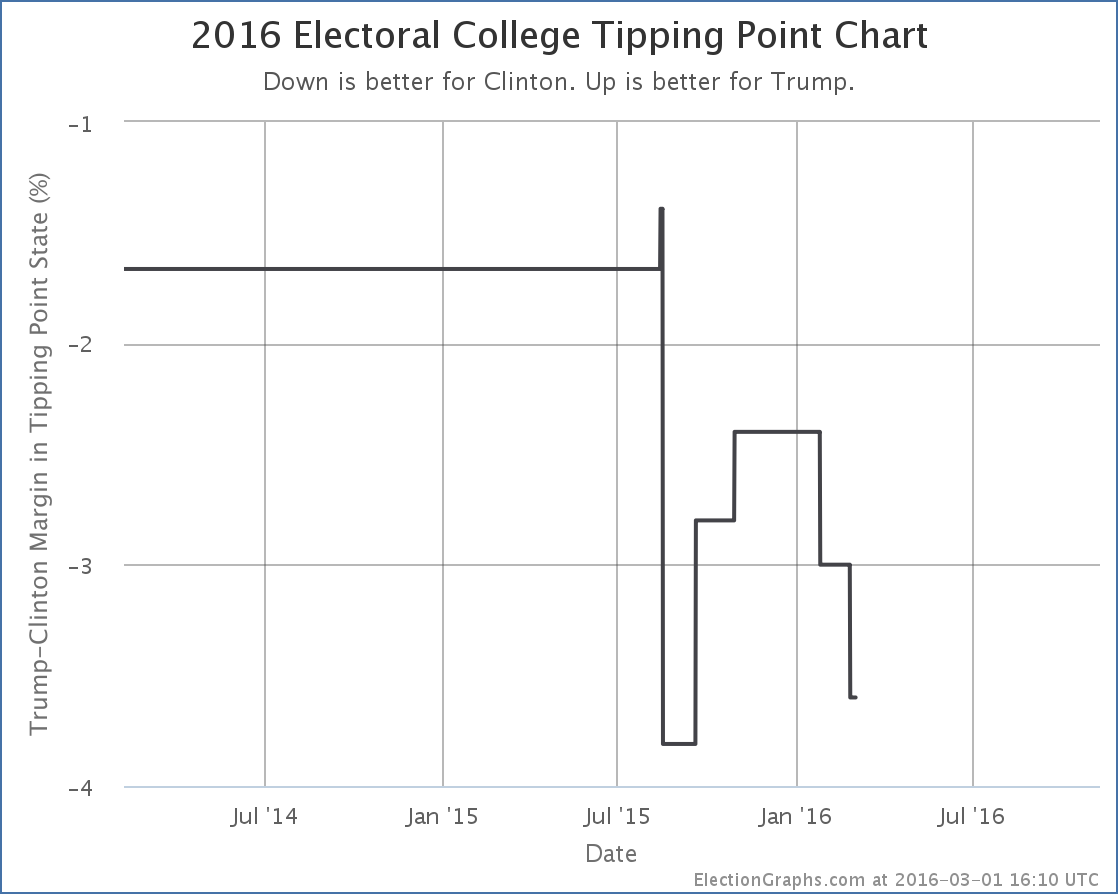
The tipping point moves from a 3.0% Clinton lead in Michigan to a 3.6% Clinton lead in Michigan. Either way, 3.6% is still a narrow lead. Only 1.3% of people changing their minds, or undecideds flipping the right way, would put Trump in the lead. The question is if we are now in a trend away from Trump in this metric, or if we are just bouncing around in a range as new polls jitter the averages. Too soon to tell. But once the primary races are both settled to the point where it is hard to deny the winners are the winners, we will start seeing an acceleration of general election polling, and we should start to see if there are really any trends here.
Clinton vs Rubio
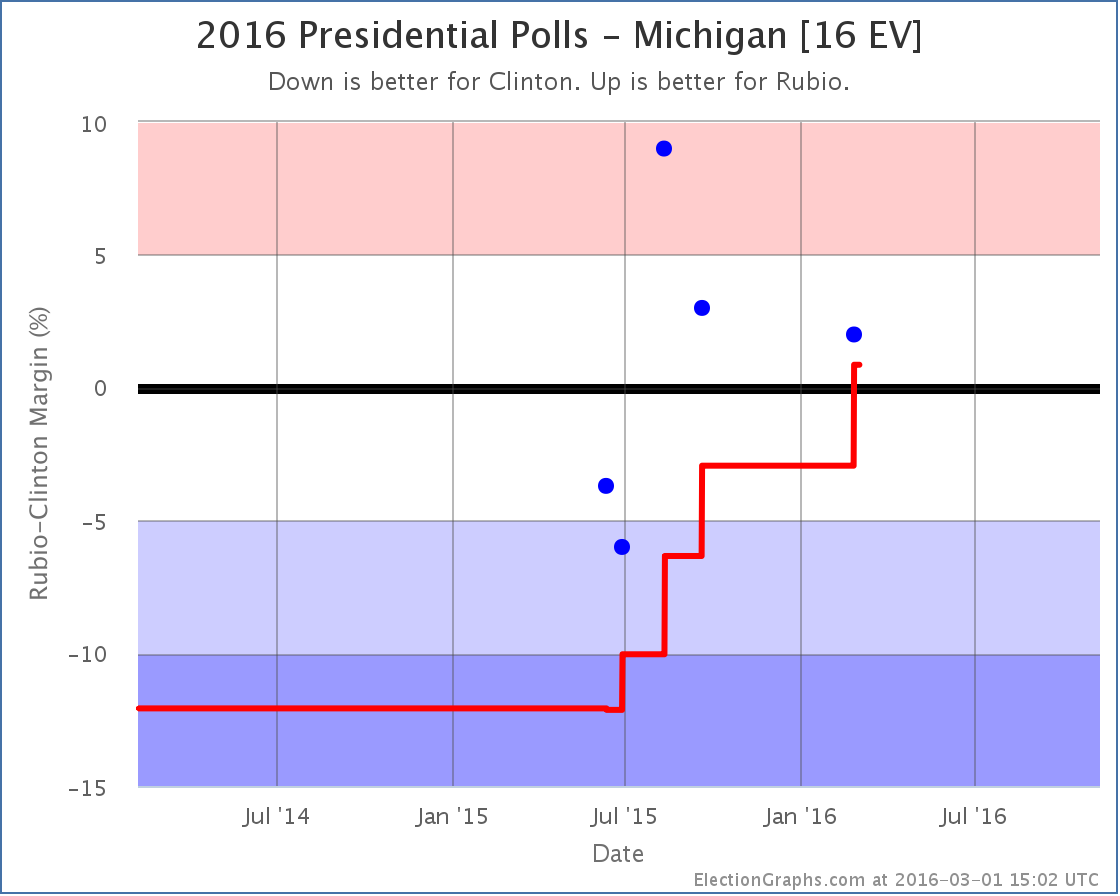
With the latest Michigan poll, Rubio leads in the poll average, which now shows a 0.9% Rubio lead. This moves Michigan from “Weak Clinton” to “Weak Rubio”. It is a close state that could easily go for either candidate, but with this change we move Michigan’s 16 electoral votes into Rubio’s column for the “expected” case where each candidate wins every state they are ahead in.
The move is extra significant this time because it actually puts Rubio over the top to win the whole shebang:
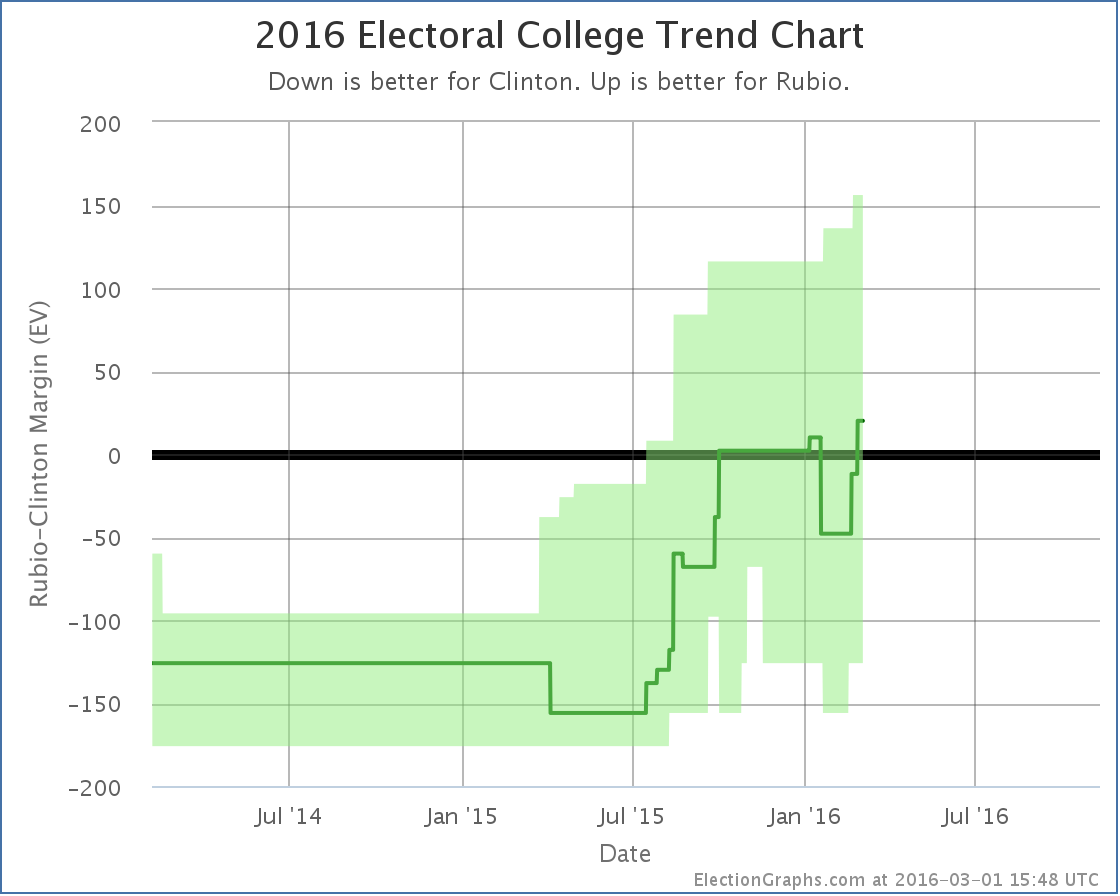
With this, the range of possible outcomes that seem reasonably possible is still everything from Clinton winning by 126 to Rubio winning by 156, but the expected result is now a Rubio win by 20 electoral votes.
This is also reflected in the tipping point:
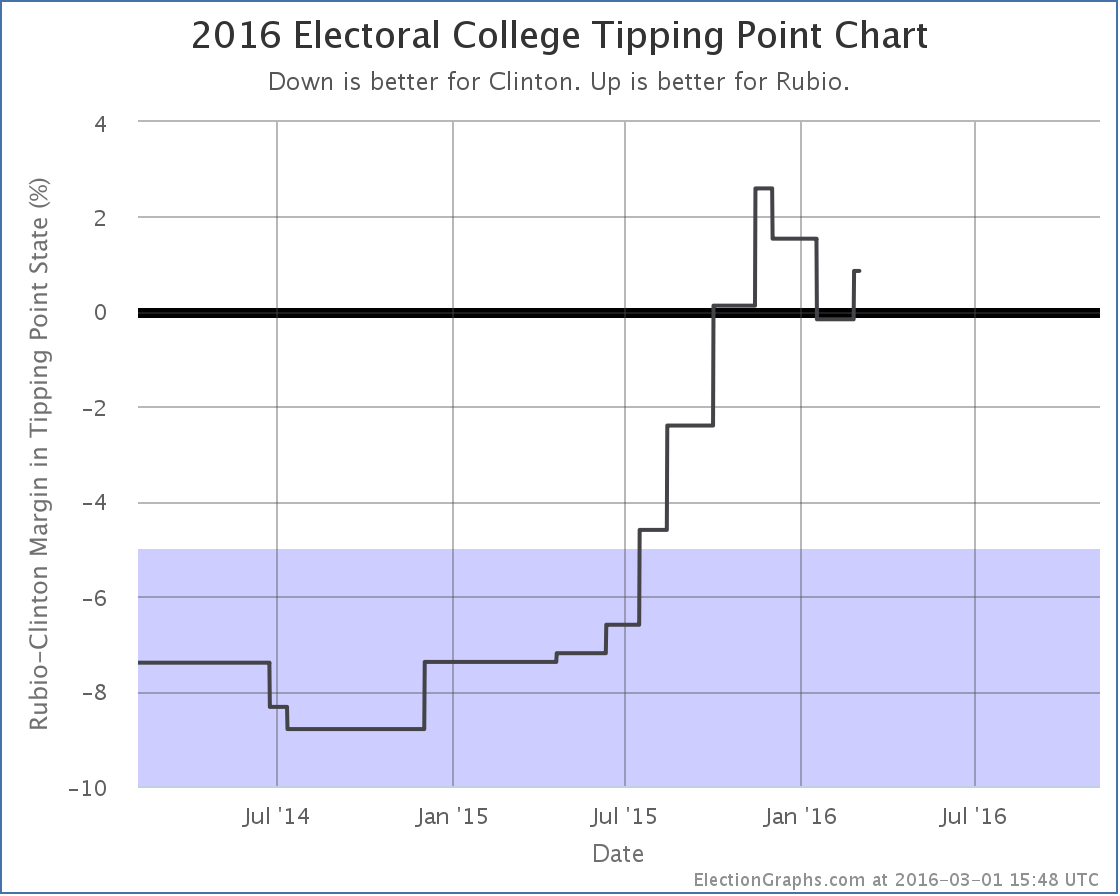
The tipping point moves from Florida, where Clinton led by 0.8%, to Michigan where Rubio is now ahead by 0.9%.
Clinton vs Rubio remains a very close race. But Rubio now has a small advantage.
Others
Clinton vs Kasich is neither a front-running pair, or in the top five best polled combinations, so I won’t consider it fully here other than to note that the latest New Hampshire poll moved Kasich into the lead, changing his expected case from losing to Clinton by 46 electoral votes, to losing to Clinton by 38 electoral votes.
252.2 days until polls start to close on Election 2016.
Note: This post is an update based on the data on ElectionGraphs.com. Election Graphs tracks both a poll based estimate of the Electoral College and a numbers based look at the Delegate Races. All of the charts and graphs seen in this post are from that site. Additional graphs, charts and raw data can be found there. All charts above are clickable to go to the current version of the detail page the chart is from, which may contain more up to date information than the snapshots on this page, which were current as of the time of this post. Follow @ElectionGraphs on Twitter or like Election Graphs on Facebook to see announcements of updates or to join the conversation. For those interested in individual general election poll updates, follow @ElecCollPolls on Twitter for all the polls as they are added.
As expected, Clinton easily won South Carolina. Clinton won 39 delegates, Sanders got 14.
Since my last post on the Democrats the tally has also added a net 10 superdelegates for Clinton, 1 for Sanders, and 1 straggler for O’Malley.
As of that last post, Sanders needed to get more than 55.03% of delegates to be on track to catch up with Clinton and win. Obviously that hasn’t happened with these updates. He got 23.08% of the delegates since that post.
So the end result is that the percentage of the remaining delegates Sanders needs to win goes up, while that number for Clinton goes down:
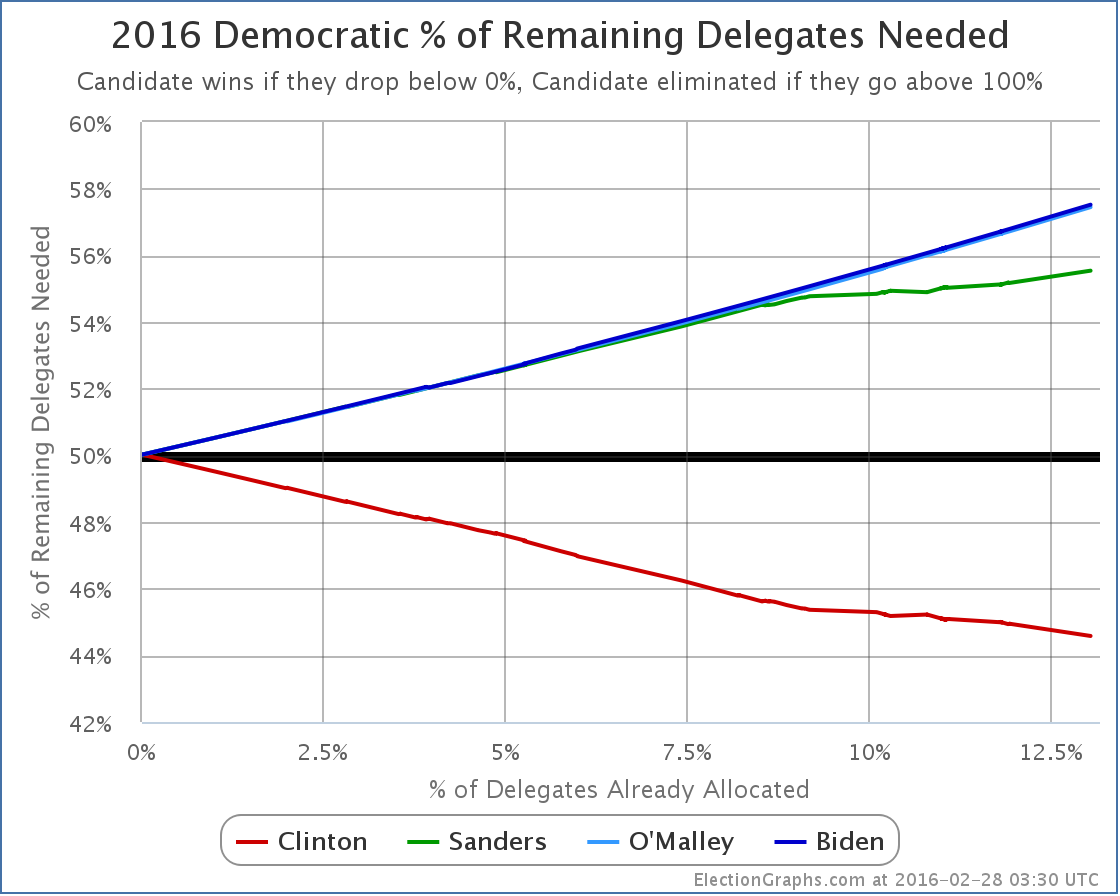
South Carolina is that slight acceleration of the curves starting at about 11.9%.
Sanders now needs 55.54% of the remaining delegates to catch up and win. (Or less if he starts flipping Clinton superdelegates to his side, but there has been no sign of that yet.)
Meanwhile, Clinton only needs 44.58% of the remaining delegates to win.
Frankly, in the 2008 and 2012 cycles once the frontrunner needed less than 45% of the delegates to win, it was time to start calling the race over. Yes, something happening that would allow a challenger to catch up and win is still possible. But it is unlikely. And with each additional contest where the challenger fails to make their own “% needed to win” mark, it gets harder.
But lets not consider it done quite yet. Super Tuesday is coming up in a few days. Maybe there is something there to indicate this isn’t over quite yet. Just as I did for the Republicans, lets game out what Super Tuesday looks like based on current polling. I’ll use the RCP poll averages, then try to estimate delegates based on the rules in each state.
Texas (222 delegates)
- Current poll averages: 59.9% Clinton, 33.6% Sanders
- Delegate estimates: 142 Clinton, 80 Sanders
Georgia (102 delegates)
- Current poll averages: 62.8% Clinton, 26.0% Sanders
- Delegate estimates: 72 Clinton, 30 Sanders
Virginia (95 delegates)
- Current poll averages: 54.5% Clinton, 35.0% Sanders
- Delegate estimates: 58 Clinton, 37 Sanders
Massachusetts (91 delegates)
- Current poll averages: 46.3% Sanders, 45.7% Clinton
- Delegate estimates: 46 Sanders, 45 Clinton
Minnesota (77 delegates)
- Current poll averages: 54.5% Clinton, 28.5% Sanders
- Delegate estimates: 51 Clinton, 26 Sanders
Tennessee (67 delegates)
- Current poll averages: 53.0% Clinton, 30.0% Sanders
- Delegate estimates: 43 Clinton, 24 Sanders
Colorado (66 delegates)
- Last poll from November so using national averages: 47.2% Clinton, 42.2% Sanders
- Delegate estimates: 35 Clinton, 31 Sanders
Alabama (53 delegates)
- Using only poll from February: 59% Clinton, 31% Sanders
- Delegate estimates: 35 Clinton, 18 Sanders
Oklahoma (38 delegates)
- Current poll averages: 45.0% Clinton, 36.0% Sanders
- Delegate estimates: 21 Clinton, 17 Sanders
Arkansas (32 delegates)
- Current poll averages: 57.0% Clinton, 28.5% Sanders
- Delegate estimates: 21 Clinton, 11 Sanders
Vermont (16 delegates)
- Current poll averages: 84.5% Sanders, 9.5% Clinton
- Delegate estimates: 16 Sanders
Democrats Abroad (13 delegates)
- No polls, using national averages: 47.2% Clinton, 42.2% Sanders
- Delegate estimates: 7 Clinton, 6 Sanders
American Samoa (6 delegates)
- No polls, using national averages: 47.2% Clinton, 42.2% Sanders
- Delegate estimates: 3 Clinton, 3 Sanders
OK. Adding all those up…
533 Clinton, 345 Sanders
Now, these are estimates based on relatively sparse polling and the assumption that candidate support is uniformly distributed within each state. The results will not be exactly like this.
But unless something major happens to change the picture in the next couple of days, the results on Tuesday should look broadly similar to this. With the estimate above, Sanders gets about 39.3% of the delegates. A far cry from the 55.5% he would need in order to actually improve his position against Clinton.
Adding the current delegates to the estimated Super Tuesday delegates, the new totals would be:
1,069 Clinton, 427 Sanders, 3 O’Malley
31.5% of the delegates will have been allocated. But 68.5% would still be available.
What would Sanders’ new “% of remaining needed to win” be at that point?
It would be 59.9%.
Sanders would need nearly 60% of the remaining delegates to catch up and win, or a massive defection of Clinton superdelegates to lower that number.
To imagine Sanders performing like this, you either have to believe the remaining states are vastly different in their preferences to the states that will have gone before (there is no evidence for this so far), or some massive seismic event would have to happen in the campaign to dramatically change minds of large numbers of Democratic voters in a very short timeframe.
A good argument could be made that absent a shocking surprise, this race is already done. After Super Tuesday, if the results are anything like the estimates above, then those hoping for a Sanders win will be grasping at the thinnest of straws. By the time we get to the end of March, again, absent that huge surprise, there will be no serious question any more.
Now, surprises do sometimes happen. You never know. But you don’t get to a Sanders win from here with just “normal” campaigning. It would take something bigger… a major Clinton scandal bigger than anything seen so far… a serious issue with Clinton’s health… something along those lines.
This doesn’t preclude Sanders staying in the race all the way until the convention and battling in every primary and caucus. He could do that if his cash flow holds out. But it would be to champion his issues and to try to move the party further in his direction, it would not be a serious attempt to win the nomination.
Three days from the time I post this, we’ll have Super Tuesday results and we’ll see just how close my poll based guestimates were and if this analysis holds up. More then…
[Update 2016-03-02 00:47 UTC – As a result of a final scan for superdelegates prior to adding Super Tuesday results we have a net change of +7 Clinton superdelegates, +2 Sanders superdelegates, -2 O’Malley superdelegates (they flipped to Clinton). This does not substantively change any of the analysis above and does not get a separate blog post, but a note here was warranted.]
Note: This post is an update based on the data on ElectionGraphs.com. Election Graphs tracks both a poll based estimate of the Electoral College and a numbers based look at the Delegate Races. All of the charts and graphs seen in this post are from that site. Additional graphs, charts and raw data can be found there. All charts above are clickable to go to the current version of the detail page the chart is from, which may contain more up to date information than the snapshots on this page, which were current as of the time of this post. Follow @ElectionGraphs on Twitter or like Election Graphs on Facebook to see announcements of updates or to join the conversation. For those interested in individual general election poll updates, follow @ElecCollPolls on Twitter for all the polls as they are added.
Yes, all the attention is on South Carolina and Super Tuesday, but time for a quick electoral college update from recent poll updates. In the last batch of polls were new matchup results in Florida, Georgia, Wisconsin and West Virginia. These resulted in a few notable changes.
Clinton vs Trump
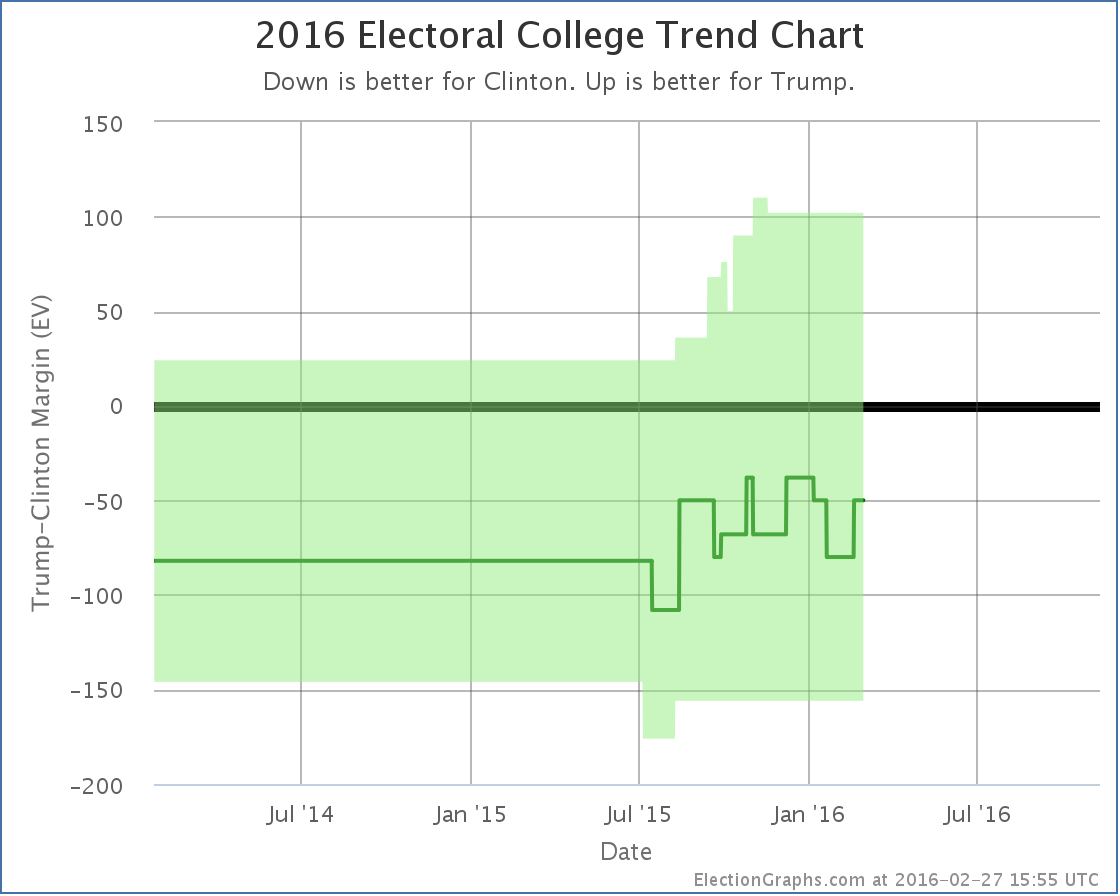
Well, actually, once again there was no significant update in the Clinton vs Trump race, but in this transitional phase where we are still getting polling for folks other than the frontrunners, I’ll mention the frontrunner status when there is a post highlighting changes with other candidate pairs. Trump’s lead in the average in Georgia actually dropped from 10.1% to 9.5% changing Georgia from “Solid Trump” to “Strong Trump” in my categorization, but this really doesn’t make any difference. Georgia isn’t in play at the moment. The situation remains that anything from Clinton winning by 156 to Trump winning by 102 is within the realm of the possible, and Clinton winning by 50 is the “expected” result if all the states go where their averages are currently pointing.
Clinton vs Cruz
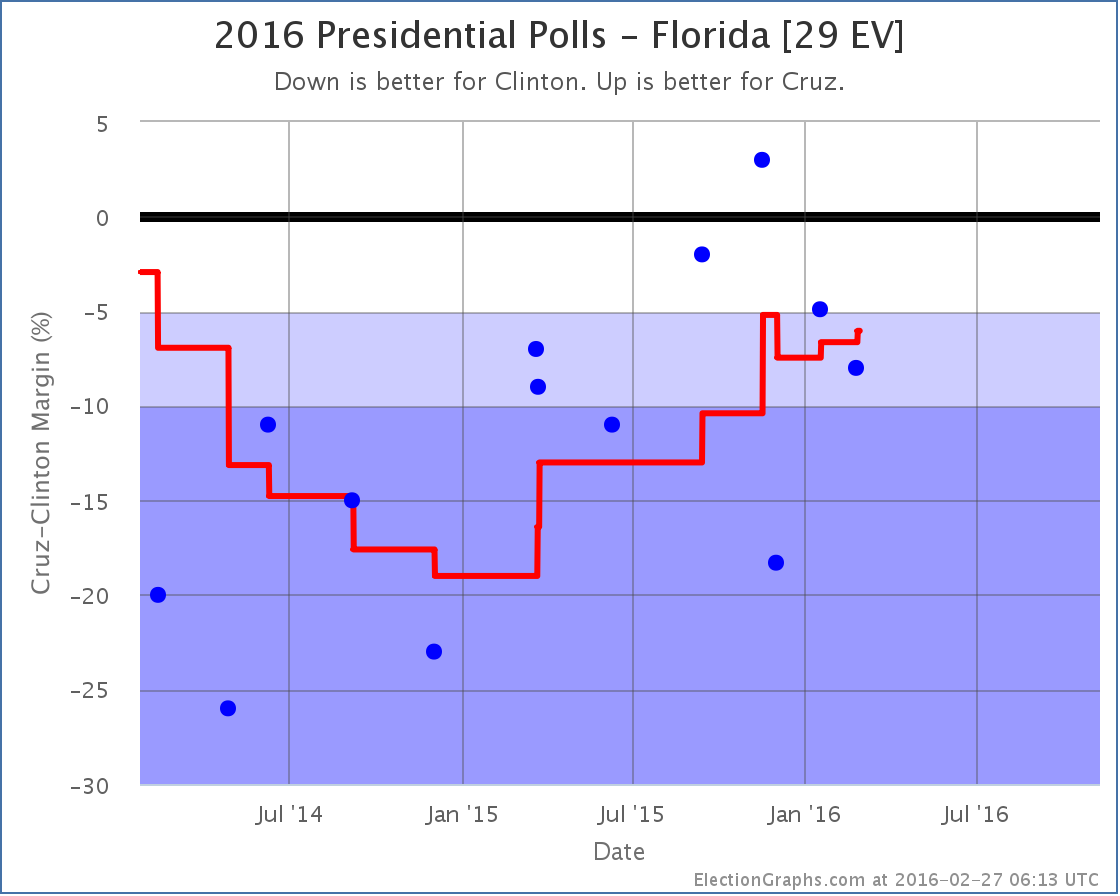
Cruz improves a bit in Florida against Clinton, but not enough to change categories. Florida was however the tipping point state, so this also moves:
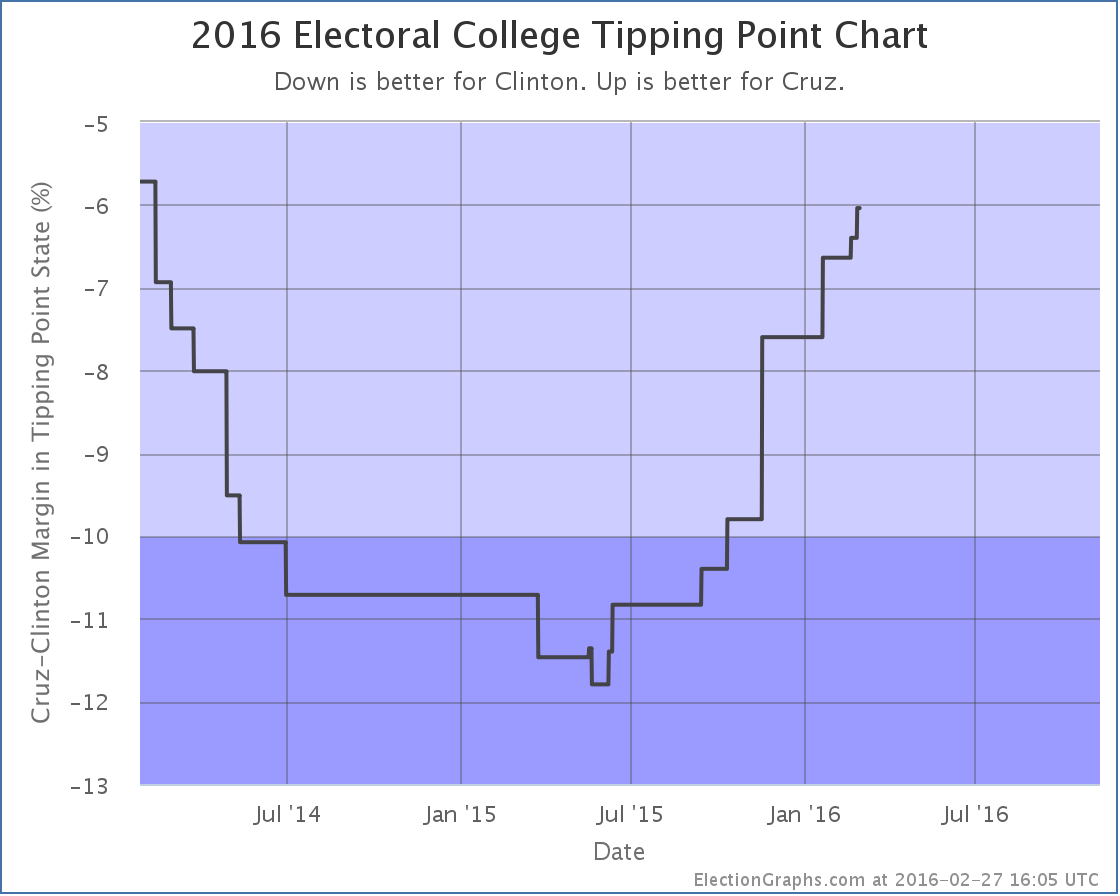
Cruz’s upward tipping point trend continues. Just a little bit further, and the Clinton vs Cruz race might actually look competitive!
(Reminder, the tipping point represents the margin in the state that would put the winner “over the top” if you ranked the states by their candidate preference. It is a good measure of how much the candidate who is behind would have to change national public opinion to flip the result and win.)
Clinton vs Rubio
This matchup had notable changes caused by the polls in two different states. First up, Florida:
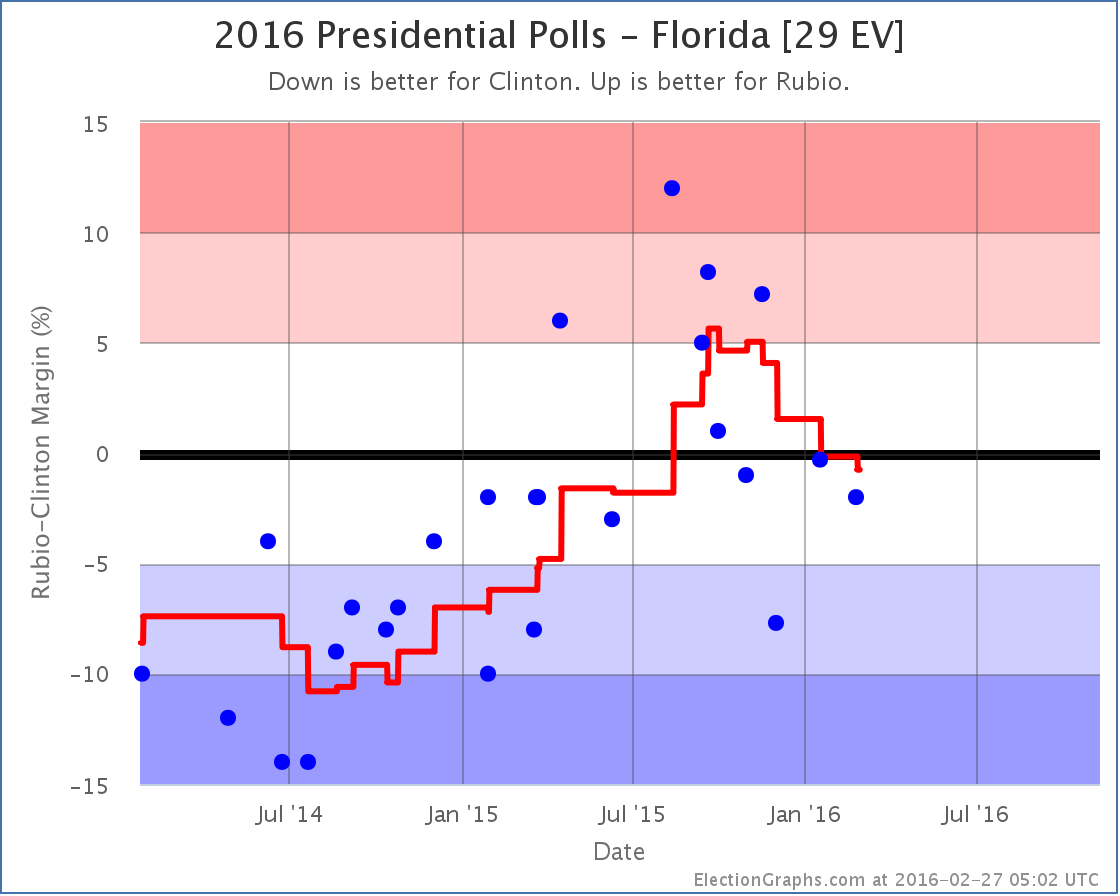
The state didn’t change status. It was “Weak Clinton” before, and remains “Weak Clinton”. But as with Cruz, Florida was the tipping point state, and so the tipping point changes as well.
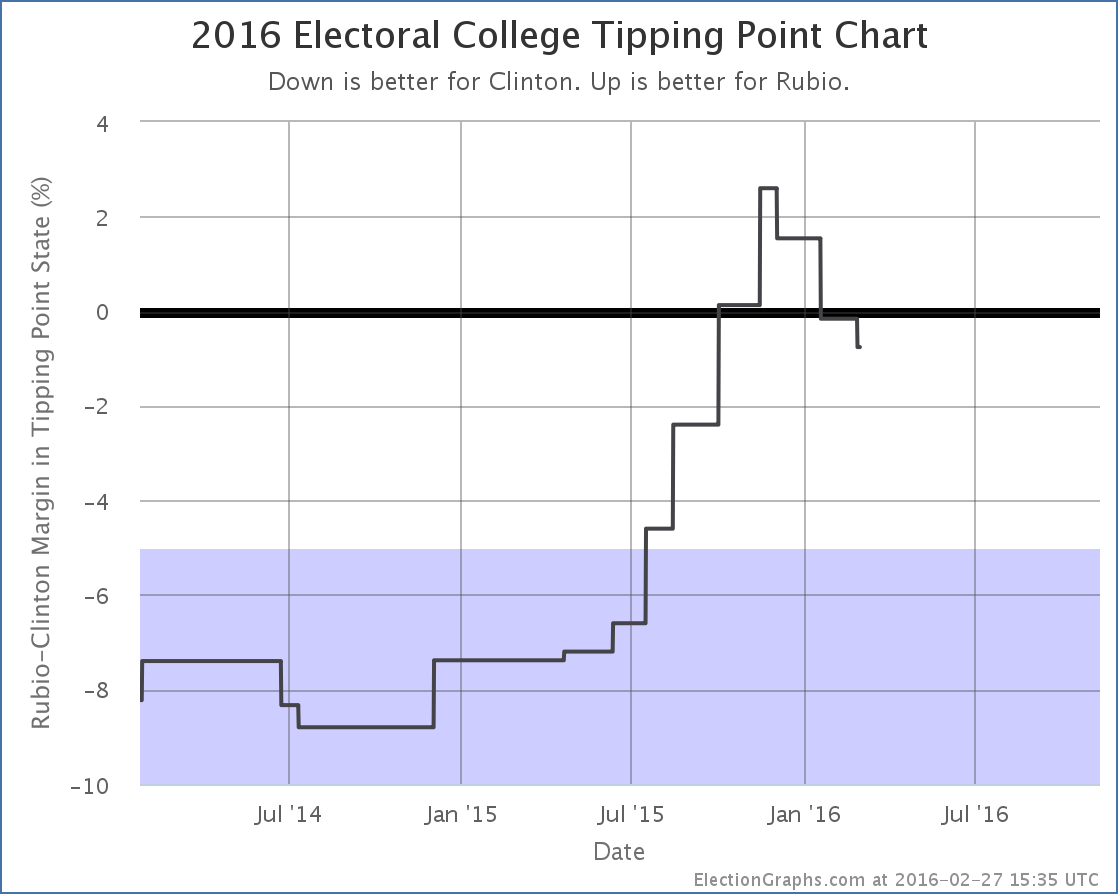
By this metric Rubio peaked in November and has been declining ever since. A Clinton vs Rubio matchup still looks incredibly close though. Clinton is only ahead here by 0.8%.
So this was good for Clinton. But there was also a change in Wisconsin that was good for Rubio:
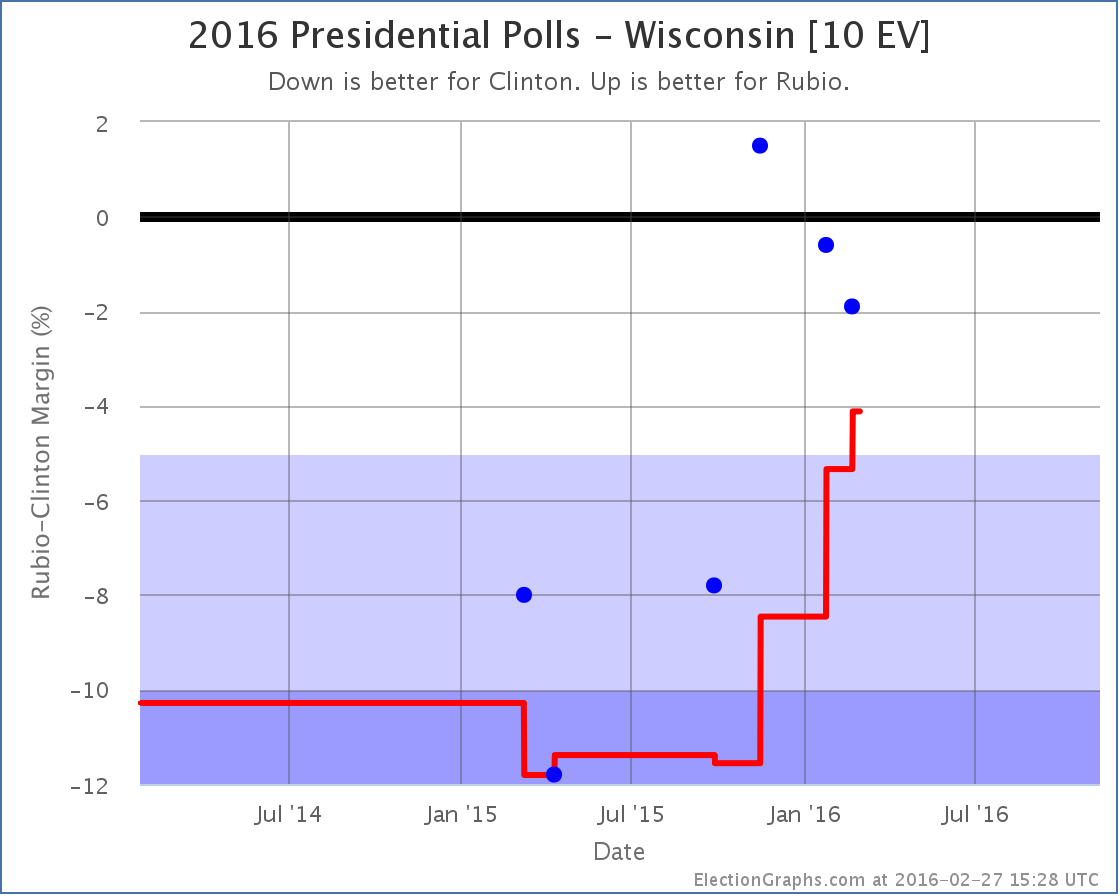
All the recent polls have shown Wisconsin as a close state, whereas older polls had it Strong or Solid Clinton, and therefore the average has been moving up toward Rubio. With today’s update, it moves from “Strong Clinton” to “Weak Clinton”. This puts it in play for Rubio and improves his best case:
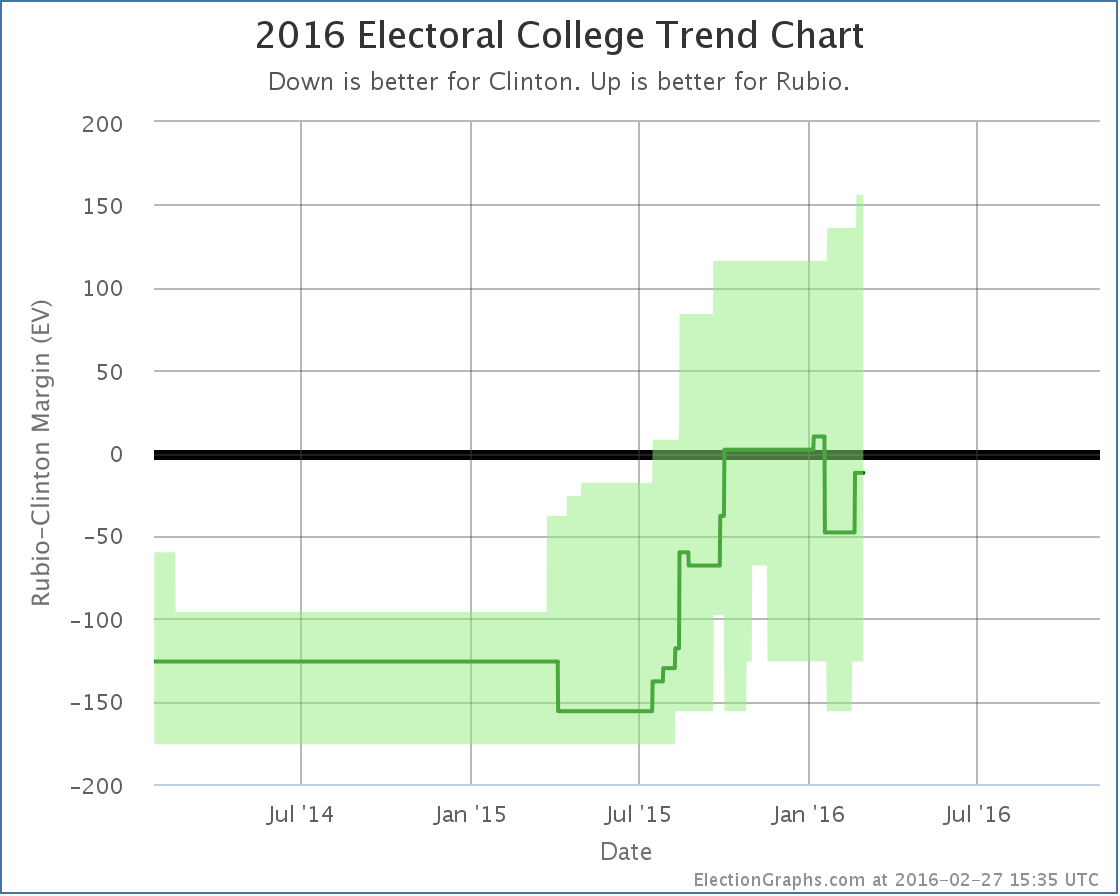
There are now ELEVEN close states in the Clinton vs Rubio contest, accounting for 141 electoral votes, which is quite a swing! Everything from Clinton by 126 to Rubio by 156 is now “in the bubble”. Clinton remains a slight favorite, winning by 12 electoral votes if all the states ended up following current poll results. But this is a tiny margin. Clinton vs Rubio remains essentially a tied race, with Florida’s 29 electoral votes at the tipping point.
And that is where things stand at the end of February.
254.9 days left until general election polls start to close.
Note: This post is an update based on the data on ElectionGraphs.com. Election Graphs tracks both a poll based estimate of the Electoral College and a numbers based look at the Delegate Races. All of the charts and graphs seen in this post are from that site. Additional graphs, charts and raw data can be found there. All charts above are clickable to go to the current version of the detail page the chart is from, which may contain more up to date information than the snapshots on this page, which were current as of the time of this post. Follow @ElectionGraphs on Twitter or like Election Graphs on Facebook to see announcements of updates or to join the conversation. For those interested in individual general election poll updates, follow @ElecCollPolls on Twitter for all the polls as they are added.
This week on Curmudgeon’s Corner Sam and Ivan of course talk about Election 2016, covering both the Democratic and Republican nomination races, then some speculation about what a Clinton vs Trump race may look like. Before that though, they spend some time following up on both the Apple vs FBI case and the SCOTUS vacancy. And there is some feedback to discuss!
Click below to listen or subscribe… then let us know your own thoughts!

Recorded 2016-02-25
Length this week – 1:32:14
 1-Click Subscribe in iTunes 1-Click Subscribe in iTunes
 View Podcast in iTunes View Podcast in iTunes
 View Raw Podcast Feed View Raw Podcast Feed
 Download MP3 File Download MP3 File
 Follow the podcast on Facebook Follow the podcast on Facebook
Show Details:
- (0:00:10-0:11:03) But First
- Water Heater Fire
- Commutes
- Agenda
- Feedback
- (0:12:07-0:28:20) Apple vs FBI
- PR Battle
- Cracking Safes
- Other ways to get info
- Test Case
- Slippery Slopes
- Lavabit comparison
- (0:29:06-0:42:09) SCOTUS and Congress
- Doing Nothing
- Republican Strategies
- Options in January
- Senate Implications
- Republican Factions
- Ivan for SCOTUS
- (0:42:48-1:01:36) Election 2016 – Primaries
- Ivan for SCOTUS continued
- Clinton Still Winning
- Judicial Murders
- Trump SC/NV Wins
- Dissipating Trump Denial
- Gaming out Super Tuesday
- (1:02:16-1:31:53) Election 2016 – Clinton vs Trump
- Trump as third party after contested convention?
- Are there really that many asshole racists?
- The whiteness of the GOP
- Clinton vs Trump personal attacks
- Trump attacking from both Right and Left
- Trump Reinvention
- President Trump
|
|


