This is the website of Abulsme Noibatno Itramne (also known as Sam Minter).
Posts here are rare these days. For current stuff, follow me on Mastodon
|
With Arizona, Idaho and Utah weighing in, Sanders won 74 delegates to Clinton’s 57. That’s a big win for Sanders. But it is only 56.49% of the delegates. To actually improve his overall position, Sanders would have needed 67.06% of the delegates. He didn’t reach that level, so the Sanders path to the nomination gets even harder.
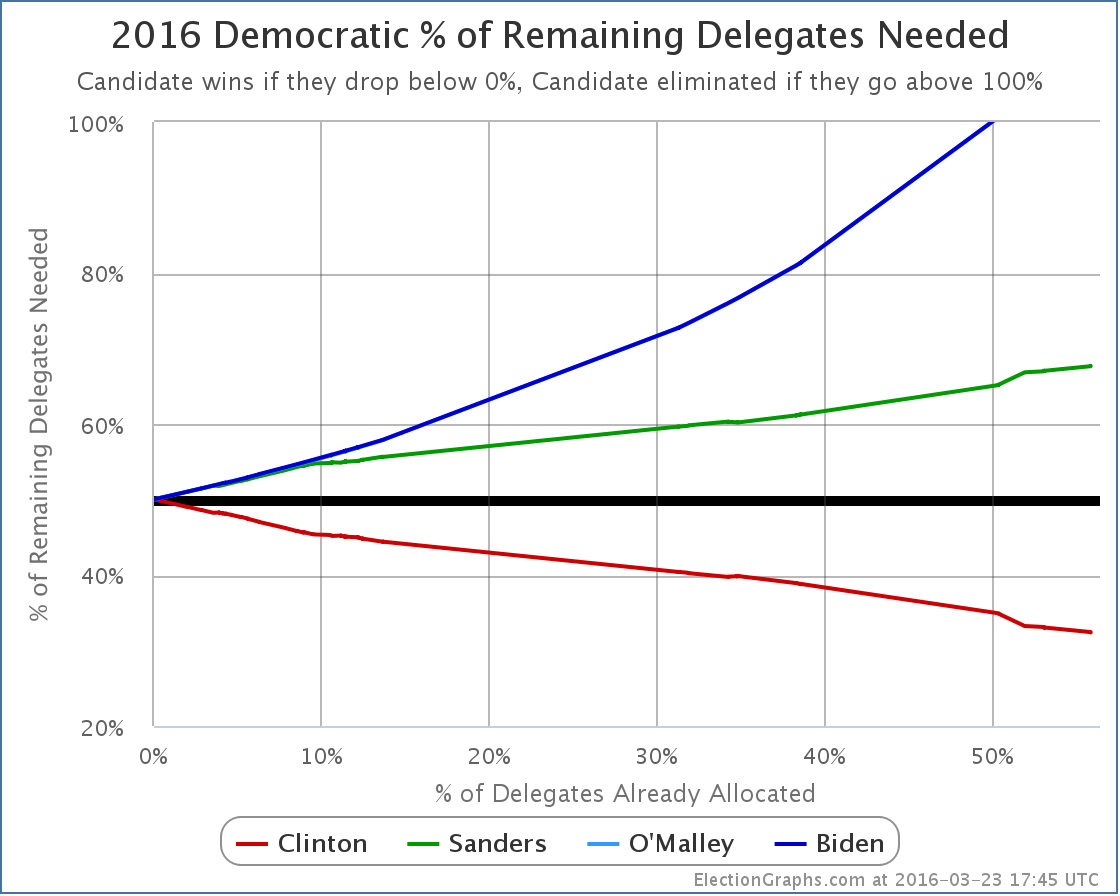
Also including an additional Sanders superdelegate that was added to the totals since the last update, Sanders now needs 67.70% of the remaining delegates to catch up and win. Or, as usual, a huge number of Clinton superdelegates changing their minds could change everything. That seems increasingly unlikely the closer Clinton gets to the nomination of course. But if it happens, you’ll see it here.
[Update 3/26 21:14 UTC – Updates in preparation for new results tonight. Superdelegate changes: Sanders +4. Updates from FL/GA/AZ net: Sanders +4, Clinton -4.]
Note: This post is an update based on the data on ElectionGraphs.com. Election Graphs tracks both a poll based estimate of the Electoral College and a numbers based look at the Delegate Races. All of the charts and graphs seen in this post are from that site. Additional graphs, charts and raw data can be found there. All charts above are clickable to go to the current version of the detail page the chart is from, which may contain more up to date information than the snapshots on this page, which were current as of the time of this post. Follow @ElectionGraphs on Twitter or like Election Graphs on Facebook to see announcements of updates or to join the conversation. For those interested in individual general election poll updates, follow @ElecCollPolls on Twitter for all the polls as they are added.
[Edit 18:14 to fix the date in the title.]
Since the last electoral college update there have been new polls in New York, Arizona, Utah and North Carolina. But the only notable change is in North Carolina:
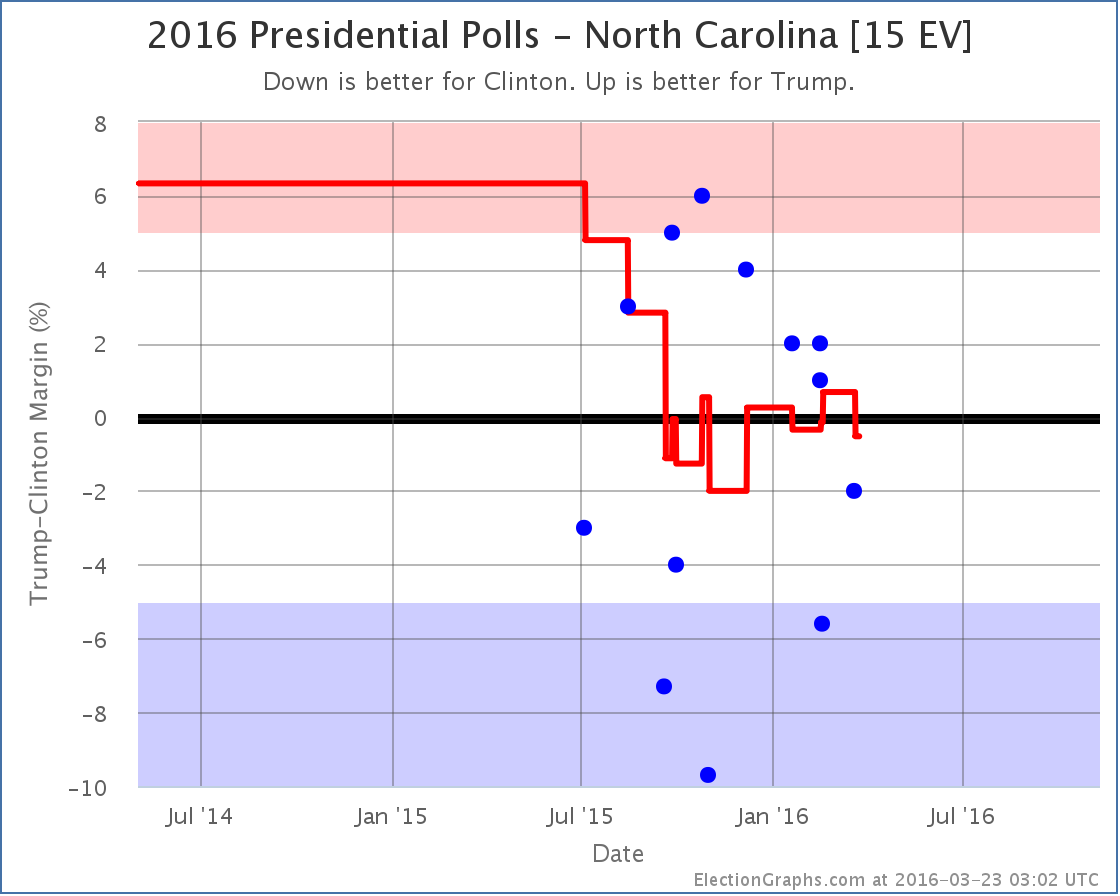
With the latest polls, North Carolina moves from just barely Trump, to just barely Clinton. Either way, it is very close… and it has been bouncing back and forth since last fall. North Carolina is not necessarily showing any sort of trend here. Bottom line it is just a close state in this race.
But for the moment, this puts North Carolina back in Clinton’s column if everybody just wins all the states they are ahead in. So looking at the national picture:
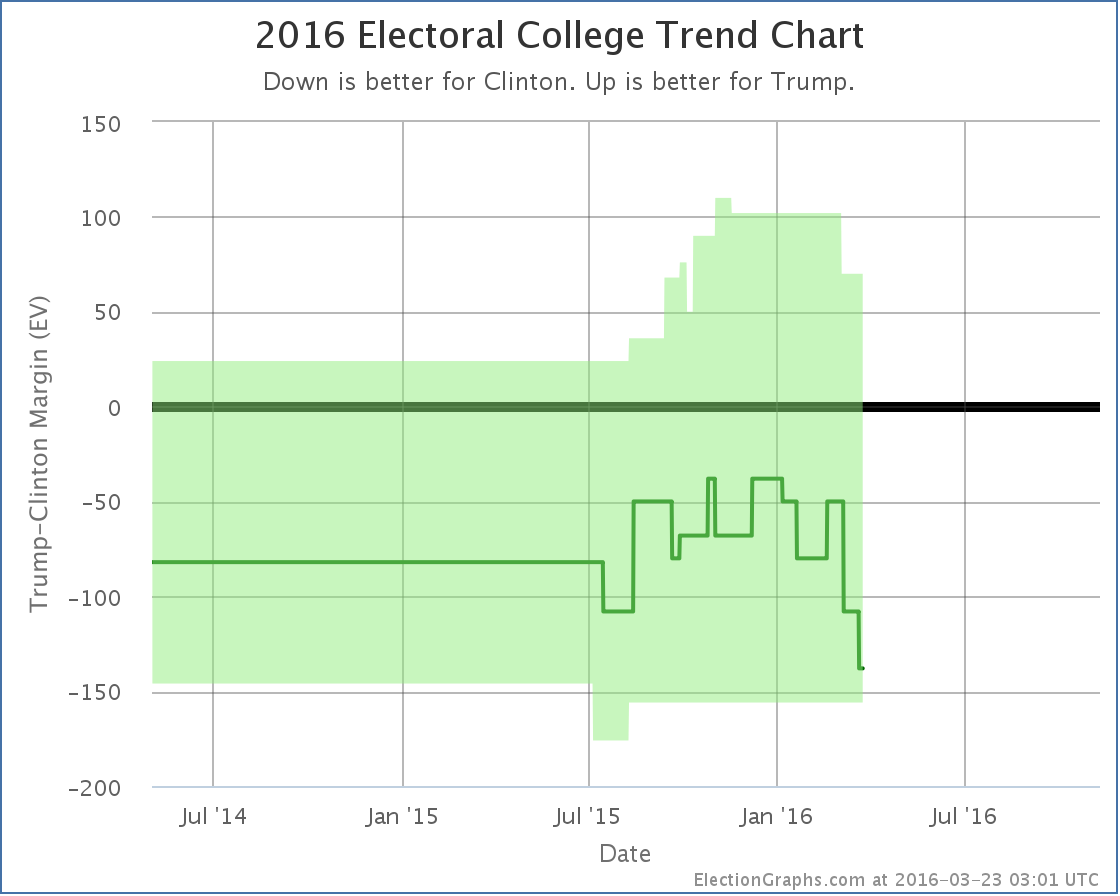

The Clinton vs Trump “Expected Case” has been moving toward Clinton since January. With this update, Trump’s expected case is worse than it has been since Clinton vs Trump polling began.
Now, all the states in the “bubble” are by definition close. They could flip back. But this is starting to look like it might be a real trend and not just noise.
Right now, the expected case sits at Clinton 338, Trump 200… a 138 electoral vote margin for Clinton. For comparison, the Obama-Romney margin was 126 electoral votes.
There are eight states that are “close” right now. But seven of these eight are now leaning Clinton. And the one remaining state (Colorado) has only ONE actual Clinton vs Trump poll (from back in November), the average is still based mostly on how the state has gone in previous election years. It is certainly starting to look like most of the “traditional” battleground states are turning blue in this matchup. Again though, these states are close, and they might easily bounce back to Trump.
The range of reasonable possibilities is large here. Allowing all eight states to swing to one side or the other you get a range from Clinton winning by 156 to Trump winning by 70. Anything is still possible here.
But if Clinton vs Trump continues to look like the most likely combination, then we will probably also start getting more polling in the “Strong Trump” group of states. These have been very lightly polled and are still significantly based on previous election results, and the polls we do have tend to be older at this point. Given the trends in other states, perhaps some of these aren’t actually as “Strong Trump” as they initially seem. Or maybe they are. We shall see.
230.8 days until polls start to close. Things will be moving back and forth the whole time. Stay tuned.
Note: This post is an update based on the data on ElectionGraphs.com. Election Graphs tracks both a poll based estimate of the Electoral College and a numbers based look at the Delegate Races. All of the charts and graphs seen in this post are from that site. Additional graphs, charts and raw data can be found there. All charts above are clickable to go to the current version of the detail page the chart is from, which may contain more up to date information than the snapshots on this page, which were current as of the time of this post. Follow @ElectionGraphs on Twitter or like Election Graphs on Facebook to see announcements of updates or to join the conversation. For those interested in individual general election poll updates, follow @ElecCollPolls on Twitter for all the polls as they are added.
[Update 2016-03-23 18:18 to Fix Article title to Electoral College]
Just a small number of delegates, but we did finally get results from the Democrats Abroad primary that was held earlier in the month:
Sanders 9, Clinton 4.
With this change alone, Sanders did get a high enough percentage of delegates (69.2%) that his “% of remaining delegates needed to win” would have improved. But there were other delegate changes in the six days since the last primary results as well.
The last Democratic post was done while many delegates from Florida and Illinois were still to be determined, because for some reason those states were super slow and it took about two days for everything to be settled. That info was added to that post as an update, but for completeness here, from those final updates, Clinton gained 85 more delegates and Sanders added 43. In addition there were superdelegate updates. Net superdelegate change was Clinton +5, Sanders +0.5. The half delegate is from a Democrats Abroad superdelegate, who only gets a half vote.
With all that, the Democrats Abroad results are actually overwhelmed by the other updates and the new totals are:
Clinton 1644, Sanders 882.5, O’Malley 1
Translating that into the all important “% of remaining delegates needed” graph:
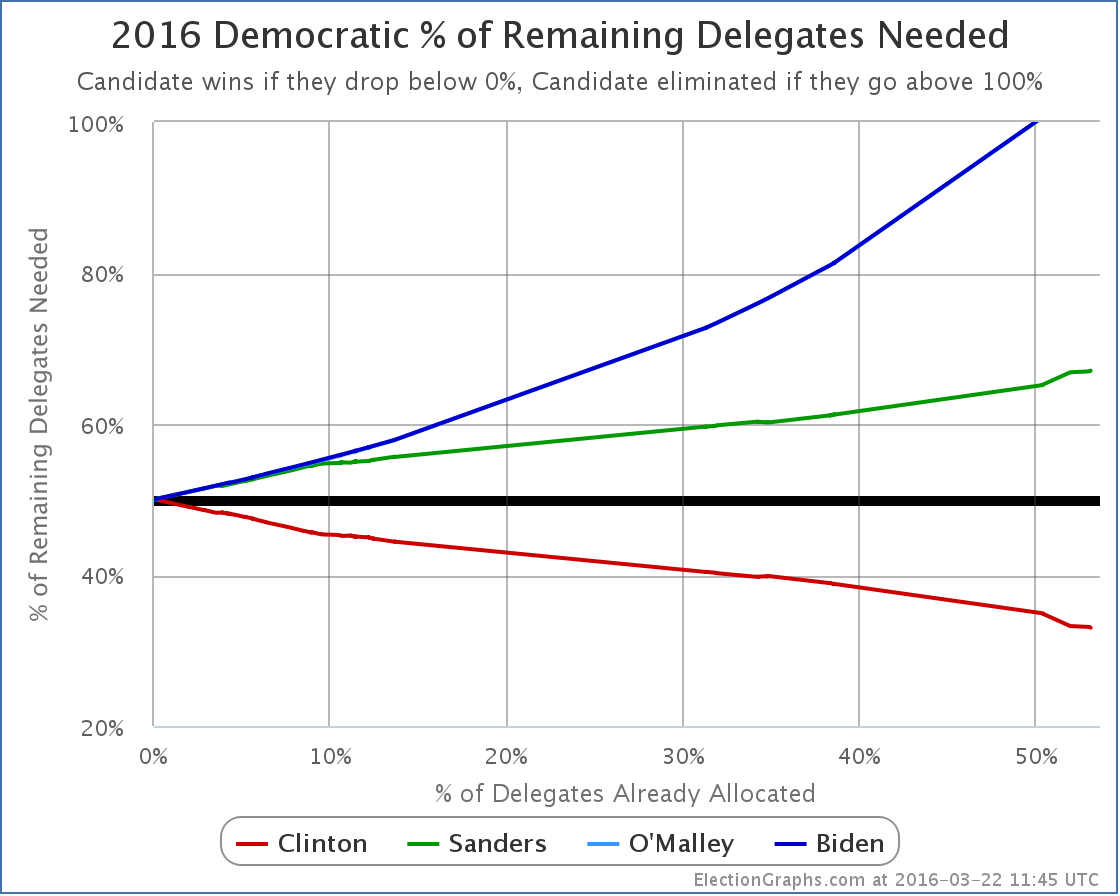
As of now, Clinton needs 33.03% of the remaining delegates to win. Sanders needs 67.06%.
That includes superdelegates of course, and superdelegates can change their minds. If Clinton superdelegates defect to Sanders, Clinton would need more and Sanders would need less. Such defections have been very rare so far however. If they do start to happen, you’ll see it in these charts.
Until then though, this is where we sit. Up next: Arizona, Utah and Idaho.
[Update 2016-03-23 01:34 – Superdelegate scan, Net Sanders +1]
Note: This post is an update based on the data on ElectionGraphs.com. Election Graphs tracks both a poll based estimate of the Electoral College and a numbers based look at the Delegate Races. All of the charts and graphs seen in this post are from that site. Additional graphs, charts and raw data can be found there. All charts above are clickable to go to the current version of the detail page the chart is from, which may contain more up to date information than the snapshots on this page, which were current as of the time of this post. Follow @ElectionGraphs on Twitter or like Election Graphs on Facebook to see announcements of updates or to join the conversation. For those interested in individual general election poll updates, follow @ElecCollPolls on Twitter for all the polls as they are added.
This week on Curmudgeon’s Corner Sam and Ivan start with a rant about Daylight Saving Time, then they talk about third parties, Brazil, Syria, Seaworld and the Supreme Court before diving into Election 2016 and all the craziness there. Oh, and Sam’s 6 year old son Alex keeps interrupting this week, so there is that fun too!
Click below to listen or subscribe… then let us know your own thoughts!

Recorded 2016-03-18
Length this week – 1:46:20
 1-Click Subscribe in iTunes 1-Click Subscribe in iTunes
 View Podcast in iTunes View Podcast in iTunes
 View Raw Podcast Feed View Raw Podcast Feed
 Download MP3 File Download MP3 File
 Follow the podcast on Facebook Follow the podcast on Facebook
Show Details:
- (0:00:10-0:07:54) But first
- (0:08:59-0:28:25) But second
- New Snack? / Broken hand?
- Why alone?
- Feedback / Third Parties
- ALeXMXeLA.com
- (0:29:04-0:46:01) Mini Lightning Round
- Cutting the cheese
- Brazil Scandal
- Russians withdraw from Syria
- Seaworld Orcas
- (0:47:05-0:59:32) SCOTUS
- Certifiable Moderate
- Wall Breaking Down Already
- No hearings, unless Hillary
- Troll moves, crying
- (1:00:47-1:46:00) Election 2016
- Cheese in the Microphone
- March 15th results
- Uncommitted Delegates
- Rubio’s Delegates
- Delegate Corruption
- Trump encouraging riots?
- Convention Shenanigans
- Alex Clearing the shelves
- Carson and Christie
- Clinton still winning
- Obama vs Trump
As of when I started writing this post, the results from the March 15th contests on the Democratic side were:
Clinton +312, Sanders +251, TBD 128*
In addition, since the last post other revisions netted: Clinton +3, Sanders +1.
So of the delegates allocated since that last update, Clinton got 55.6%. She only needed 38.90% of the delegates to be on pace to win.
So the updated “% of remaining needed to win” graph looks like this…
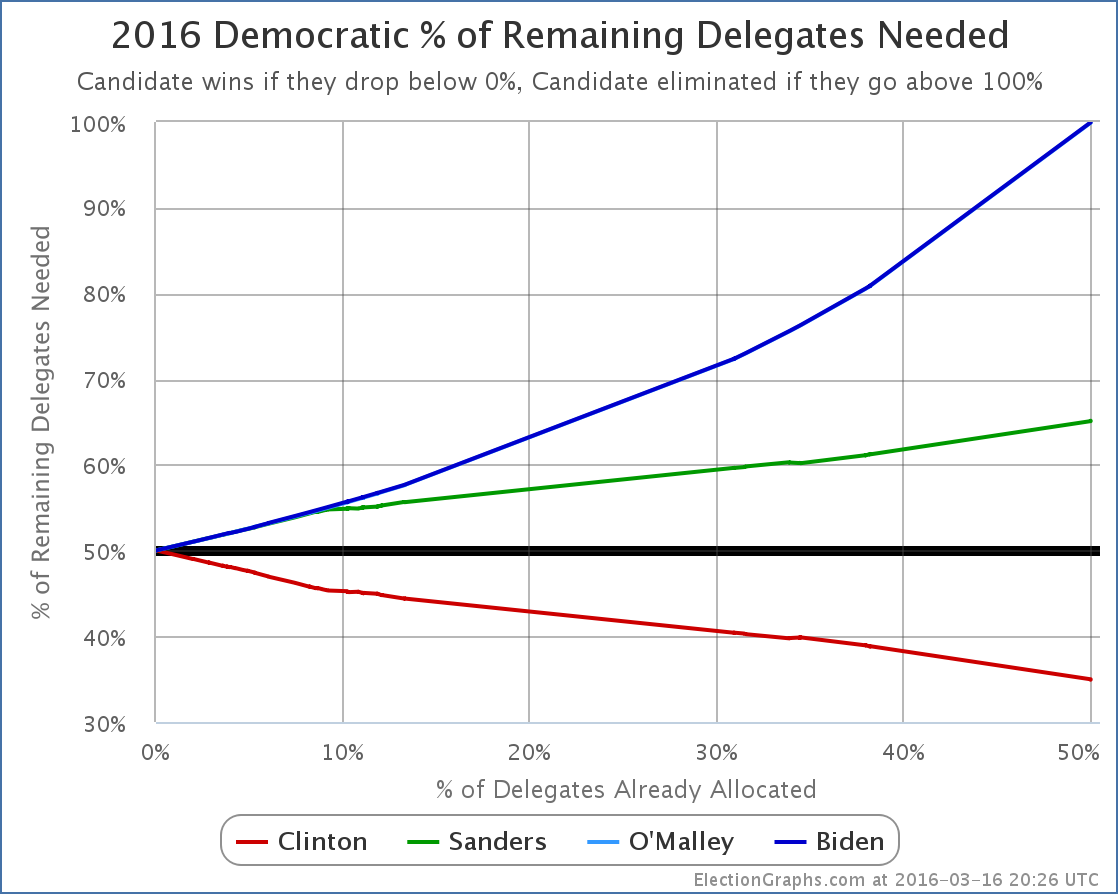
Clinton only needs 34.94% of the remaining delegates to win.
Of course, if massive numbers of superdelegates start changing their minds, that number would get higher. Enough superdelegates flipping could in fact still put Sanders in the lead!
But superdelegates haven’t been changing their minds in significant numbers yet.
And so Clinton’s delegate accumulation continues.
* I waited awhile before writing this post because the final disposition of 64 delegates each from Florida and Illinois is still undetermined as per my source (Green Papers). But at some point I had to go ahead with what I had. Those delegates are likely to split along the same lines as the other delegates from those states though, and they are unlikely to change the overall picture. If there are additional updates for those delegates before the results from Arizona, Idaho and Utah come in, I will add updates to the post with those results.
[Update 2016-03-17 00:30 UTC – And here is the first of those updates. With updates to both Florida and Illinois, Clinton added 64 more delegates, and Sanders added 11. All 64 TBD delegates from Florida are now accounted for. There are still 53 delegates TBD in Illinois. Clinton now only needs 33.30% of the remaining delegates, while Sanders needs 66.78%. In addition, with this update O’Malley is officially mathematically eliminated.]
[Update 2016-03-18 05:20 UTC – Update today for both Illinois and Ohio. Net result Clinton gained another 21 delegates, Sanders gained 32. There are no more TBD delegates remaining. Clinton now needs 33.16% of the remaining delegates while Sanders needs 66.93%.]
[Update 2016-03-18 05:41 UTC – Superdelegate scan, Net: Clinton -1]
[Update 2016-03-20 16:12 UTC – Superdelegate scan, Net: Clinton +1]
[Update 2016-03-22 11:27 UTC – Superdelegate scan: Net: Clinton +5, Sanders +0.5 (Democrats Abroad superdelegates get half a vote)]
Note: This post is an update based on the data on ElectionGraphs.com. Election Graphs tracks both a poll based estimate of the Electoral College and a numbers based look at the Delegate Races. All of the charts and graphs seen in this post are from that site. Additional graphs, charts and raw data can be found there. All charts above are clickable to go to the current version of the detail page the chart is from, which may contain more up to date information than the snapshots on this page, which were current as of the time of this post. Follow @ElectionGraphs on Twitter or like Election Graphs on Facebook to see announcements of updates or to join the conversation. For those interested in individual general election poll updates, follow @ElecCollPolls on Twitter for all the polls as they are added.
[Update 2016-03-17 15:45 UTC to correct slight error in the second decimal place of the “needs” numbers for Clinton and Sanders in the 2016-03-17 00:30 UTC update note.]
Yeah, yeah, primaries. Another general election poll, this time in Pennsylvania. They polled a bunch of different candidate combinations, but the one with a significant change was Clinton vs Trump:
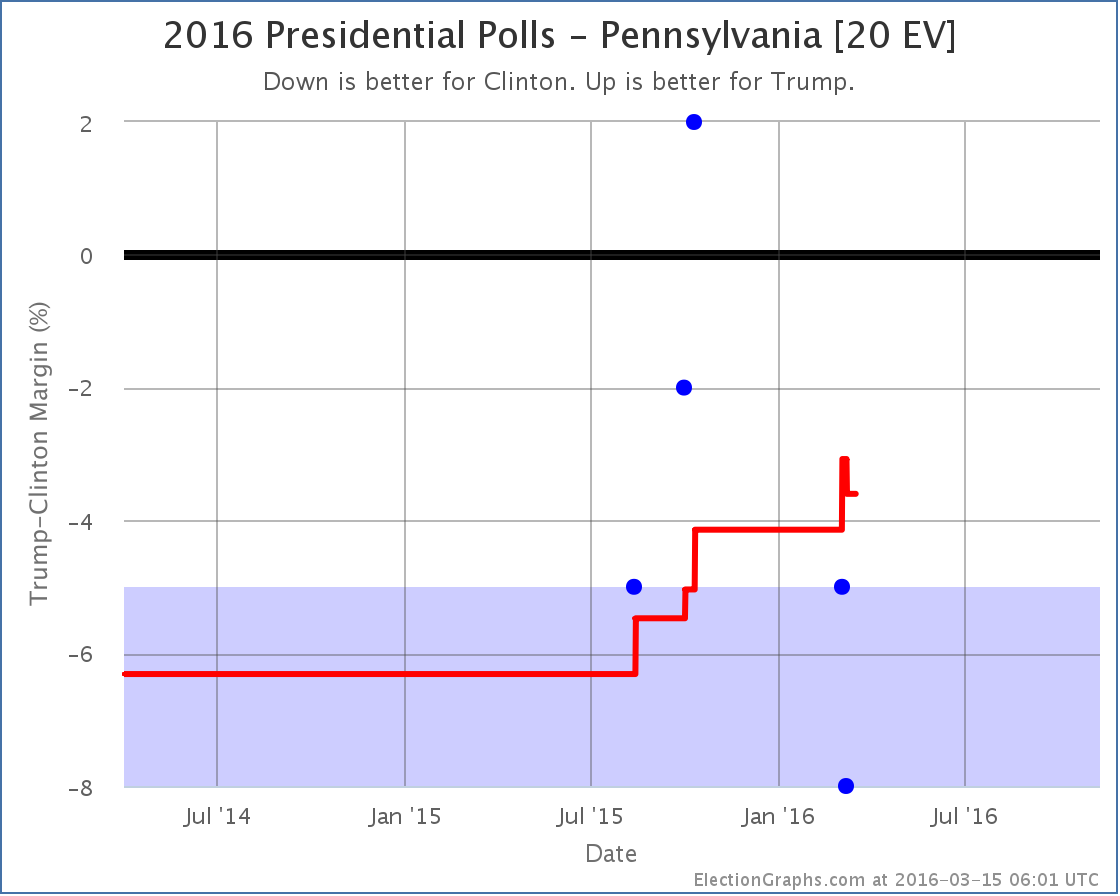
No category change. Pennsylvania stays “Weak Clinton”. But Pennsylvania was the tipping point state in Clinton vs Trump, so when Pennsylvania moves, so does the tipping point:
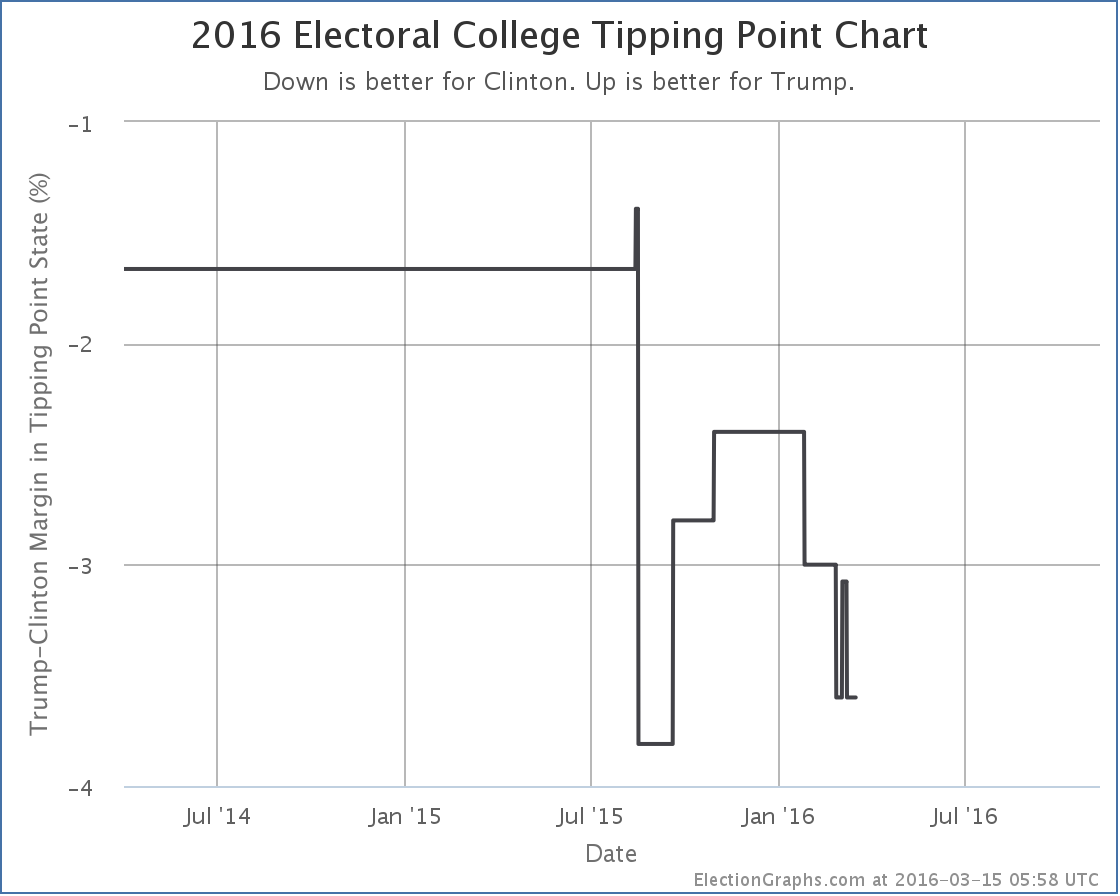
The tipping point goes from Clinton by 3.1% in Pennsylvania, to Clinton by 3.6% in Pennsylvania… which happens to be the same as it was just a few days earlier. So things just bouncing around a little bit. The trend since January on the tipping point seems to be away from Trump and toward Clinton… but there is lots of time yet.
238.0 days until the polls start closing on election day.
Note: This post is an update based on the data on ElectionGraphs.com. Election Graphs tracks both a poll based estimate of the Electoral College and a numbers based look at the Delegate Races. All of the charts and graphs seen in this post are from that site. Additional graphs, charts and raw data can be found there. All charts above are clickable to go to the current version of the detail page the chart is from, which may contain more up to date information than the snapshots on this page, which were current as of the time of this post. Follow @ElectionGraphs on Twitter or like Election Graphs on Facebook to see announcements of updates or to join the conversation. For those interested in individual general election poll updates, follow @ElecCollPolls on Twitter for all the polls as they are added.
Since the last Electoral College Update there have been general election polls in Florida, Ohio and Illinois. There was no notable change to the front-running Clinton vs Trump pair, but there was significant movement in Clinton vs Cruz.
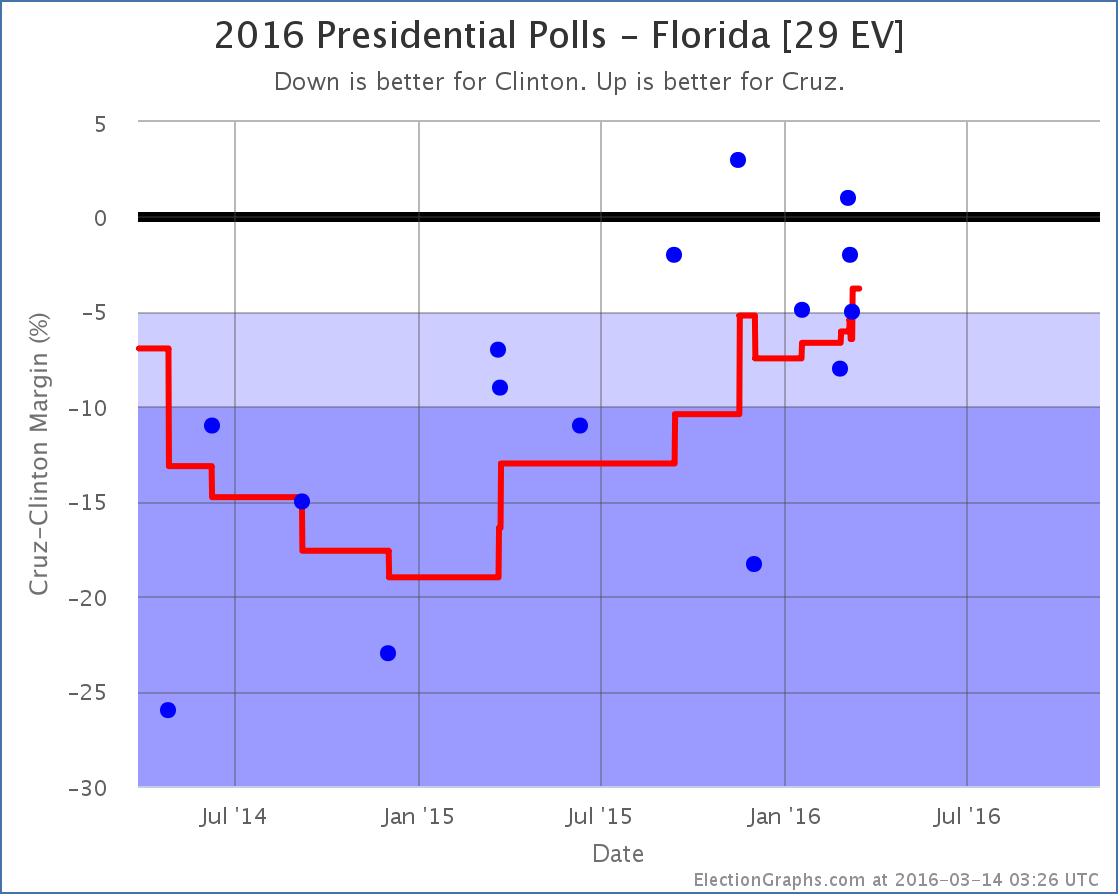
After more than a year on an upward trend, Cruz finally closes to within 5% of Clinton in Florida. Clinton now leads by only 3.8%. This makes Florida a “Weak Clinton” state and makes it a possible pickup for Cruz. Add this to Ohio from a few days ago and you have a breakthrough moment for Cruz:
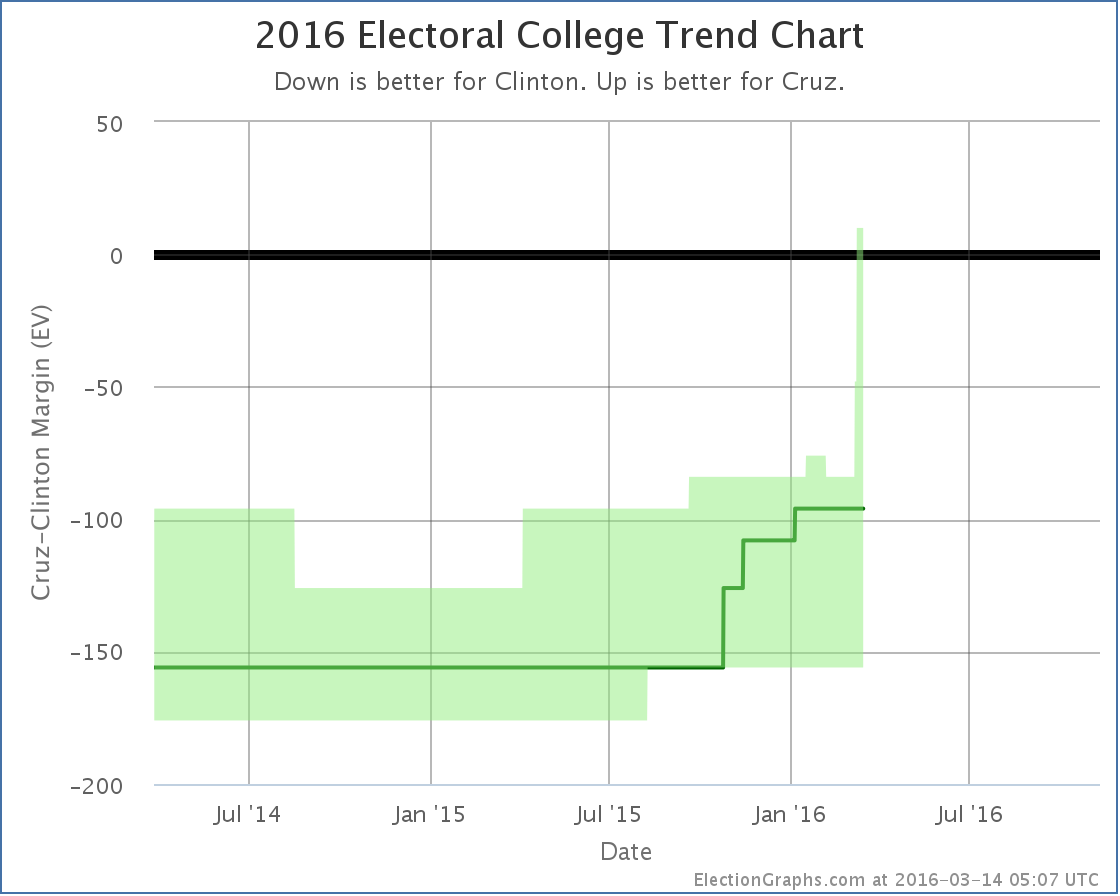
For the first time, Cruz’s best case is actually to win. If Cruz won every state he leads, plus Nevada, Ohio, and Florida where he is close… then he wins by 10 electoral votes.
Without those three close states, he still loses by 96 electoral votes. But those three states ARE close, and for the very first time the possibility of Cruz pulling ahead and winning seems plausible.
The Florida move, plus yet another bump in Cruz’s direction in Ohio, also moved the tipping point:
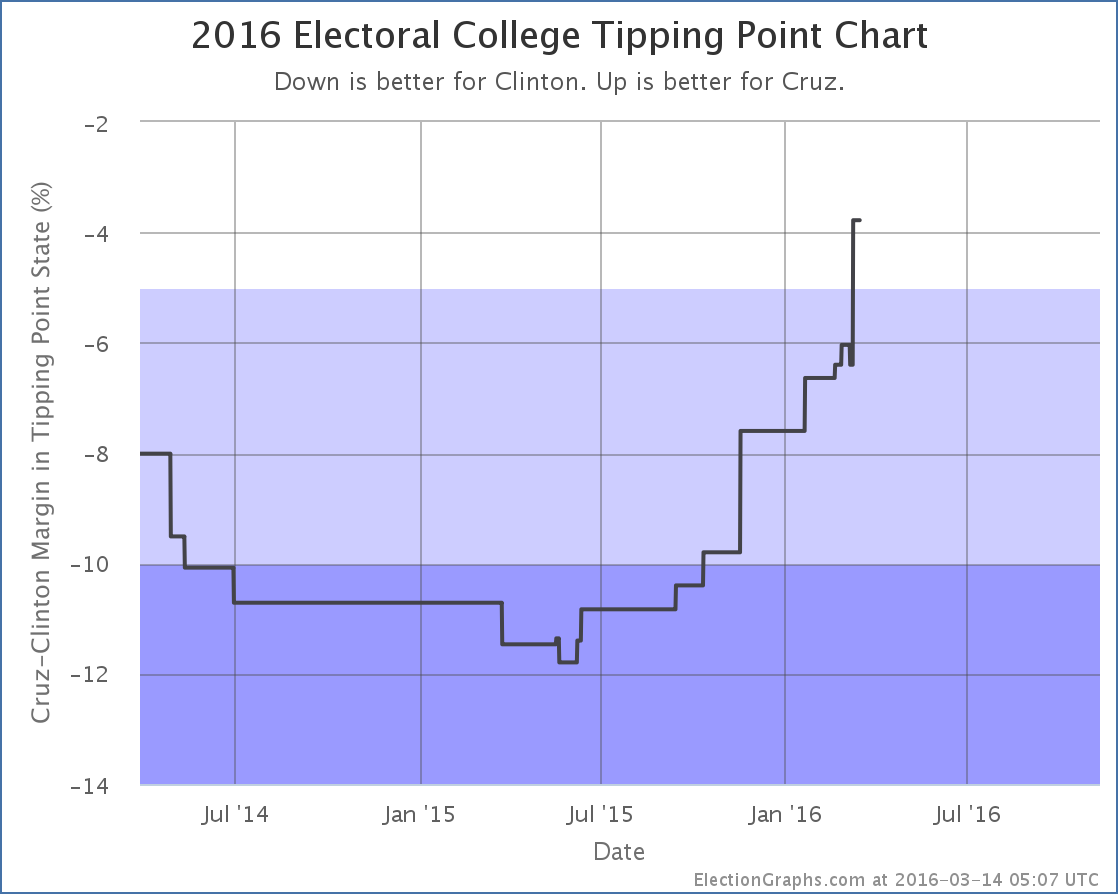
Before the latest batch of updates, the tipping point had been New Hampshire, where Clinton is ahead by 6.4%. Now it is Florida, where Clinton is ahead by only 3.8%.
Florida and Ohio make a big difference, and Cruz is now making them both close.
Cruz had been the one Republican candidate that looked sure to lose in the general. But things change during a campaign, and he now has a shot. If he were to win the Republican nomination of course. Looking at the delegate race that still looks unlikely. But if we end up at a contested convention, anything could happen…
Note: This post is an update based on the data on ElectionGraphs.com. Election Graphs tracks both a poll based estimate of the Electoral College and a numbers based look at the Delegate Races. All of the charts and graphs seen in this post are from that site. Additional graphs, charts and raw data can be found there. All charts above are clickable to go to the current version of the detail page the chart is from, which may contain more up to date information than the snapshots on this page, which were current as of the time of this post. Follow @ElectionGraphs on Twitter or like Election Graphs on Facebook to see announcements of updates or to join the conversation. For those interested in individual general election poll updates, follow @ElecCollPolls on Twitter for all the polls as they are added.
On Saturday we got results from the Northern Mariana Islands. A whopping 6 delegates were at stake, so this almost wasn’t worth its own post, but here goes. Then we’ll follow it up with a quick comparison with 2008 and 2012.
Clinton won 4 delegates. Sanders won 2.
Since the post on the Michigan results between Michigan finalizing results and superdelegate preferences we have an additional net change of Clinton +2, Sanders -1.
So since the Michigan post, a total of Clinton +6, Sanders +1. So 85.71% of delegates to Clinton, way more than the 38.96% she needed to be on the glide path to the nomination.
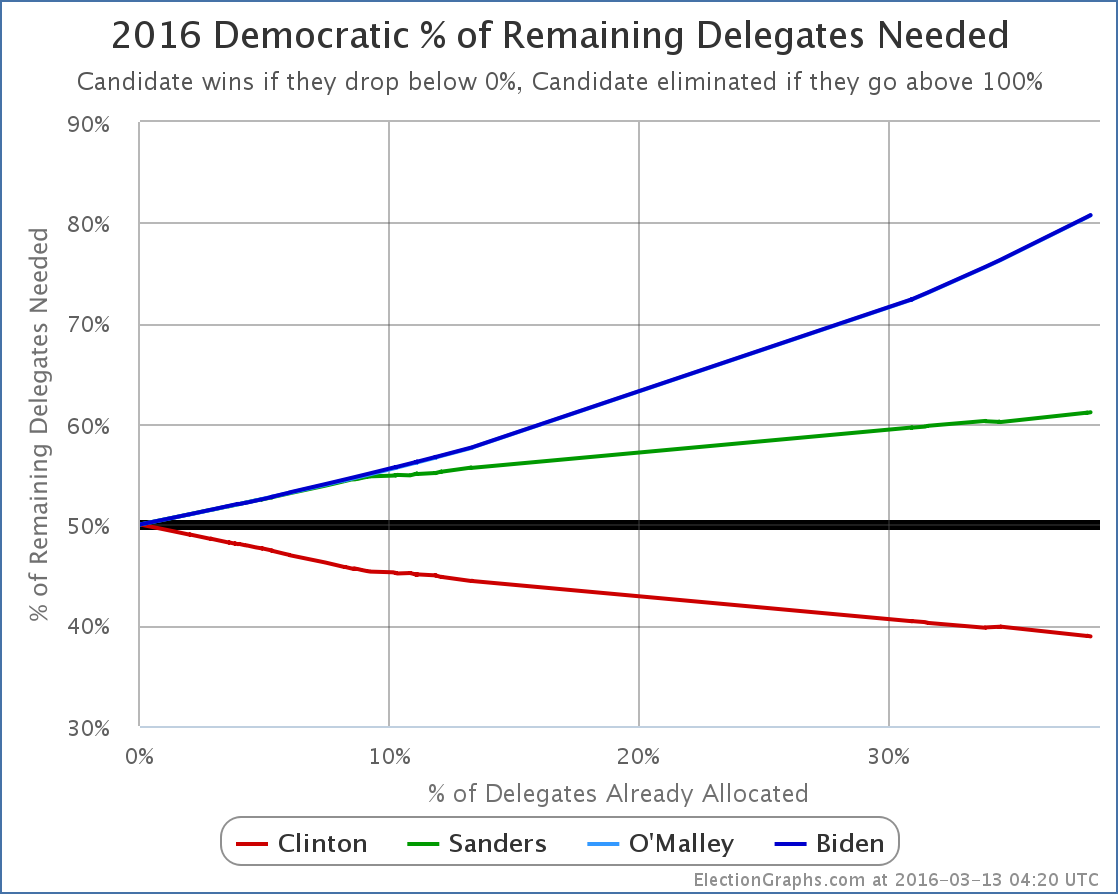
Clinton now needs 38.90% of the remaining delegates to win. Or more if a large number of superdelegates start to defect. But that hasn’t happened yet.
Yawn.
OK, since not much happening there, just a quick comparison of where Clinton and Sanders’ “% of remaining needed to win” is compared to Obama’s at similar points in 2008 and 2012. (For clarity, I’ve eliminated some oddness in the chart at the very end of the 2008 line when delegates were restored to states that had been stripped of them for rules violations and such.)
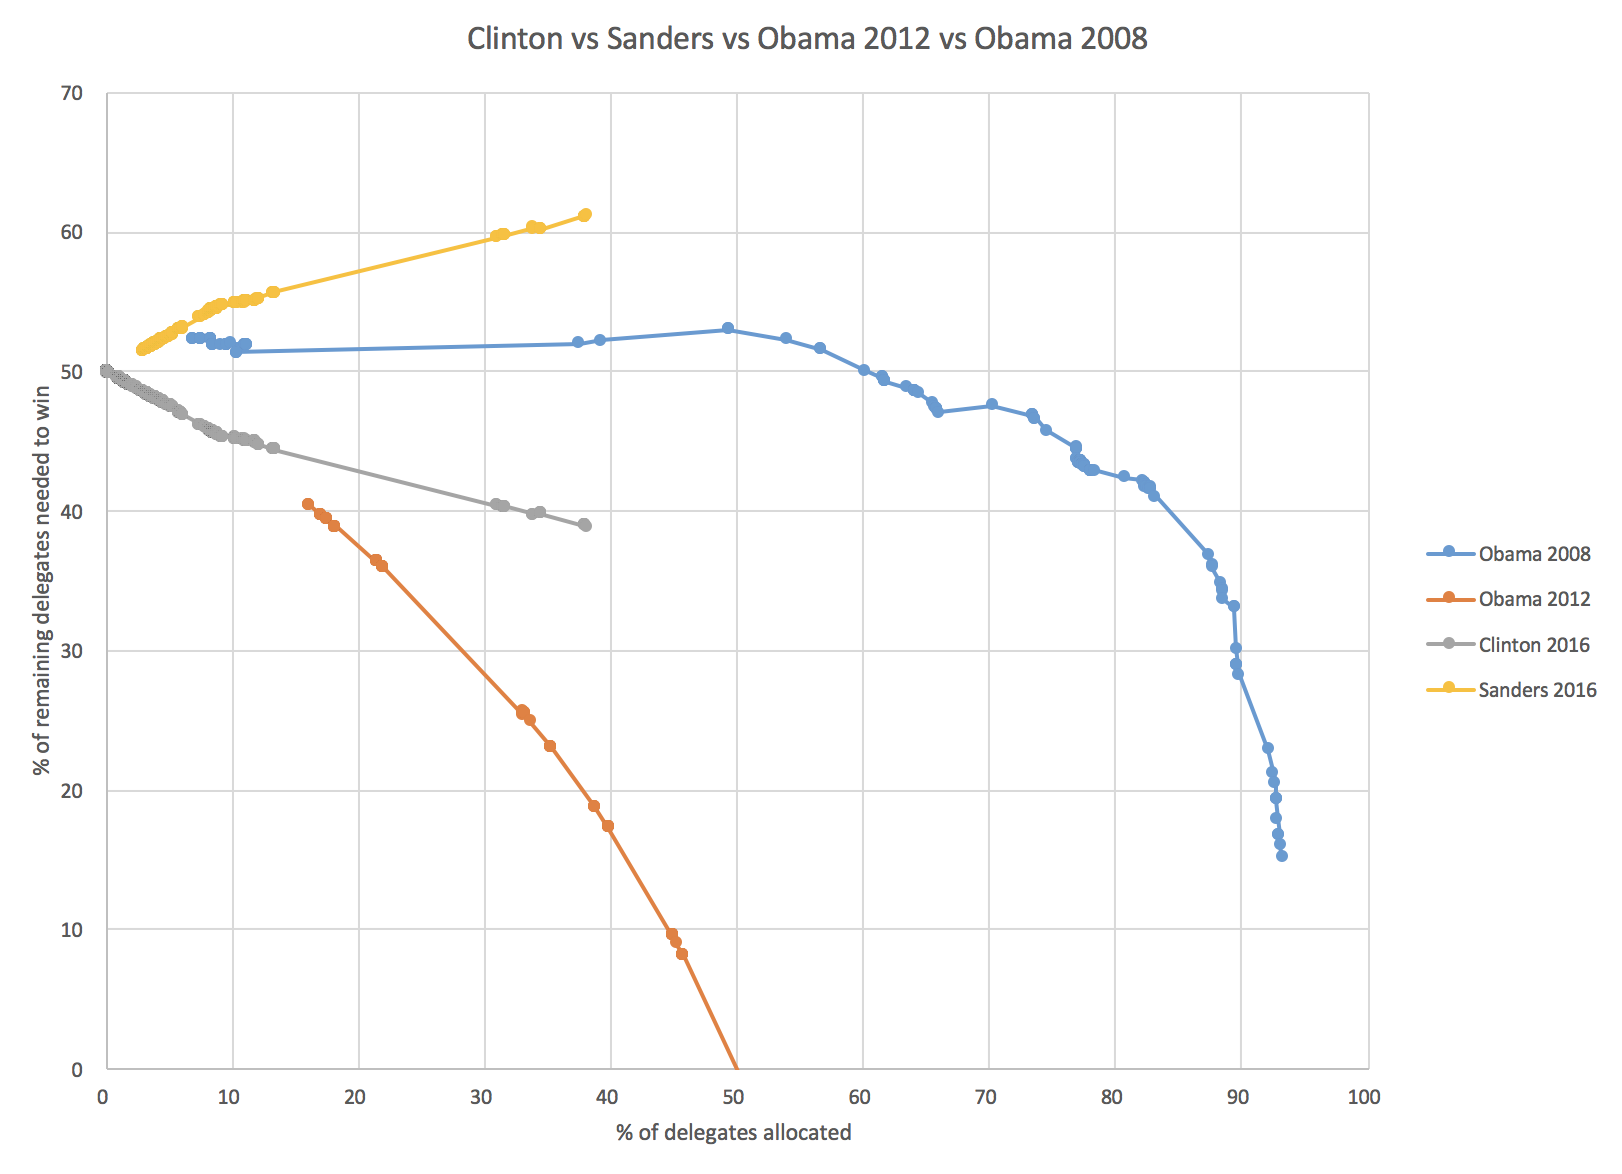
The blue line is Obama in 2008. At this point he was still behind! He needed about 52% of the remaining delegates to win. He managed that of course, and ended up winning. Because of the competition from Clinton, Obama did not clinch the nomination until about 96% of the delegates had been determined.
The orange line was Obama in 2012 when he was unopposed. Aside from a few random protest delegates here and there he essentially collected 100% of delegates as soon as they became available, and clinched at the 50% mark.
Clinton 2016 so far is neatly splitting the difference. She is far far ahead of where Obama was in 2008, but of course not doing as well as she would if she was unopposed.
And then Sanders 2016. Notice that while Obama was behind at this stage, he was basically holding steady. He was not getting further and further behind with each new primary or caucus. Then right around when he hit the 50% mark, he started winning decisively, and caught up and won. Sanders is not holding the line. He is not keeping up. He keeps falling further and further behind the pace he would need to catch up and win. This is not what a come from behind victory looks like. This is what a stay behind loss looks like.
Of course if Sanders started winning every contest from here on out by large margins, then Clinton superdelegates might start abandoning her in droves and this graph COULD still change rapidly. If and when that happens, we’ll see it. But it hasn’t happened yet, and the longer this goes on, the less likely that becomes. It would require a DRAMATIC change in the the race. As I’ve said before, we’re talking something on the order of a new Clinton scandal that even Clinton die-hards think is disqualifying, or a major Clinton health issue, not just Sanders doing well and winning a few states.
[Update 2016-03-15 05:07 UTC – Revision to Kansas delegate results, plus superdelegate changes. Net: Clinton +4, Sanders +1]
[Update 2016-03-16 00:31 UTC – Superdelegate changes. Net: Clinton -1]
Note: This post is an update based on the data on ElectionGraphs.com. Election Graphs tracks both a poll based estimate of the Electoral College and a numbers based look at the Delegate Races. All of the charts and graphs seen in this post are from that site. Additional graphs, charts and raw data can be found there. All charts above are clickable to go to the current version of the detail page the chart is from, which may contain more up to date information than the snapshots on this page, which were current as of the time of this post. Follow @ElectionGraphs on Twitter or like Election Graphs on Facebook to see announcements of updates or to join the conversation. For those interested in individual general election poll updates, follow @ElecCollPolls on Twitter for all the polls as they are added.
This week on Curmudgeon’s Corner, Sam and Ivan talk about Sam’s son’s trip to the doctor, they respond to a bunch of listener feedback, talk a bit about Apple and Nancy Reagan, and then finally jump into Election 2016. Within that topic they cover the charges of Trump inciting violence, the delegate math, what might happen at a contested convention, explanations for the Sanders win in Michigan… and more!
Click below to listen or subscribe… then let us know your own thoughts!

Recorded 2016-03-12
Length this week – 1:38:06
 1-Click Subscribe in iTunes 1-Click Subscribe in iTunes
 View Podcast in iTunes View Podcast in iTunes
 View Raw Podcast Feed View Raw Podcast Feed
 Download MP3 File Download MP3 File
 Follow the podcast on Facebook Follow the podcast on Facebook
Show Details:
- (0:00:10-0:16:37) But First
- Delayed Show
- Agenda
- Alex Doctor Visit
- Alex Test Results
- (0:17:25-0:43:53) Feedback!
- Feedback Format
- Jenn on which nomination process Sam should do
- Bruce on which nomination process Sam should do
- Richard on a show format suggestion
- Jon on Gary Johnson
- Matt on Kanye
- Edward on Trump
- (0:44:32-0:57:47) Mini Lightning Round
- Alex’s iPad
- Alex’s YouTube Channel
- Upcoming Apple Event
- Snowden on Apple vs FBI
- Nancy Reagan
- (0:58:28- 1:36:24) Election 2016
- Trump inciting violence?
- Trump salutes?
- Delegate Math
- Contested Convention
- Sanders Michigan Win
- Ivan’s Vote
Since my last Electoral College blog post there have been new polls in New York, Florida, New Jersey, Ohio and Pennsylvania. There were notable changes for two candidate pairs. But for both of them, the news was mixed. Lets take a look:
Clinton vs Trump
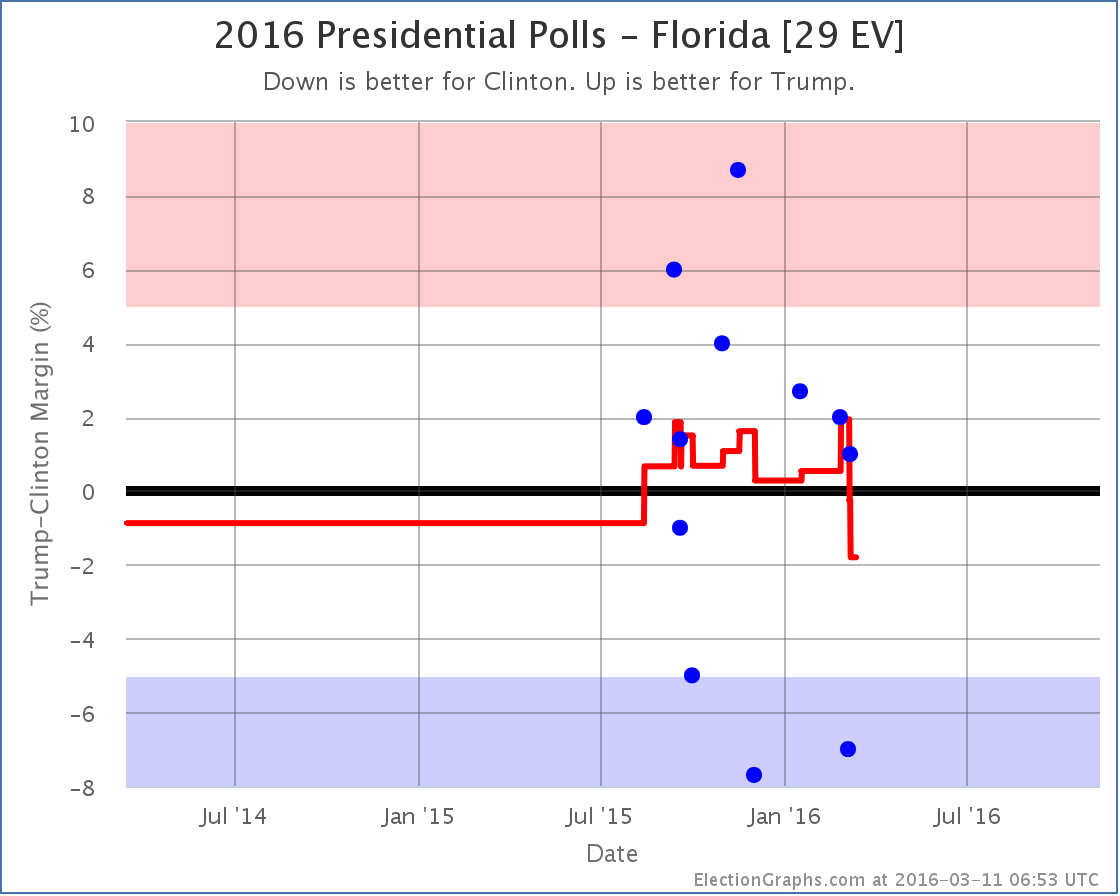
With some strong polls from last fall rolling off the average, Florida flips from “Weak Trump” to “Weak Clinton” with the state now sitting at a 1.8% Clinton lead. This is still a very “close could go either way” result, but it puts Florida on Clinton’s side of the fence so she gets Florida’s 29 electoral votes in her “Expected” case:
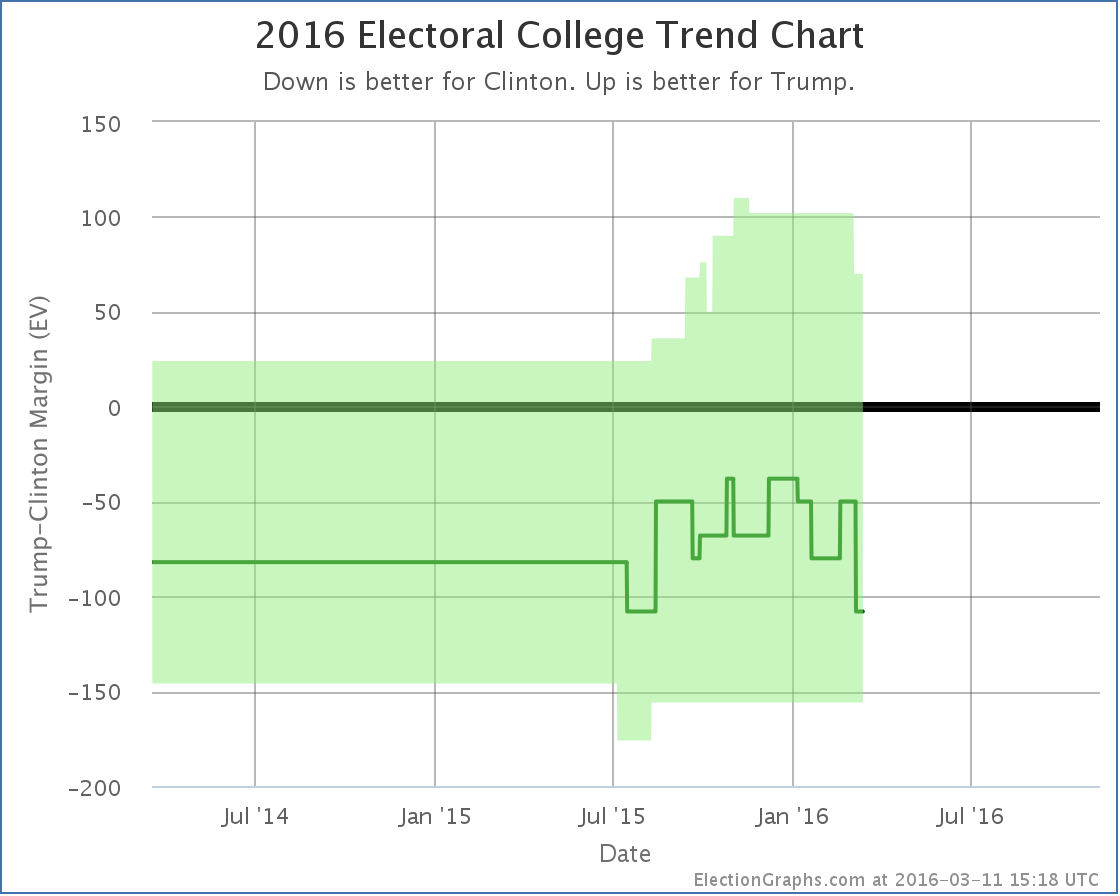
Florida is a big state and makes a big difference. The expected result is now a 108 electoral vote win by Clinton. But it is important to remember that given all the close states that could easily move, anything from Clinton by 156 to Trump by 70 is very easy to imagine given the current polling.
But there was movement for Trump in the other direction too. He improved in Pennsylvania, and while it didn’t change the status of Pennsylvania (Weak Clinton) it did move Trump’s tipping point:
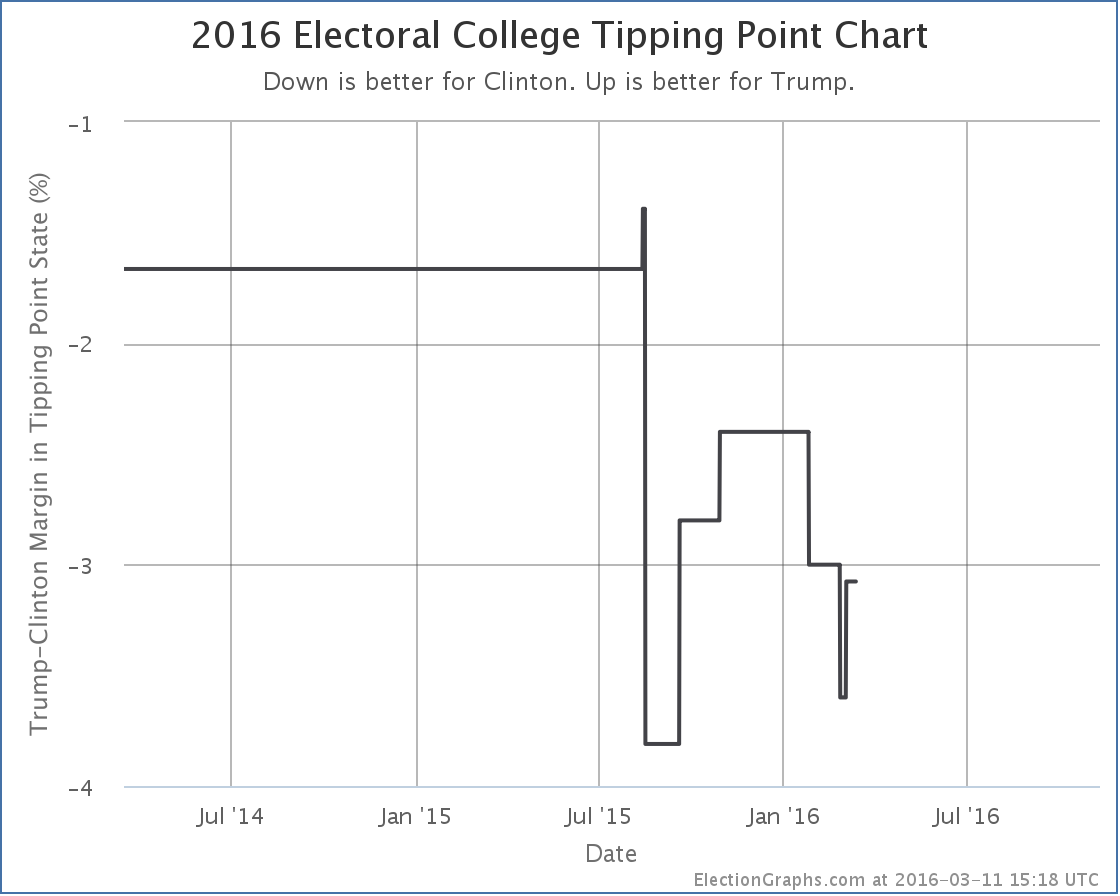
After a very brief dip lower, Trump’s tipping point pops back up to being behind Clinton by only 3.1%. Remember, the tipping point essentially represents how far ahead or behind a candidate is nationally, but adjusted for the effects of the electoral college.
So Trump’s “expected” result gets a little bit worse, but the amount he has to move polls to flip that result to a win gets a little smaller.
Clinton vs Cruz
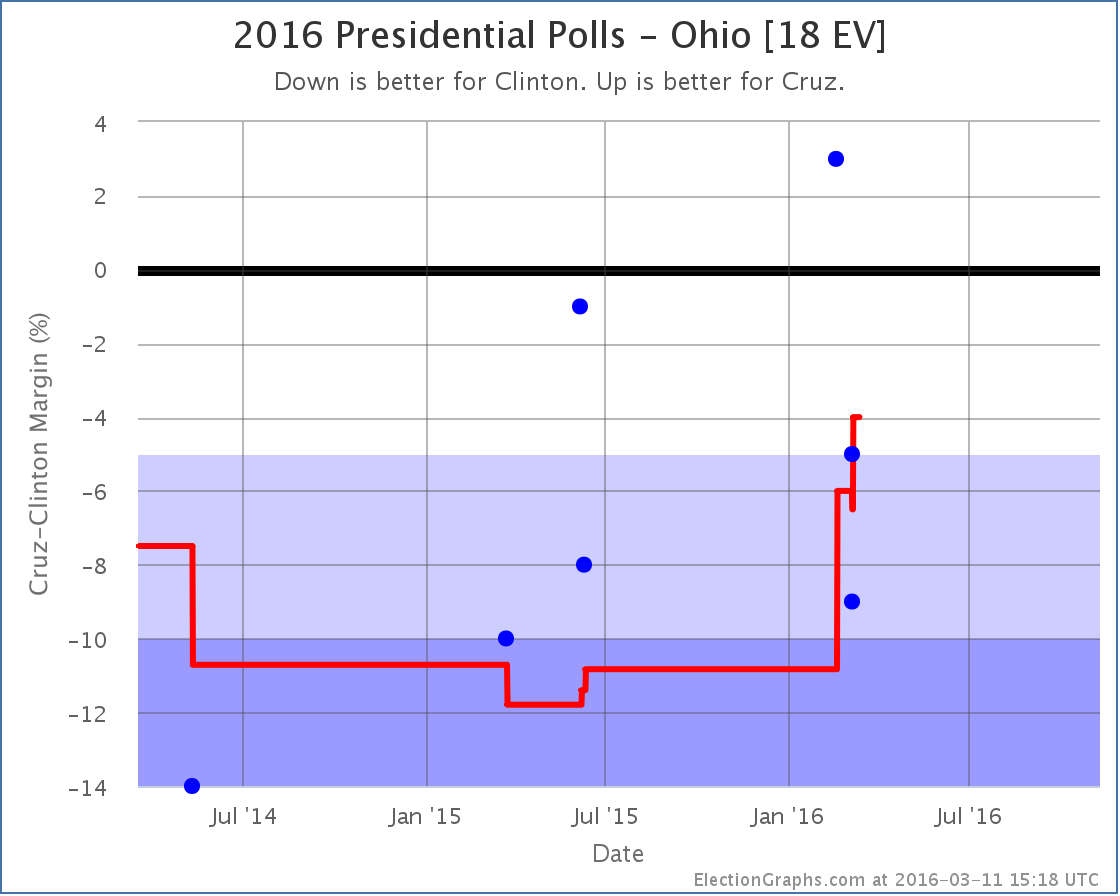
While Trump was weakening in Florida, Cruz’s poll average was improving in Ohio. He is now behind Clinton by only 4.0%. She still leads, but this is close enough for me to consider Ohio a swing state and a possible pick up for Cruz, which improves his “best case”…
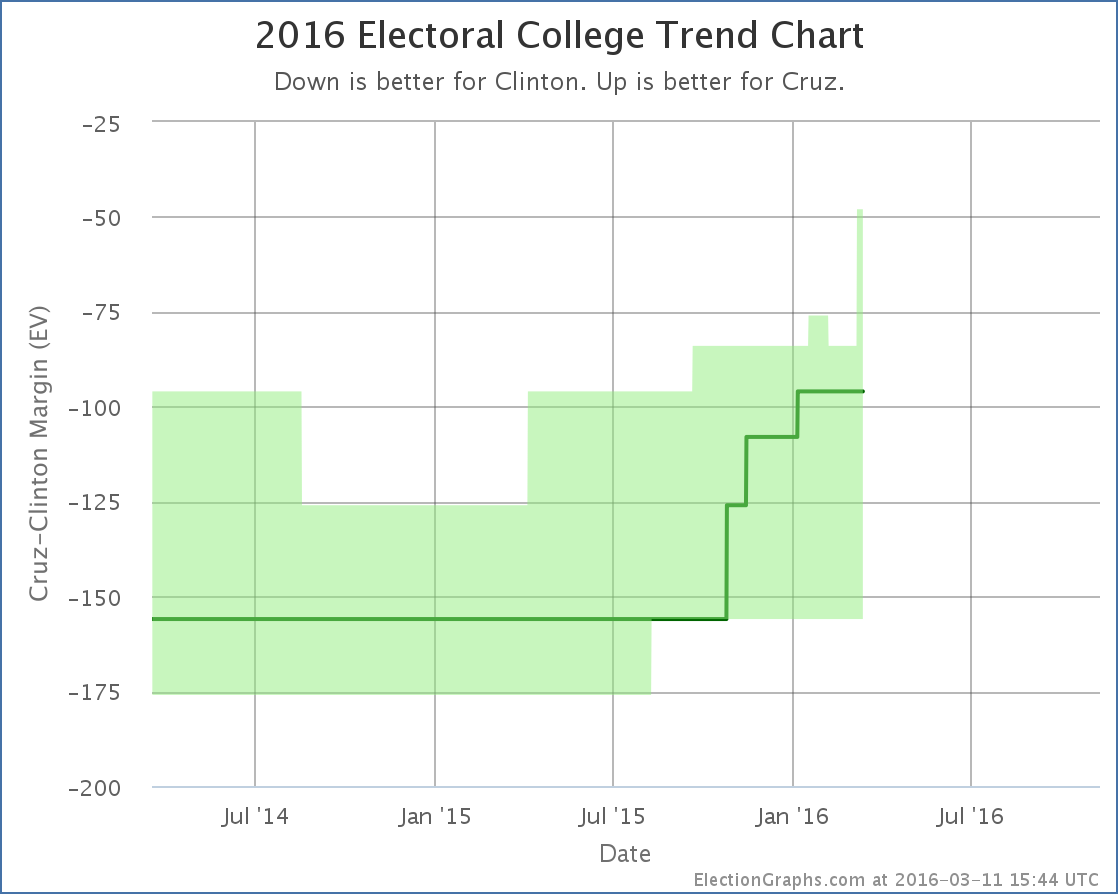
Now if Cruz wins all the states he is ahead in, plus flips Nevada and Ohio where he is close… he loses by only 48 electoral votes.
But still, it is an improvement. And Cruz has been on an improving trend for about a year now. If it continues, he might eventually be competitive.
On this metric anyway. As with Trump above, his tipping point also moves, but in the opposite direction:
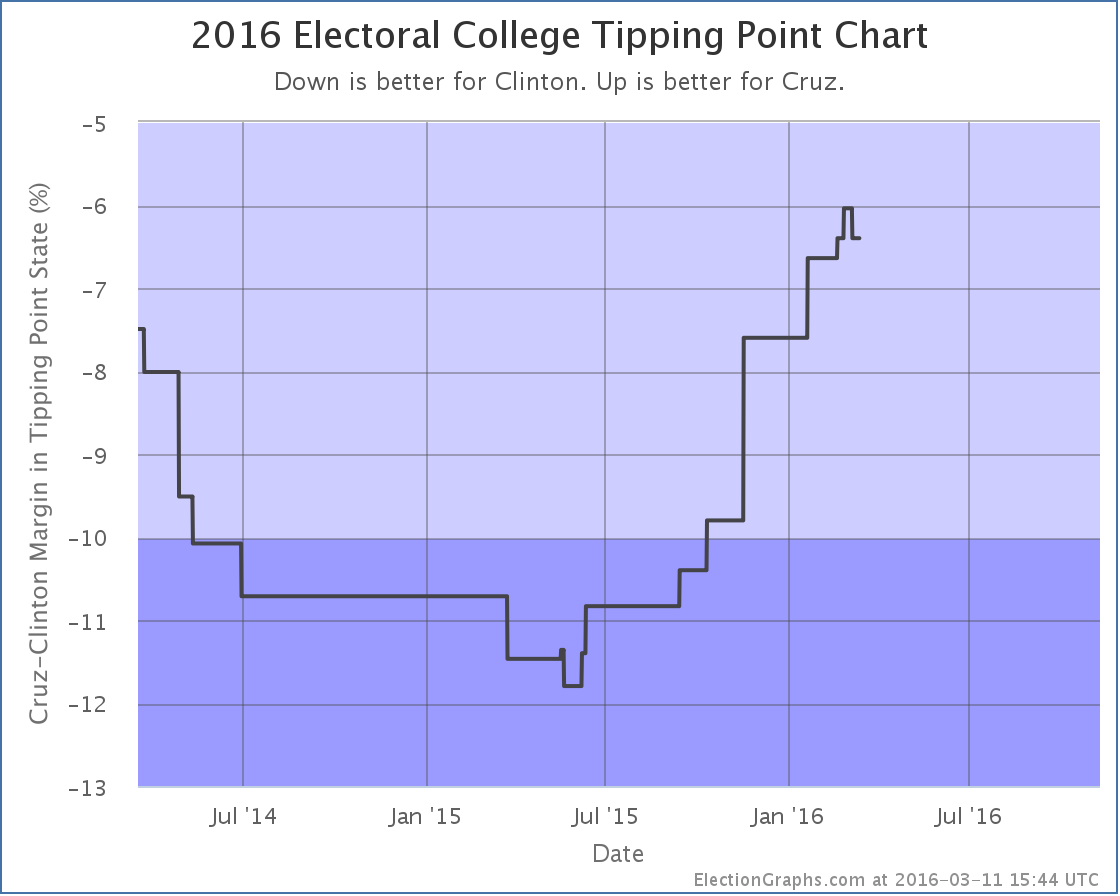
Cruz’s poll average in Florida dropped a bit. The category didn’t change (Strong Clinton) but the movement did cause Cruz’s tipping point to go from 6.0% behind Clinton to being 6.4% behind Clinton.
Either way, Cruz continues to be far behind Clinton when you look at things based on state level polls. As I have discussed here before, looking at national polls makes this matchup look much closer. It is unclear at this point if this is exposing an actual divergence between the popular vote and electoral college due to the regional distribution of candidate support, or if it is simply that there haven’t been enough state level polls of this matchup to catch up with recent changes to support levels. If Cruz becomes the Republican nominee, this would eventually become clear.
Of course, looking at the delegate race that doesn’t look too likely right now, so we may never know.
241.8 days until polls start to close.
Note: This post is an update based on the data on ElectionGraphs.com. Election Graphs tracks both a poll based estimate of the Electoral College and a numbers based look at the Delegate Races. All of the charts and graphs seen in this post are from that site. Additional graphs, charts and raw data can be found there. All charts above are clickable to go to the current version of the detail page the chart is from, which may contain more up to date information than the snapshots on this page, which were current as of the time of this post. Follow @ElectionGraphs on Twitter or like Election Graphs on Facebook to see announcements of updates or to join the conversation. For those interested in individual general election poll updates, follow @ElecCollPolls on Twitter for all the polls as they are added.
|
|


