Although the best delegate tallies are still estimates that will almost certainly change a bit before they are final, the general outline will not change. Sanders crushed Clinton in all three states that caucused on March 26th. With Washington, Hawaii and Alaska together, the delegate haul was 104 for Sanders to only 38 for Clinton.
Since the last update Sanders has also been on a roll gaining four new superdelegates (while Clinton got no new supers), and having four delegates move from Clinton to Sanders as results in states that voted earlier got finalized.
Between all that, since the 23rd the net change is Sanders +112, Clinton +34.
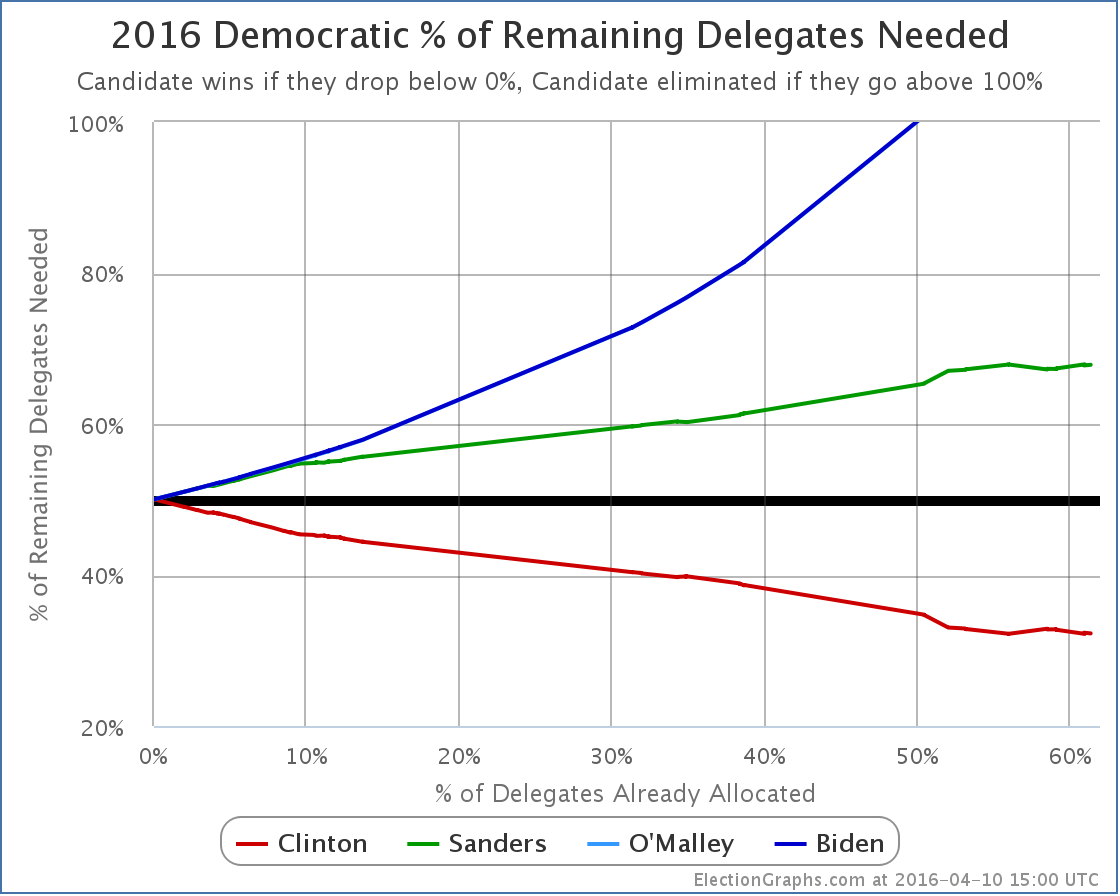
So Sanders got a whopping 76.71% of the delegates since the 23rd. That is well above the 67.70% he needed to improve his position in the race in terms of the % of the remaining delegates needed to win. So unlike some Sanders “wins” where he gets the most delegates but still just ends up in a worse position because he didn’t win by enough, this time Sanders supporters are fully justified in celebrating the win.
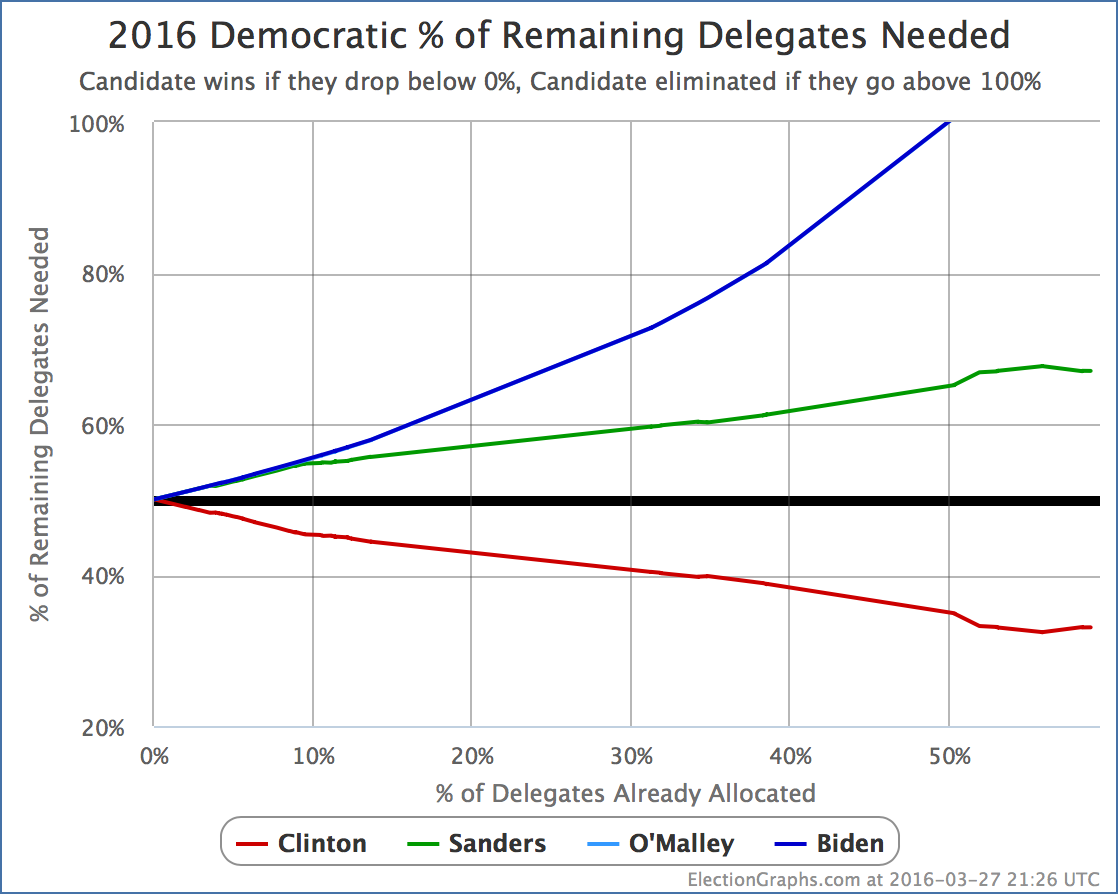
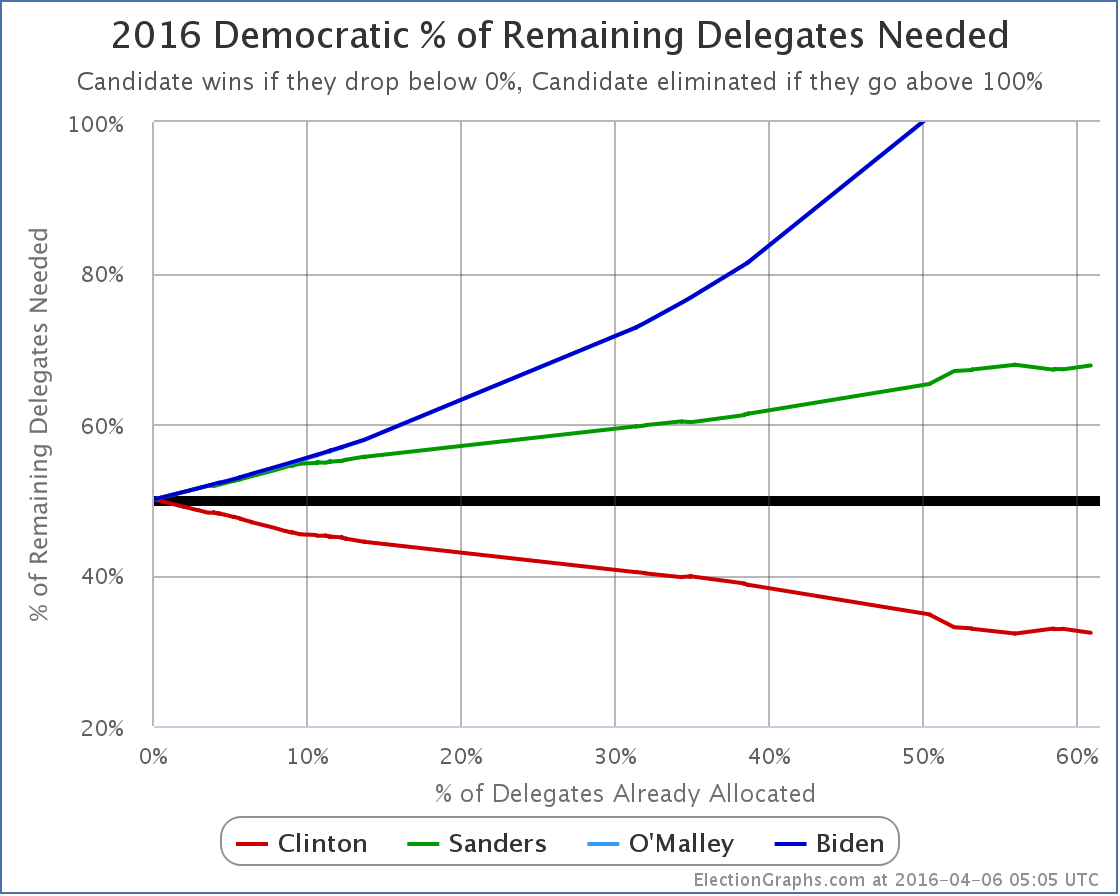
See that downward slope right neat the end of the green line? That is the improvement in Sander’s position because of these three states. Despite all the states that Sanders has won, this has not happened often. Aside from days when a stray superdelegate committed to him or when states revised their results by a delegate here or there, the only previous times so far where Sanders has improved his position are February 9th when he won New Hampshire and March 6th when he won Maine. (OK, probably Democrats Abroad too.) This new result on March 26th swamps both of those in the magnitude of the improvement.
With all of the results and adjustments since Arizona, Idaho and Utah last week, Sanders goes from needing 67.70% of the remaining delegates to win, to needing only… 67.03%.
So… an improvement of… 0.67%.
So, uh… big improvement? Suddenly the Sanders path to victory is clear? Well, it is the biggest improvement in this metric Sanders has seen yet, but…
No.
March 26th was a big Sanders win. That should not be minimized. If he matched the March 26th performance in every contest from here to the end of the primary season, he would indeed catch up to Clinton and win. And the visibility of wins like the 26th may help Clinton seem weak, and may improve Sanders’ performance in future contests.
But the basic situation has not changed significantly. 67% of delegates is still an incredibly high bar. Sanders would have to consistently meet that bar for the rest of the race in order to win outright.
But wait you say, once again this is all including superdelegates. But surely if Sanders won in pledged delegates, the superdelegates wouldn’t deny him the win and would switch to Sanders en masse because to do otherwise would be unseemly? Well, I generally reject starting with that premise and say lets watch the superdelegates and see what they actually do.
But for the moment, as I did once before, let me run the numbers pretending superdelegates don’t exist.
With supers the totals right now are Clinton 1735, Sanders 1069.5, O’Malley 1
Without supers that becomes Clinton 1264, Sanders 1040.
Without supers there are 4050 delegates, and you need 2026 to have a majority.
Sanders would need 976 more delegates to have that majority of pledged delegates. There are 1746 more pledged delegates available.
That means Sanders would need 55.90% of the pledged delegates remaining to end the season with a majority of the pledged delegates.
That bar is a LOT lower than 67%. Consistently beating 67% seems close to unimaginable without a complete implosion. But 56%? Could you get to that just through some momentum, some positive press cycles and good campaigning? Maybe. It seems like it is on the outer edge of the possible given the history so far, but still possible.
If Sanders did succeed at that, he would still need to get a large number of Clinton superdelegates to defect in order to actually win. But Sanders has said he is ramping up his efforts to woo superdelegates. He has gone from saying superdelegates should be ignored, to acknowledging that any realistic path to a win involves getting superdelegates to vote for him too.
If superdelegates do start to defect, you will of course see it on the graphs here.
One last comparison, updating the one I did two weeks ago:
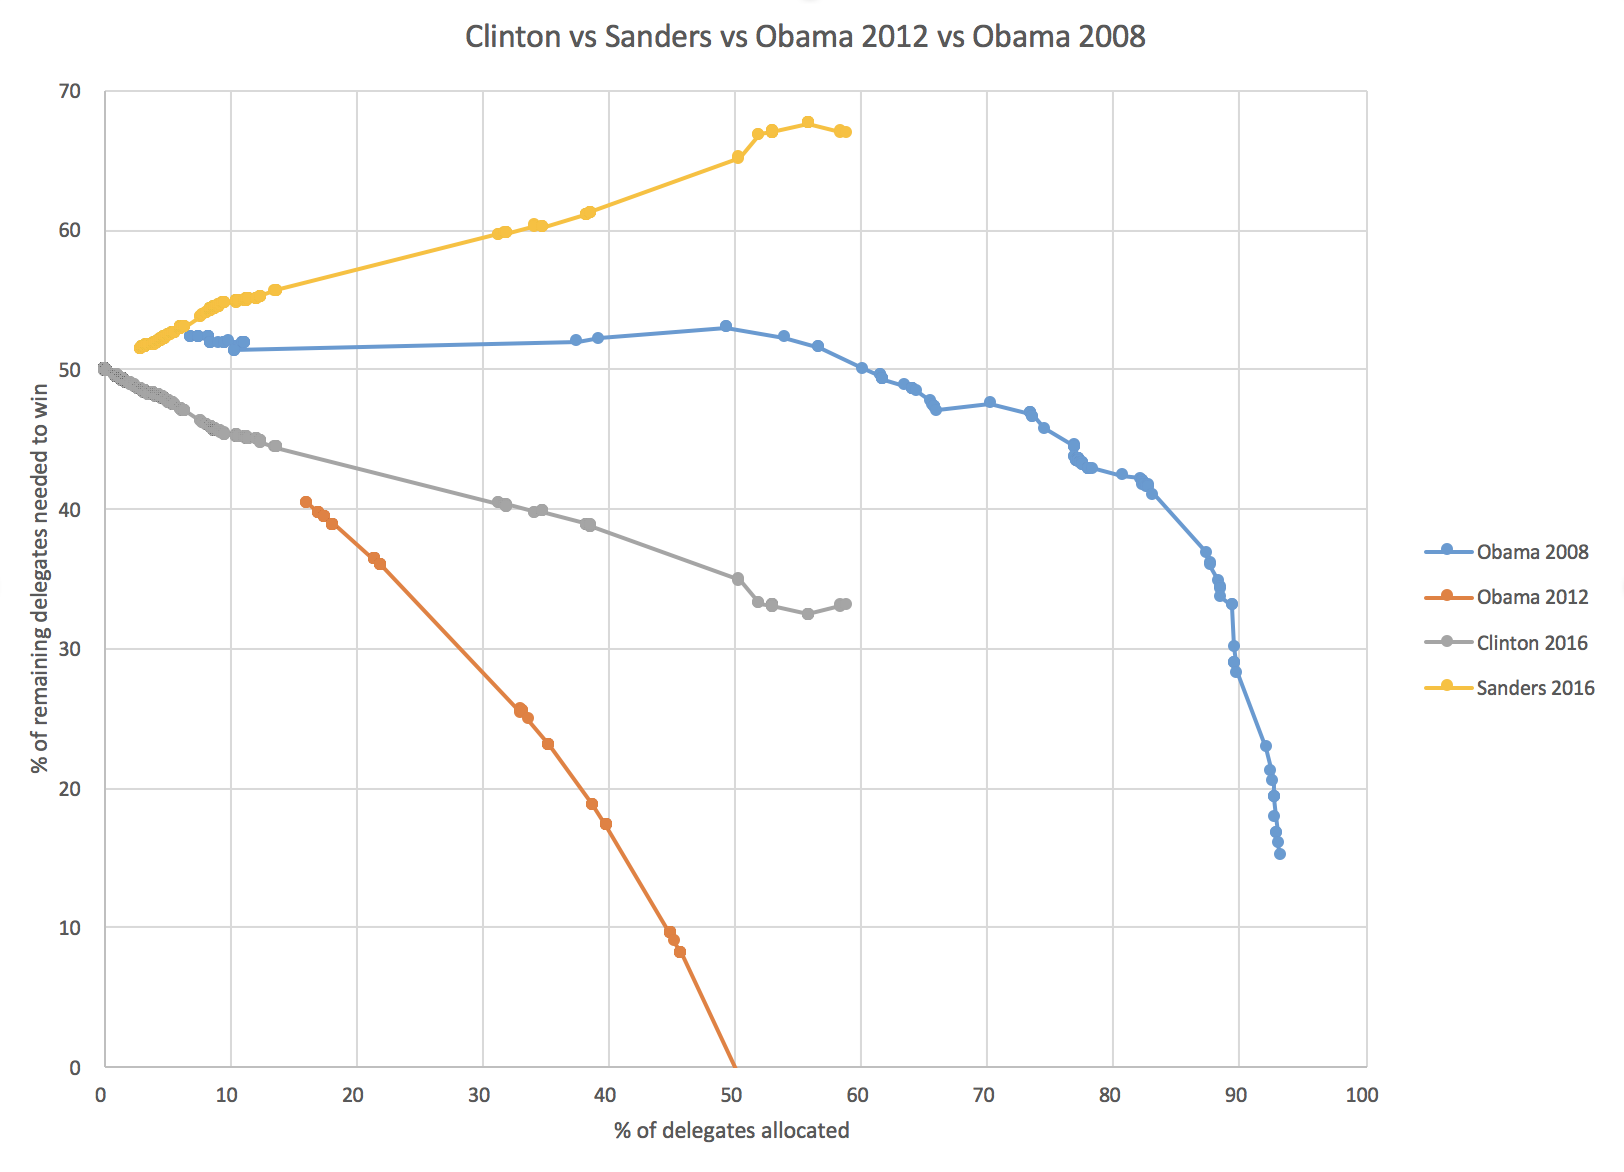
Granting for the moment the premise that the results on the 26th are not an outlier, but are instead indicative of an inflection point in the race, you see that compared to Obama 2008, Sanders starts his “turn” on the graph later (at about 56% rather than at about 49%) and that he is much much further behind that Obama was. Just barely past this point in 2008 is when Obama took the delegate lead. Sanders is far from that.
Meanwhile, Clinton is in a much stronger position than Obama was until very nearly the end.
If this is a “turn”, and Sanders drives his line down and eventually wins, it will be one of the largest come from behind wins in modern times. This is not impossible, but it is still highly unlikely.
Wisconsin is next on April 5th. Right now the RCP poll average there has Clinton 46.5% to Sanders 44.0%. If that average plays out and assuming a roughly even distribution of support throughout the congressional districts in the state, it would mean about 44 delegates for Clinton to 42 delegates for Sanders.
If that happened, Sanders would then need 67.87% of the remaining delegates to win, completely undoing the gains he made with Washington, Hawaii and Alaska.
Now, Sanders may get a boost of his recent wins and do better than the current poll average indicates. He may even win Wisconsin. The question though is not if he wins, but if he wins it by enough to actually be on a pace to catch up to Clinton before things are over. Right now, that means he needs 58 of the 86 delegates available from the Wisconsin primary.
We shall see.
[Update 2016-04-01 16:10 UTC – Superdelegate scan nets Clinton +3, Sanders +2.5. This does not significantly change the analysis above.]
[Update 2016-04-01 16:55 UTC – I found an update from Michigan which I had logged on March 10th, but had an error in it, so the totals in Michigan in the state detail table were correct, but that update wasn’t included in the national totals. Fixed now. Net change from that: Clinton +2, Sanders -2. This also does not significantly change the analysis above.]
[Update 2016-04-05 16:29 UTC – Superdelegate scan: Clinton +1. Note because Bill Clinton said something about how he would support Sanders at the convention if Sanders won, just like he supported Obama in 2008, some people are saying he should be listed as an Uncommitted superdelegate instead of a Clinton superdelegate. I don’t buy this at the moment and am continuing to list Bill Clinton as supporting Hillary Clinton.]
Note: This post is an update based on the data on ElectionGraphs.com. Election Graphs tracks both a poll based estimate of the Electoral College and a numbers based look at the Delegate Races. All of the charts and graphs seen in this post are from that site. Additional graphs, charts and raw data can be found there. All charts above are clickable to go to the current version of the detail page the chart is from, which may contain more up to date information than the snapshots on this page, which were current as of the time of this post. Follow @ElectionGraphs on Twitter or like Election Graphs on Facebook to see announcements of updates or to join the conversation. For those interested in individual general election poll updates, follow @ElecCollPolls on Twitter for all the polls as they are added.
[Edit 2016-03-28 00:05 UTC – Fixed one place I had Sanders’ name instead of Clinton.]
![]() 1-Click Subscribe in iTunes
1-Click Subscribe in iTunes![]() View Podcast in iTunes
View Podcast in iTunes![]() View Raw Podcast Feed
View Raw Podcast Feed![]() Download MP3 File
Download MP3 File![]() Follow the podcast on Facebook
Follow the podcast on Facebook
