This is the website of Abulsme Noibatno Itramne (also known as Sam Minter). Posts here are rare these days. For current stuff, follow me on Mastodon

Categories

Calendar

November 2024
S M T W T F S
 12
3456789
10111213141516
17181920212223
24252627282930

Democrats: Sanders wins the 22nd by 74 to 57. It isn’t enough.

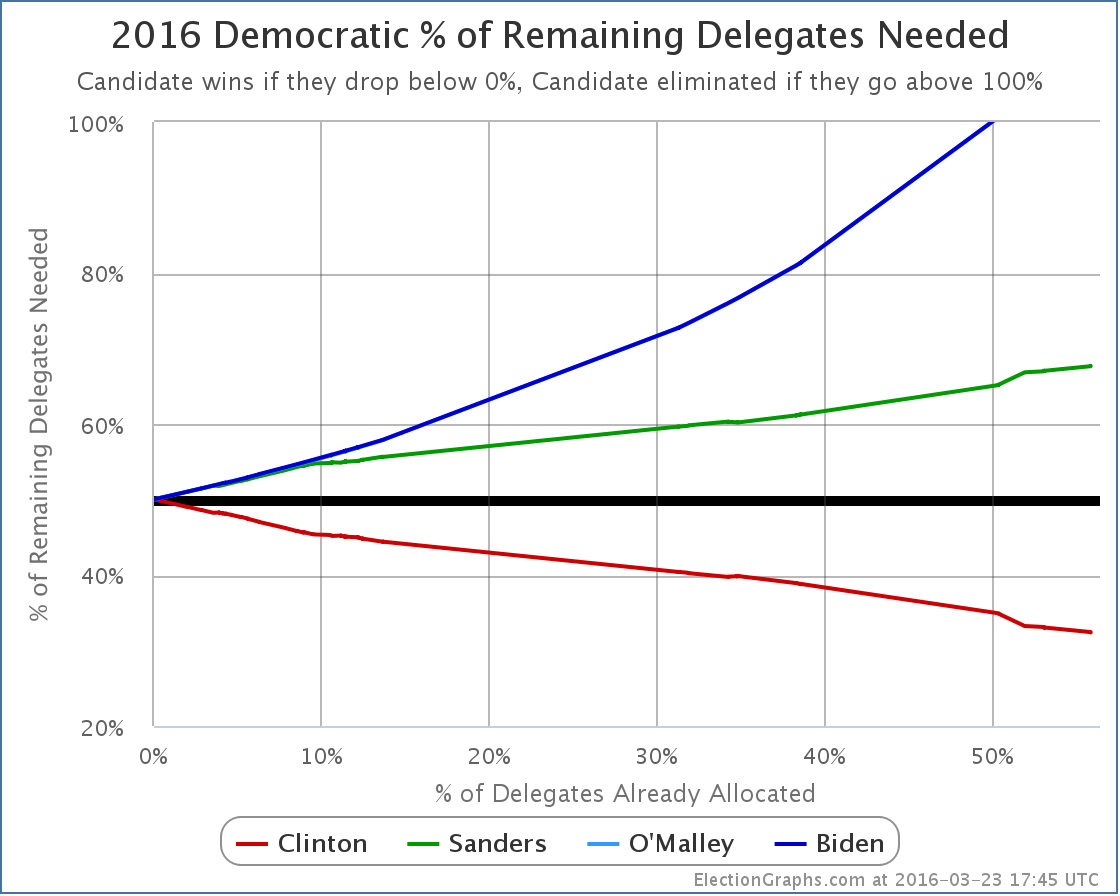
With Arizona, Idaho and Utah weighing in, Sanders won 74 delegates to Clinton’s 57. That’s a big win for Sanders. But it is only 56.49% of the delegates. To actually improve his overall position, Sanders would have needed 67.06% of the delegates. He didn’t reach that level, so the Sanders path to the nomination gets even harder.

chart-84

Also including an additional Sanders superdelegate that was added to the totals since the last update, Sanders now needs 67.70% of the remaining delegates to catch up and win. Or, as usual, a huge number of Clinton superdelegates changing their minds could change everything. That seems increasingly unlikely the closer Clinton gets to the nomination of course. But if it happens, you’ll see it here.

[Update 3/26 21:14 UTC – Updates in preparation for new results tonight. Superdelegate changes: Sanders +4. Updates from FL/GA/AZ net: Sanders +4, Clinton -4.]

Note: This post is an update based on the data on ElectionGraphs.com. Election Graphs tracks both a poll based estimate of the Electoral College and a numbers based look at the Delegate Races. All of the charts and graphs seen in this post are from that site. Additional graphs, charts and raw data can be found there. All charts above are clickable to go to the current version of the detail page the chart is from, which may contain more up to date information than the snapshots on this page, which were current as of the time of this post. Follow @ElectionGraphs on Twitter or like Election Graphs on Facebook to see announcements of updates or to join the conversation. For those interested in individual general election poll updates, follow @ElecCollPolls on Twitter for all the polls as they are added.

[Edit 18:14 to fix the date in the title.]

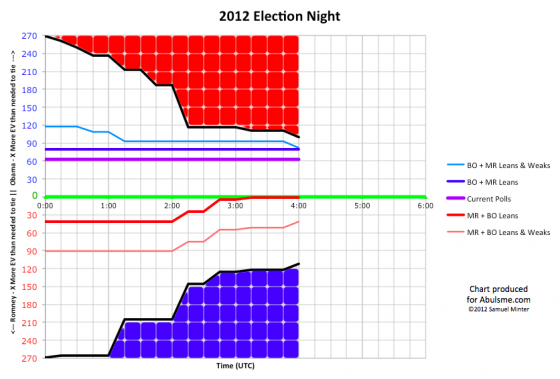
Electoral College: 04:00 – Some Expected States

Romney Obama
Romney Best Case 270 268
Current Status 206 332
Obama Best Case 190 348

With this update, there are no surprises, and no close states called, so Romney hangs on to his one glimmer of hope…

But the 04:15 update is coming soon, and the news is not good for Romney…

Electoral College: Arizona moves toward Romney again

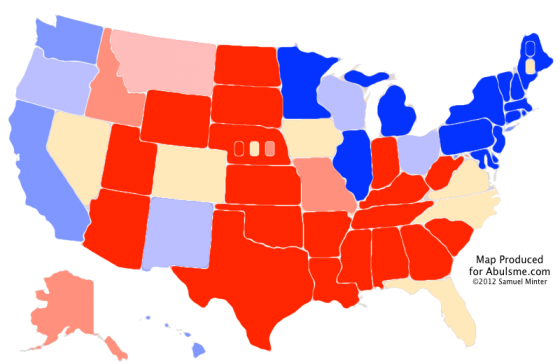
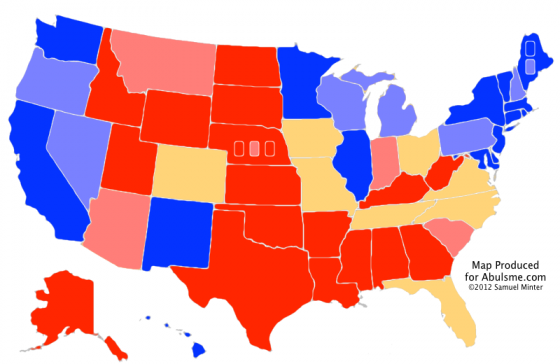
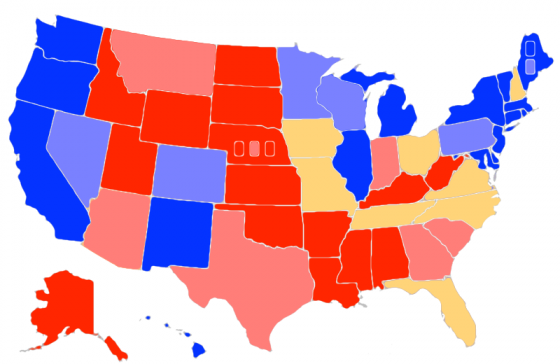
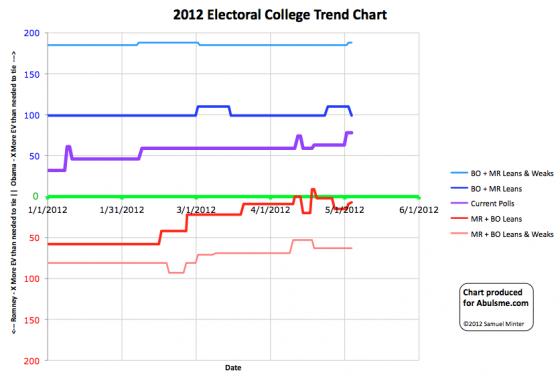
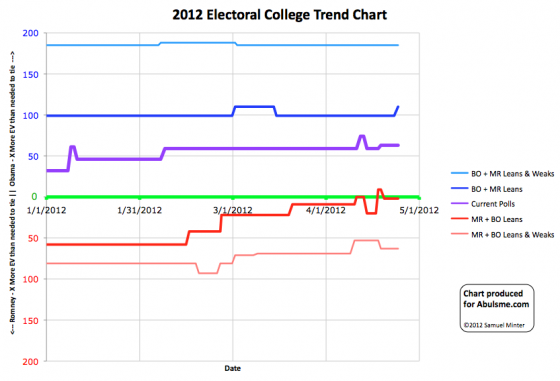
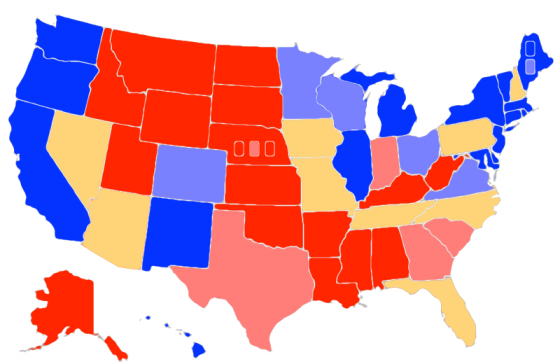
Chart and map from the Abulsme.com 2012 Electoral College Prediction page. Both assume Obama vs Romney with no strong third party candidate. Both show polling as it currently exists. Things will change before election day. On the map red is Romney, blue is Obama, gold states are too close to call. Lines on the chart represent how many more electoral votes a candidate would have than is needed to tie under several different scenarios. Up is good for Obama, Down is good for Romney.

One change today. Movement in Romney’s direction again:

So with the latest poll in Arizona, Romney’s lead in the five poll average is once again at 5% which puts it back in the “Weak Romney” category, and makes me take the possibility of Obama winning off the table in my models. This diminishes Obama’s best case by 11 electoral votes:

Romney Obama
Romney Best Case 281 257
Current Status 206 332
Obama Best Case 170 368

Obama’s best case is still better than his 2008 result of 365 to 173, but just barely.

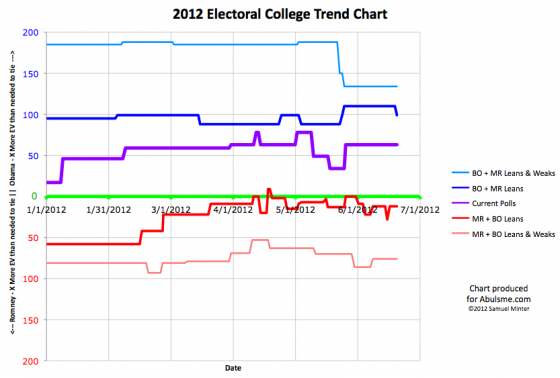
Also, all three models are at almost exactly the same places they were at the end of April. Almost two months further along, and effectively neither candidate has moved the needle at all. Some bouncing of the numbers up and down a little bit in between, but net… no change. (Well, Romney’s best case was SLIGHTLY better, by 3 electoral votes, back at the end of April… but close enough.)

One of the things I keep saying is that while Obama’s lead in these models is substantial, and if the election was held today, an Obama victory would be a pretty safe bet… it is important that the election is NOT today, and there is still plenty of time for things to change. So far though… the situation is remaining pretty static. So if Romney wants to change this picture, he really should get started at some point.

Conventional wisdom of course is that most voters don’t start paying attention until the conventions… which start at the end of August. So we may have another two months of doldrums to live through before things start getting lively and the polls start moving more.

Electoral College: Georgia goes Deep Red, Arizona Swings Again

Chart and map from the Abulsme.com 2012 Electoral College Prediction page. Both assume Obama vs Romney with no strong third party candidate. Both show polling as it currently exists. Things will change before election day. On the map red is Romney, blue is Obama, gold states are too close to call. Lines on the chart represent how many more electoral votes a candidate would have than is needed to tie under several different scenarios. Up is good for Obama, Down is good for Romney.

Two states change status today. One moving toward Romney, one moving toward Obama:

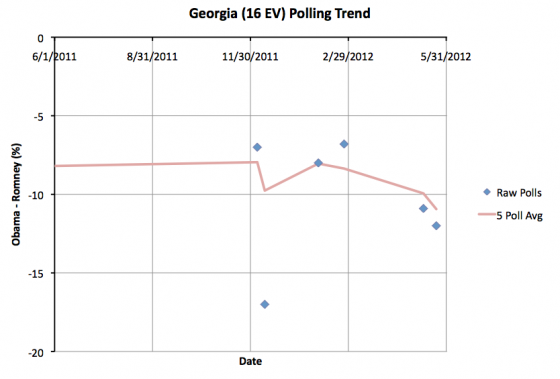
First up, Georgia with its 16 electoral votes. Like Texas a couple days ago, Georgia is one of those states that nobody thinks will be a swing state, but some polling was showing it closer than one might expect, leading one to think that Romney might have wanted to spend at least a little time and money on shoring it up. The latest polls though have Romney’s lead there in my five poll average going over 10%. This moves it into the “Strong Romney” category which generally are quite safe for Romney and therefore can effectively be ignored in the campaign. These moves from Weak to Strong don’t change the range of outcomes in my model, but they do show Romney’s consolidation of his base states.

Second we have Arizona. This has been bouncing back and forth, over and under the Romney 5% lead line in the five poll average. With today’s update, the 5 poll average drops below 5% again, so we once again classify it as a Lean Romney Swing State. Now, the five poll average in Arizona has never shown Obama actually ahead in Arizona (although a couple individual polls in the last year have), so Arizona is not as swingy as, say, Florida or North Carolina, where the actual lead keeps changing hands. But it is close enough that the lead could be wiped out in a few days depending on the news cycle. So, for the moment, Arizona swings again.

In terms of our summary, since Georgia was never considered a real Obama possibility, only Arizona causes a change, improving Obama’s best case by 11 electoral votes:

Romney Obama
Romney Best Case 282 256
Current Status 235 303
Obama Best Case 159 379

Note 2012 Jun 8 15:00 UTC: A correction noted June 8th moved a Tennessee change from “Weak Romney” to “Lean Romney” from March 2nd to May 24th, which would have been the day before this post. Updates between March 2nd and this post therefore incorrectly classified Tennessee.

Electoral College: PA and AZ stop swinging, OH swings again

Chart and map from the Abulsme.com 2012 Electoral College Prediction page. Both assume Obama vs Romney with no strong third party candidate. Both show polling as it currently exists. Things will change before election day. On the map red is Romney, blue is Obama, gold states are too close to call. Lines on the chart represent how many more electoral votes a candidate would have than is needed to tie under several different scenarios. Up is good for Obama, Down is good for Romney.

Today is an exciting day. THREE states change categories.

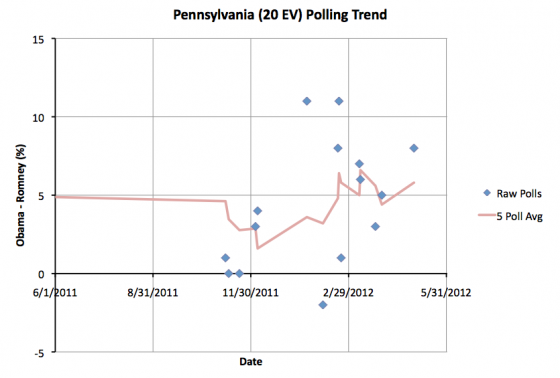
First up, Obama’s lead in Pennsylvania moves over 5%, so we pull it out of swing state status again. We’d listed Pennsylvania as a swing state since April 14th. The five poll average now has Obama up by 5.8%. This is still pretty close to the boundary, so a poll or two in Romney’s direction could pull Pennsylvania back, but for now we no longer consider Romney winning PA in our “Romney Best Case” scenario.

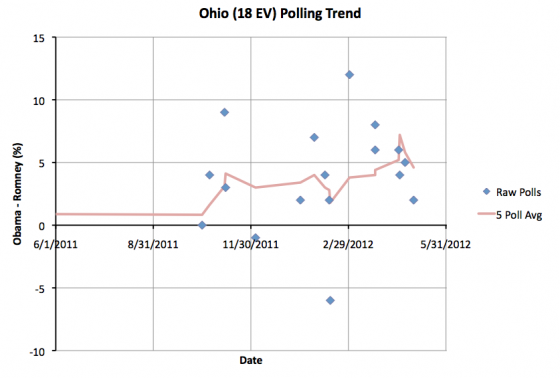
Second, Ohio gets tighter. Obama’s lead drops to 4.6%, which means I consider it a swing state again, and Romney’s best case scenario now includes Ohio. Ohio has usually been considered a swing state, and our five poll average only showed a greater than 5% lead for Obama from Apr 20 until today… two weeks. So this is a return to Ohio’s “normal” status. Ohio (18 ev) moving back toward Romney balances the Pennsylvania (20 ev) move, so the overall loss to Romney’s best case is only 2 electoral votes.

Third, Arizona moves back toward Romney. There has been talk of Arizona being a red state that Obama may be able to pick off and win. For the moment though, that looks less likely. According to my definition, I consider states to be swing states if the lead in the five poll average is LESS than 5.0%. At the moment the five poll average in Arizona is EXACTLY a 5.0% Romney lead, so the state moves back into “Lean Romney”. So I take winning Arizona off the table for Obama. At least for the moment. One poll could bring it back.

Between all three of these changes, the net affect is to narrow the range of possibilities between our Obama best case and Romney best case scenarios. Obama’s best case is worse by 11 electoral votes, and Romney’s best case is worse by 2 electoral votes.

Romney Obama
Romney Best Case 276 262
Current Status 191 347
Obama Best Case 170 368

Romney’s best case remains very narrow. In order to win the presidency, he needs to win all of the states where he is currently ahead, including Tennessee (11 ev) and Missouri (10 ev) where polls currently show his lead is slim, then he MUST win Florida (27 ev), Ohio (18 ev), North Carolina (15 ev) and Virginia (13 ev), all of which are states where Obama is currently ahead by a narrow margin. Then he needs to win either Iowa (6 ev) or New Hampshire (4 ev) both of which are also leaning Obama at the moment.

Edit 2012 May 4 18:07 UTC – Corrected map, I had forgotten to color Ohio gold.

Electoral College: Arizona Swings Again

Chart and map from the Abulsme.com 2012 Electoral College Prediction page. Both assume Obama vs Romney with no strong third party candidate. Both show polling as it currently exists. Things will change before election day. Lines on the chart represent how many more electoral votes a candidate would have than is needed to tie under several different scenarios. Up is good for Obama, Down is good for Romney. On the map red is Romney, blue is Obama, gold states are too close to call.

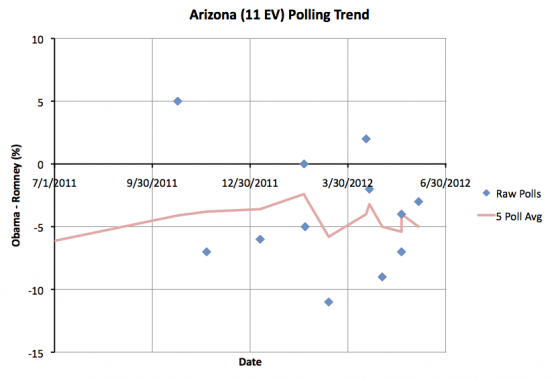
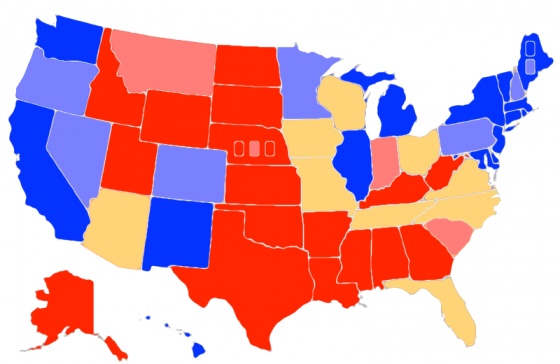
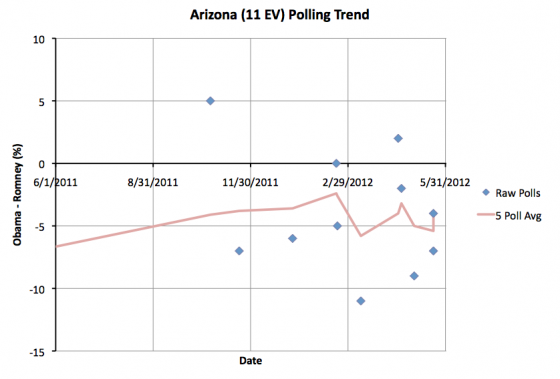
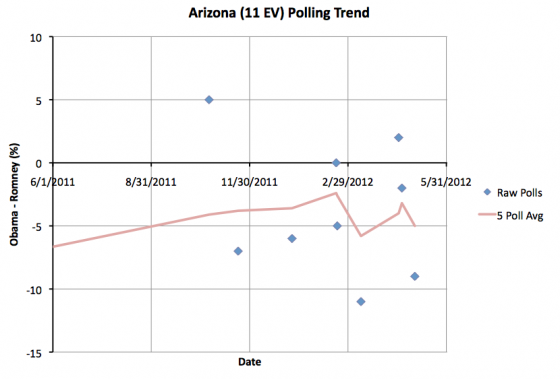
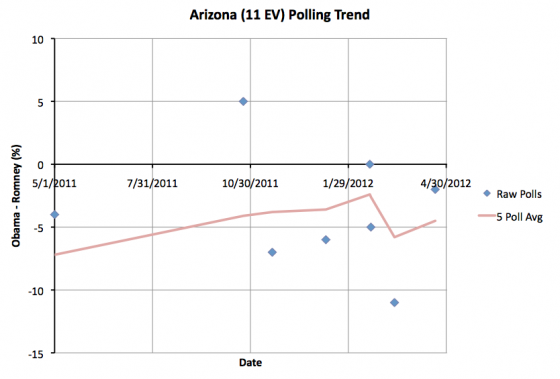
Today Arizona moves from “Weak Romney” to “Lean Romney”, which makes it a swing state in our model.

Starting with this update, when a state changes status, I’ll also show the polling history for that state, so the trend is visible.


Looking at the above you can see that the last five polls goes back more than three months. You can see the spread within those five polls. Seeing this information visually can help interpret the movement being discussed. In this case, Arizona goes back into the swing state category after a relatively short period as a “Weak Romney” state (since March 16th). There are a couple data points that look like they might be outliers but which still affect the average. And of course you can see that the 5 poll average is just barely in the less than 5% swing state zone. The next poll could easily change the category again.

This change improves Obama’s “best case” where we give him all of the swing states.

Romney Obama
Romney Best Case 271 267
Current Status 206 332
Obama Best Case 170 368

I’ll also note that movement in the national level polls toward Romney we talked about in previous updates seems to have been short lived. Looking at the RCP Poll Average Obama dropped from a lead of 5.3% on April 11th to a lead of only 1.7% on April 18th, but as of April 24th has rebounded to a lead of 3.7%. If the move toward Romney had been sustained, I would have expected to see a lot of state polls moving in Romney’s direction over the next few weeks. With the current trend that is no longer a safe assumption.

As things ebb and flow we will probably see movement toward Romney, but it won’t be the state polls catching up to the Romney spike of last week. It would be new changes based on new events.

But my general philosophy is that while the national polls are a leading indicator for the state polls and there is a strong correlation between the national popular vote and the electoral college, the real race is still the 50 separate state elections. That is how presidential elections work. So one gets a better picture of the dynamics by looking at the state numbers… although you need to be cognizant of the slower pace of state polling and interpret things accordingly. So we shall not speak of national level polls again.

Uh, unless there is something really interesting there to talk about. :-)

Edit 2012 May 2 13:08 UTC – Adjusted horizontal scale on Arizona graph

Electoral College: Arizona Stops Swinging, Goes Light Red

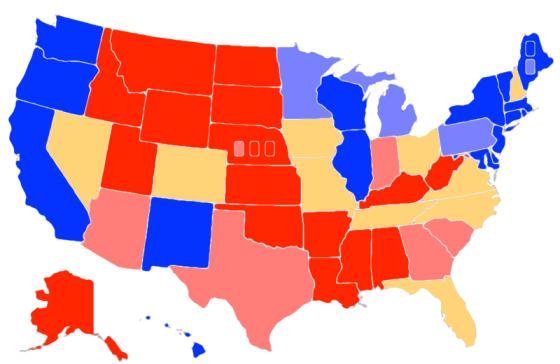
Map from the Abulsme.com 2012 Electoral College Prediction page. This map reflects Obama vs Romney. If any other candidate takes the lead in the Republican delegate race we’ll switch to making maps for them. This reflects the current state of polling, which of course will change drastically as the campaign progresses from now until November.

The latest update in my five poll averages puts Romney’s lead in Arizona over 5%, so the state moves out of the “Lean Romney” swing state status to “Weak Romney” indicating Romney’s lead is more than 5% but less than 10%. This moves Arizona out of the list of states that could easily go either way, and reduces the margin in Obama’s “Best Case” Scenario.

Romney Obama
Romney Best Case 291 247
Current Status 210 328
Obama Best Case 170 368

And the trends over time…

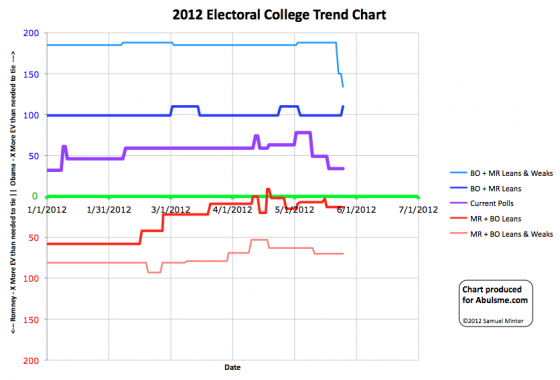
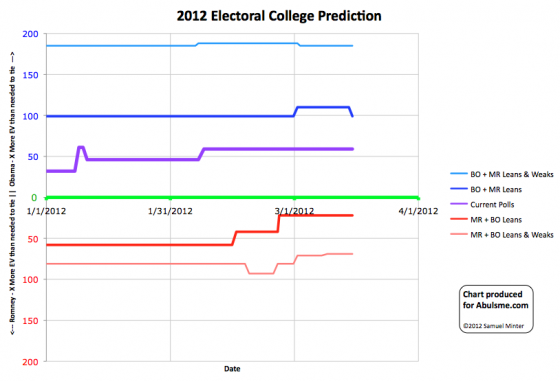
Chart from the Abulsme.com 2012 Electoral College Prediction page. Lines represent how many more electoral votes a candidate has than is needed to tie under several different scenarios. This chart reflects Obama vs Romney. Lines moving up indicate Obama’s situation improving, lines moving down indicate Romney’s situation improving. If any other candidate takes the lead in the Republican delegate race we’ll switch to making charts for them.

Curmudgeon’s Corner: A Lot of People Were Confused

In the latest Curmudgeon’s Corner…

Sam and Ivan talk about:

  • Michigan and Arizona / Stupid things Candidates Say
  • Decline of the PC / Windows 8
  • Google and Privacy

Just click to listen now:

[wpaudio url=”http://www.abulsme.com/CurmudgeonsCorner/cc20120226.mp3″ text=”Recorded 26 Feb 2012″]

or

1-Click Subscribe in iTunes

View Podcast in iTunes

View XML Feed

Gaming out Arizona and Michigan

OK, we have a couple states coming up in the next week, and a lot has been made about what happens if Santorum wins, etc. Now, a lot of that analysis is based on the momentum Santorum would gain going into Super Tuesday, but lets just look at the delegates for a minute, and see what would happen under various scenarios.

First thing to remember for all this is the way the delegates are allocated. Arizona is winner takes all with 29 delegates at stake. Michigan is more complicated. 30 delegates are at stake. A grand total of TWO delegates are determined proportionately based on the state wide primary results. (So these will almost certainly just be 1 each to the top two candidates unless it is a blow out.) The other 28 delegates are allocated winner take all by congressional district. Michigan has 12 congressional districts, each district determines 2 delegates. So in Michigan, the delegate result depends quite a bit on how candidate’s support is distributed geographically, the overall statewide numbers will not tell the whole picture.

Second item before we start looking at scenarios… where we are in the polls right now:

And of course the starting point for all this is the current state (as of February 25th) on my Delegate Count page. (Sources and methodology and such explained there.)

OK, so now looking at a few possibilities, in order from best for Romney, to best for Santorum. Note that the actual results will not likely exactly match any of these scenarios, but rather these give several types of results that characterize the kinds of outcomes that might happen.

Scenario 1

First up, current polling, plus Romney’s support in Michigan is uniform across the whole state, so he wins all of the congressional districts too. Result in this scenario, Romney gets 58 delegates for the night, Santorum gets 1.
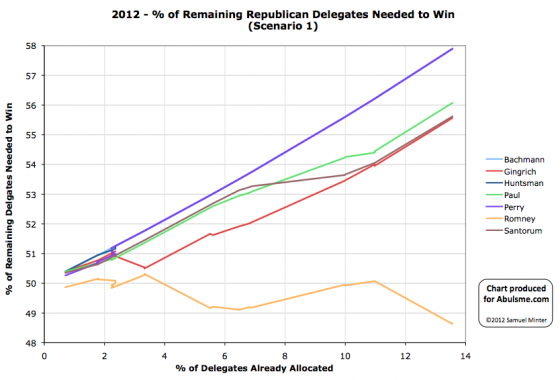
OK, obviously Romney is the big winner here. He moves down (toward the nomination) significantly. He only needs about 48.6% of the remaining delegates to win. The closest competition would still be Gingrich, although Santorum would only be one delegate behind. Gingrich and Santorum would both need about 55.6% of the remaining delegates to catch up and win. Still not an impossible number if Romney completely collapses, or even if one of them drops out and the other gets all their support (plus a bit). And with some wins in big winner take all states, it could be done. But 55.6% is starting to be a big number. And it is a LOT more than the 14.5% of the delegates these two would have gotten so far. The “catch up and win” possibility gets much further away with this result. And even the “Stop Romney from winning” possibility gets further away, as Romney continues to pile up the delegates.

Scenario 2

OK, now lets take current polling, but pretend the results in the various districts is such that the districts divide in about the same way as the popular vote goes between the two top candidates. Essentially in this scenario, Romney and Santorum split Michigan with 15 delegates each. (And Romney still wins Arizona.) So for the night, Romney gets 44 delegates and Santorum gets 15. Please note, and this is important: You get essentially the same result here regardless of who actually wins the state popular vote! As long as it is close, and the candidates essentially split the congressional districts, you get this sort of result. Depending on how many CDs are actually won by each candidate, you move the numbers a little, but the essential result is the same. With this kind of result, the state popular vote bragging rights matter ONLY to the media narrative that will build (and therefore any effects on later contests)… but they do NOT matter to the actual delegate numbers.
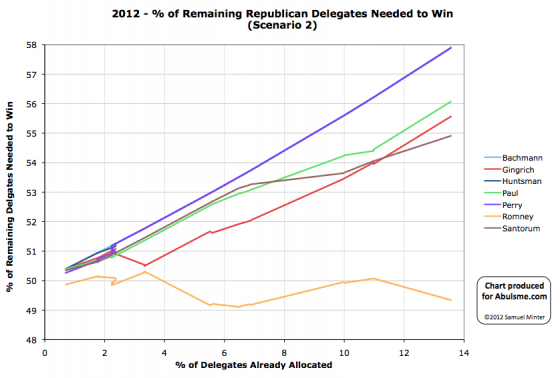
Romney is still the only winner here. It is clearly not as big a win, but Romney still makes his “% of remaining delegates needed to win” go DOWN, and go down to under 50%. Santorum, despite getting some delegates, is still in a worse position than when he started the night. Before he needed 54.1% of the remaining delegates to catch up and win the nomination, now he needs 54.9%. Santorum does pull ahead of Gingrich though, and put himself clearly into second place. But the three non-Romney’s in this situation are still all heading upward (toward being mathematically eliminated), none of them has started to actually move down toward catching up and winning. Romney in this situation does improve a bit here, but also still isn’t breaking out downward yet. He is still hovering in the zone where his opponents (collectively) only have to do a little bit better to block him from getting the nomination. Note that they do have to do better though. Paul, Gingrich and Santorum could keep getting delegates at the same rate, and Romney would still get the nomination, it would just take awhile.

Scenario 3

OK, now lets say Santorum reverses the poll momentum and ends up winning the popular vote in Michigan. As mentioned above, if his support is “lumpy” around the state, and both Romney and Santorum end up getting significant numbers of delegates, then we just have Scenario 2, plus or minus a few delegates depending on exactly how many congressional districts each candidate wins. So for this scenario, lets pretend that Santorum actually wins with his support uniformly distributed across the state and Romney wins no congressional districts. Then we have Santorum getting 29 of the state’s delegates, and Romney getting only 1. So for the night that would make it 30 delegates for Romney, 29 for Santorum. Note that despite Santorum “winning” Michigan, Romney still gets more delegates for the night because of Arizona and the 1 proportional Michigan delegate.
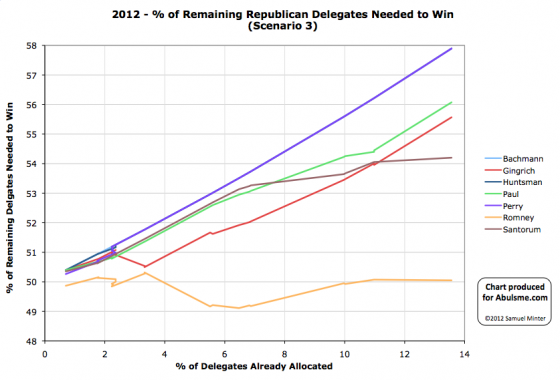
Romney is STILL the only actual winner in this situation… although just barely. He goes from needing 50.07% of the remaining delegates to win, to needing 50.05% of the remaining delegates to win. Essentially he is flat.

Santorum, despite winning Michigan in a pretty convincing way, is still worse off than coming into the day. Going in he needed 54.1% of the remaining delegates to win, now he needs 54.2% of the remaining delegates. But essentially this is flat. Once again though, Santorum does pull head of Gingrich (by an even bigger margin than Scenario 2 of course) and plants himself solidly in second place. (Although still quite a long ways back from Romney).

This scenario does however keep Romney hovering around the 50% of remaining delegates needed to win line, while having gotten just 50% of the delegates so far. This is the path to getting 1144 at the last possible moment before the convention. Obviously Romney would like to do a bit better than that as just the slightest misstep at this rate of delegate collection could cause him to end up just short of the magic number.

Scenario 4

OK, now lets imagine that Santorum comes back from behind unexpectedly in Arizona, but at the same time Romney consolidates Michigan and wins there in every congressional district. Since this involves momentum going in different directions in different states, this seems unlikely, but lets include it for completeness.
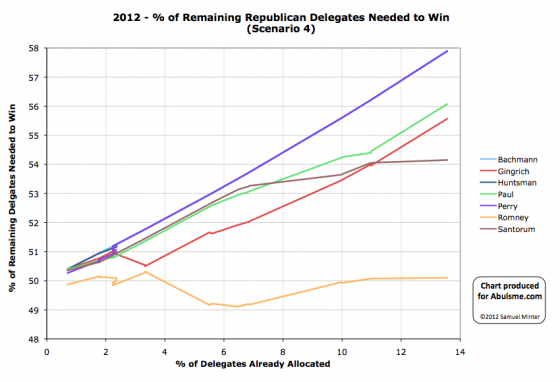
In this scenario EVERYBODY LOSES. Nobody gets enough delegates to actually be on a pace to win the nomination. Santorum does pull ahead of Gingrich, so there is that. And he does win the night. But just barely. And not by quite enough to actually be catching up fast enough to get to 1144.

Scenario 5

Romney and Santorum split Michigan (either might win the popular vote, but they split the congressional districts), but Santorum does a come from behind victory in Arizona. So for the night we get 44 delegates for Santorum and 15 for Romney.
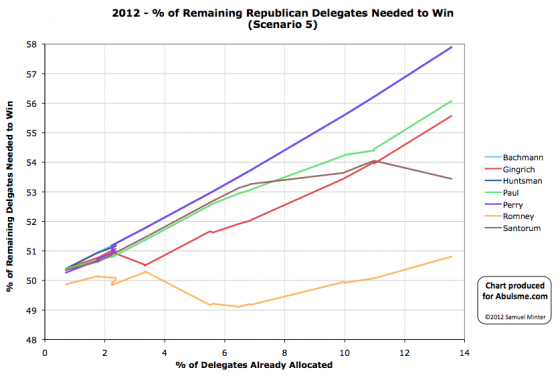
We now for the first time have a situation where Santorum actually clearly wins the night. His “% of remaining delegates needed to win” actually drops… from 54.1% down to 53.4% of the remaining delegates. Meanwhile, Romney gets knocked backwards. Rather than needing just 50.1% of the remaining delegates he now needs 50.8%.

Now, Romney is still in the lead here, and by a decent margin, but with a result like this for the first time since Gingrich won South Carolina, someone would actually be improving their position in the race versus Romney.

Scenario 6

Once again we imagine the Santorum upset in Arizona, but this time combine it with the widespread win in all Michigan congressional districts. This is Santorum’s dream scenario. Here he gets 58 delegates for the night compared to only 1 for Romney.
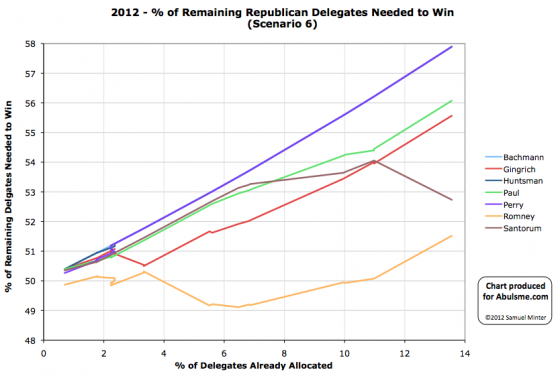
Here Santorum wins the night decisively.

After a night like this, Romney would still be ahead, but would be back below 50% of the delegates allocated so far and he would actually be moving quickly away from the nomination rather than closer to it, and Santorum would be gaining at an alarming rate. Of course, winning a winner take all state, plus almost all of the delegates from another state will do that. Romney would be in deep trouble in this scenario and while sell behind, Santorum would now be nipping at his heels.

Conclusion

All the hype is about Michigan because it is close. And because a Santorum win there will get everybody excited about “momentum”. And indeed, that kind of victory followed by the media frenzy that followed, could indeed move poll numbers in the subsequent states, most critically the Super Tuesday states…

But in terms of where the delegate race stands today, Michigan is not enough. For Santorum to actually get a substantive victory on Tuesday, not just one that he hopes will lead to bigger victories down the line, then he HAS to win Arizona too. The only situations where Santorum is actually on a pace to win the nomination himself are ones where he wins Arizona as well as a substantial number of the congressional districts in Michigan. Even with a widespread win in Michigan where Santorum wins all 14 congressional districts, if he loses Arizona, then Romney still gets more delegates for the night, and Santorum isn’t on a pace to catch up.

Of all the scenarios above, my best guess is that we will be closest to Scenario 2 than anything else. Which would mean that regardless of the state wide popular vote winner, Santorum and Romney split the Michigan delegates, and Romney wins Arizona. Which is a win for Romney in the delegate race, and by a decent margin.

Of course, if Santorum does win Michigan’s overall state popular vote, expect all the talk to be about that and the momentum he gets out of it. We won’t hear much about how actually Romney is closer to the nomination than he was before, even despite the Michigan result.

If Santorum does pull off a surprise in Arizona though… well, that is a completely different story.

Edit 2012 Feb 26 16:02 UTC for minor wording clarification.

Edit 2012 Fev 29 14L57 UTC to fix typo.
Curmudgeon’s Corner: Descent into Chaos

In the latest Curmudgeon’s Corner…

Sam and Ivan talk about:

  • Texas / Illegal Immigration
  • Mountain Lion / Useful Apps
  • Obama Frustration / Tea Party Frustration / Arizona and Michigan
  • Santorum on Contraception, Sex and Religion / Gaming the Race

Just click to listen now:

[wpaudio url=”http://www.abulsme.com/CurmudgeonsCorner/cc20120219.mp3″ text=”Recorded 19 Feb 2012″]

or

1-Click Subscribe in iTunes

View Podcast in iTunes

View XML Feed