This is the website of Abulsme Noibatno Itramne (also known as Sam Minter).
Posts here are rare these days. For current stuff, follow me on Mastodon
|
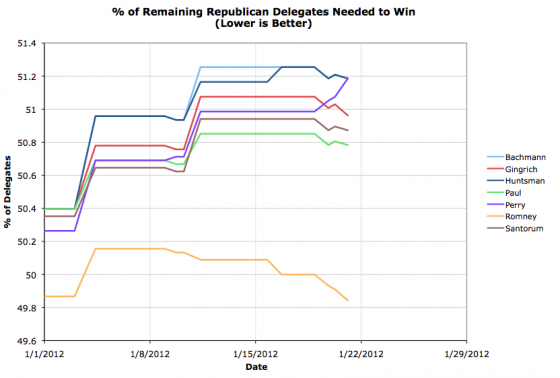
So, as we approach the voting in South Carolina, a few delegate shuffles. Perry’s 3 projected delegates from Iowa get put back into the undetermined category, Gingrich gains one super delegate, and Romney gains one superdelegate. All in all this improves everybody’s position except Rick Perry, although it is best for Romney. So here we are. We’ll see what South Carolina does to all this. In the mean time though, lets do a quick look using a different view:
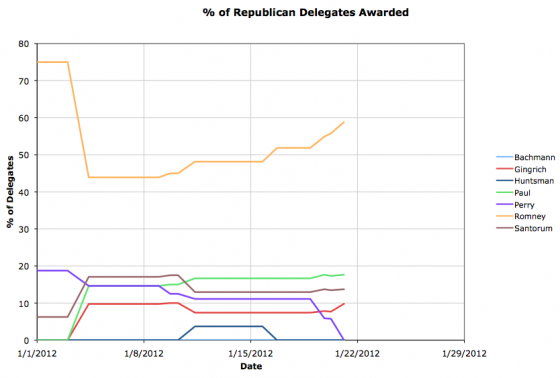
This is the percentage of delegates each candidate has so far. Our Top 4 are: 58.8% Romney, 17.6% Paul, 13.7% Santorum, 9.8% Gingrich. But I wanted to compare, by looking at where we were four years ago.
My most recent update post four years ago is here: Delegate Graphs with Preliminary Results from Nevada and South Carolina Republicans. Now, the primary schedule was a bit different, so there were already some results from South Carolina and Nevada, but where were we?
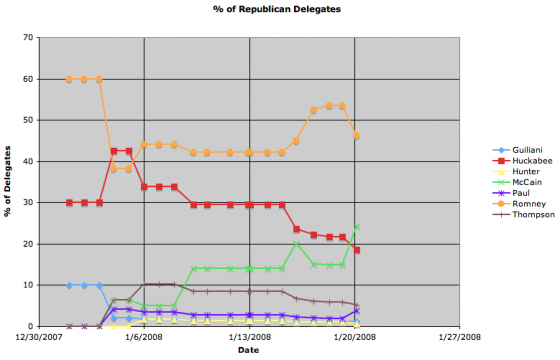
What were the Top 4 back then? 46.2% Romney, 24.4% McCain, 18.6% Huckabee, 5.1% Thompson.
That’s right, at this time in 2008, Romney was ahead in the delegate race. Romney. Not McCain. McCain had just had a big success in South Carolina, which was enough to pass Huckabee and start talk about him being the front runner and how Romney was vulnerable. McCain wouldn’t pass Romney in delegates until January 30th after Florida voted (and then he didn’t look back). So where we are on January 21st isn’t necessarily predictive of the final result.
The dynamics are of course very different this time around. I just mention all this to point out that it is indeed still early. If Gingrich DOES pull out a major victory in South Carolina, taking the lion’s share of the delegates there, then that DOES change the dynamics of the race quite a bit. Romney still has a variety of systematic advantage even in that scenario, but it could make things more interesting for awhile longer!
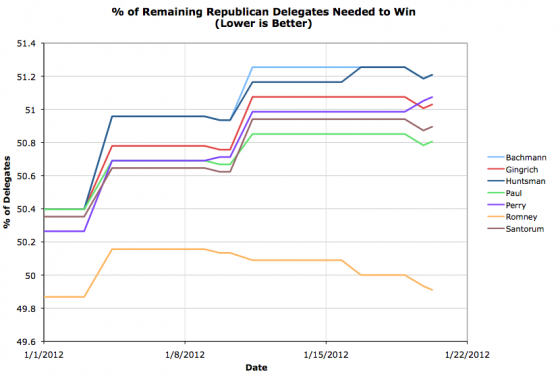
DCW tracks one of the former Perry Delegates endorsing Romney, further enhancing Romney’s delegate count on his march to the nomination.
Having said that, recent polls clearly show the possibility of Gingrich taking the day in South Carolina this weekend. What will this mean with delegates?
Well, South Carolina has 25 delegates. 11 go to the overall winner of the popular vote in the state. Then 2 delegates are awarded to the winner of the popular vote in each of the 7 congressional districts.
So, the Gingrich best case is that he takes the overall win in the state, and his support is evenly distributed geographically, meaning he wins all 7 congressional districts. In this best case, he gets all 25 delegates from the state. If this actually happened, it would put our delegate count at 29 for Gingrich and 29 for Romney… a tie for the lead.
On the other hand, by the same logic, in Romney’s best case, if Gingrich falls short, and Romney gets the majority overall and wins the 7 congressional districts and thus gets all 25 delegates, he will have 54 delegates, with the next closest candidate being Ron Paul with only 9. That is a considerable lead.
With the latest polls having Romney and Gingrich neck and neck, either one of these is possible, although it is probably more likely that at least some of the 7 congressional districts will go for someone other than the statewide winner, leading to the “winner” (whoever it is) taking more than 11 delegates, but less than 25…. which will result in Romney still being ahead.
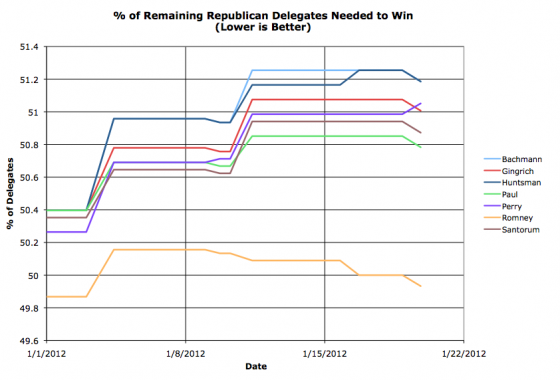
So, this morning Rick Perry announced that he was out. As such our source at DCW put the 3 superdelegates who had endorsed him back into the pile of available delegates. As of today’s update, our source at The Green Papers hasn’t yet reallocated the 3 delegates they estimated that he would eventually get via the process in Iowa. The Iowa process is complex, so it is unclear the best way to reallocate those projected delegates. The real answer of course is that no delegates have actually been allocated in Iowa yet, but Green Papers tried to estimate as well as possible what will eventually come out of that process. As they change their estimate (if they change their estimate), we’ll change the values here too.
Bottom line though, like just about everything else lately, the result of all this is “Good News for Mitt Romney”. His lead in the delegate race continues to mount. The other non-Romney, non-Perry candidates are actually helped slightly by this (because at least in theory these three superdelegates are now up for grabs again) but they still pretty far back.
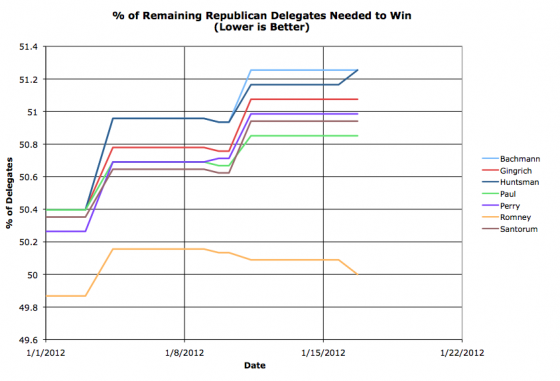
Nominally when a candidate drops out their delegates become free agents, but in practice if a candidate endorses another candidate, the delegates fall in line and vote for the person their candidate endorsed, at least for delegates from the primary and caucus process. My source for these delegates, The Green Papers, uses that presumption for their “soft count” (which is what I am using), so today we have Huntsman’s two delegates jumping over to Romney.
This also puts Romney back in the best position he has been in before voting started. He now has more than 50% of the delegates so far, which means he needs less than 50% of the remaining delegates to win. Another way to put that is that he doesn’t even have to match his performance so far to win. For the rest of the race he can do WORSE than he has done so far (including superdelegates!) and he will still win. The other candidates have to IMPROVE their performance in order to catch up and win. The amount they have to improve by isn’t completely out of the realm of contemplation yet, but it is getting higher.
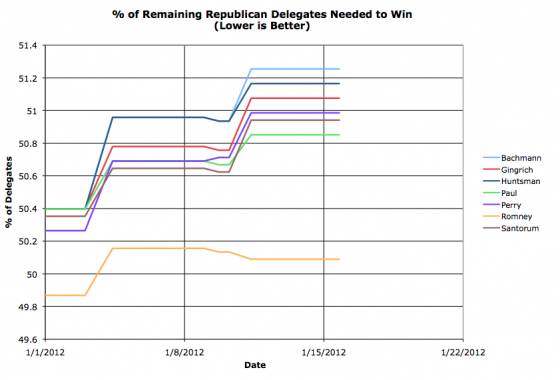
OK, so I don’t like to make retroactive changes to the graphs, and in most cases even if there is an after the fact correction I will make the correction on the day I find out about it, with the graphs representing the best data available at the dates listed. However, I will make an exception here because it is early, and I’m incorporating data I probably should have had from the beginning.
Namely, the source I have been using, The Green Papers, gives a tally of the delegates determined by primaries and caucuses (including projected eventual results of long caucus processes like Iowa’s) but at least for the moment is NOT looking at the “Automatic Delegates”, what were commonly known in the 2008 cycle as “SuperDelegates”. These are party officials and the like who come to the convention by nature of their position and are not bound by any rules or commitments or promises or whatever and can vote for whoever they like. On the Republican side this time there are 132 of these sorts of delegates. Democratic Convention Watch is tracking these people closely for when they make a public statement indicating which candidate they support.
Based on their information, we started the year with a superdelegate count of Romney 12, Perry 3, Santorum 1. On January 3rd Perry lost 1 . On January 9th, Perry gained 1 back. On January 10th, Romney gained 1. This leaves us at Romney 13, Perry 3, Santorum 1 today. I am now folding this information in on top of the delegates from Iowa and New Hampshire as reported by The Green Papers. Going forward, I will include both sources of information as I update these charts. For the record, I am assuming the changes I just listed happened at 12 UTC, since I didn’t actually check the page on those days.
This does leave us with a picture that looks even more favorable toward Mitt Romney, as his lead in these superdelegates is even more substantial than his lead in the rest of the delegates. At this point Romney only has to get 50.1% of remaining delegates, as opposed to his closest competitor at this time (Ron Paul) who needs to get a full 50.9% to win. These are still close to 50%, as we have just started, but in this view Romney is much closer to dropping below 50% than his rivals, and with Superdelegates plus New Hampshire, he is the only candidate heading downward (toward the nomination) rather than upward (away from it).
By the way, this makes the total projected delegate count so far based on these two sources:
- Romney 26
- Paul 9
- Santorum 7
- Perry 6
- Gingrich 4
- Huntsman 2
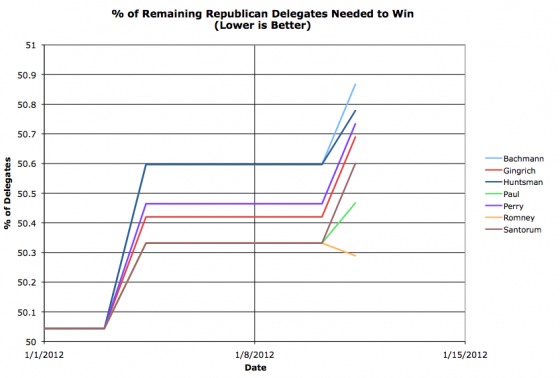
For the second time this election season we have delegate updates. This time of course from New Hampshire. As before, I am going to concentrate here on the graph above, which is the percent of the outstanding delegates the candidate needs to get in order to wrap up the nomination. For more common charts, like total delegates and the like, go to my full 2012 Republican Delegate Count Graphs page.
For this chart, remember that DOWN is better. When a candidate gets down to zero, they have wrapped up the nomination. If they go up past 100 then they have been mathematically eliminated from winning absent delegates changing their votes. Basically, you can look at this as measuring how close they are to winning. The lower the line, the closer they are to winning.
Bottom line here is that only one candidate actually improved their overall position based on the results in New Hampshire. That candidate is of course Romney. As you can see above, his percentage needed dropped slightly. This means the bar he needs to pass in all future contests was just LOWERED a bit, so his road to the nomination is easier. Everybody else in the race, even some others who increased the percentage of delegates they have, didn’t get ENOUGH… so their road to the nomination gets harder after this, not easier.
Of course this lines up nicely with the dominant narrative at this point. This was a big success for Romney, everybody else muddles along. The standard narrative is moving rapidly toward inevitability though. This is of course based on momentum and how spin following each contest effects the next elections, etc. From a pure delegate count point of view though, we just are not there yet. Only 1.6% of the available delegates have been awarded at this point… and that is only if you count provisional estimates of delegates from Iowa (they haven’t REALLY been allocated yet). The candidates are still close enough together in delegate count, and there are still so many delegates yet to allocate, that *if* the kind of volatility in support that happened during the pre-primary season were to continue, with either Romney collapsing, or another candidate having a “surge”, or if the dynamics start to shift as candidates drop out, there is still plenty of room for non-Romneys to make a move here.
Having said that, honestly, it does still look like Romney is going to quickly run away with this unless something happens to change the dynamics of the race VERY SOON. We just can’t actually say that from the numbers yet. Right now (estimates via The Green Papers) we have Romney with 13 delegates, followed by Paul 9, Santorum 6, Gingrich 4, Perry 3 and Huntsman 2. With 2249 more delegates yet to be determined. So a long way to go yet.
Given however that as of today for the first time, we actually have a delegate leader in the Republican campaign, I’ve started to put together my General Election Electoral College models based on state by state polling assuming we are going to end up with Obama vs Romney. Look for those to debut here before the end of the month.
So… Iowa… that was exciting, wasn’t it? Romney wins by 8 votes over Santorum who surged ahead of Paul at the last minute. Romney’s total was also exactly 6 votes less than he did in the state in 2008. Fun. Anyway, that voting is just a non-binding preference poll. The real action was not covered at all basically, which was the election of delegates to the county conventions, which will in turn elect delegates to the state convention, which will in turn elect the actual delegates to the Republican National Convention. I have seen no reporting on the actual people elected as county delegates or what their presidential preferences are. Of course, even if there was such reporting, it is non-binding. But educated estimates can be made. I’m going by the estimates at thegreenpapers.com. They explain their methodology on their site. In any case, based on the Iowa results tonight, they estimate that the following delegates will eventually be won once the full process completes in June.
- 6 delegates – Romney
- 6 delegates – Santorum
- 6 delegates – Paul
- 4 delegates – Gingrich
- 3 delegates – Perry
This is of course subject to change, as generally by the time we get to June, the delegates will be chosen based on the state of the race in June (most likely fully decided) rather than the results of the balloting that happened way back in January. But it is the best estimate at the moment.
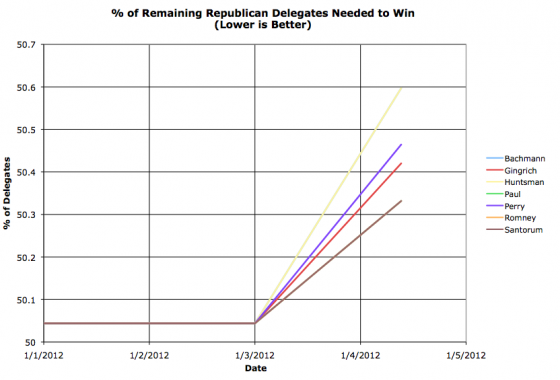
Based on this, we generate the first meaningful update to this season’s graph. Remember, this is the percentage of remaining delegates each candidate needs to win, so LOWER is better on this chart. Since nobody actually took a majority, everybody actually goes UP today, so winning has actually gotten HARDER for everybody… but the people who did the best go up the least and are the best off. The Brown line represents the three leaders, Romney/Santorum/Paul who at this point each need 50.33% of the remaining delegates to win. Then Gingrich in red needing 50.42%, Perry in purple needing 50.46%. Bringing up the rear on the yellow line we have Bachmann and Huntsman needing 50.60% of the remaining vote to catch up and win.
We have guestimated 1.09% of the delegates available tonight. 25 delegates out of 2286 total. And of course we haven’t ACTUALLY awarded ANY delegates yet. So this is all really just about starting to build momentum. The numbers are still tiny compared with what is to come. But the process has begun!
Next up… New Hampshire with another 12 delegates next week. Woo! Romney is currently way ahead of the pack in the polls there, but still at less than a majority, but he’ll most likely pull away from Paul and Santorum there. And then there is South Carolina… then Florida… and then… and then… hopefully this will stay interesting for a decent bit of time, but you’ll be able to quickly tell as the race narrows.
Once a candidate’s % Needed number starts dropping significantly below the % of the delegates they actually have so far you know they are building the kind of lead would take a major collapse to stop. (At the moment Romney/Santorum/Paul have 24.00% of the delegates each, but need 50.33% to win, so the three leads are nowhere near that point yet.)
With mere hours left until the Iowa caucuses begin, it is time for election graphs!
As with the last cycle, I will be producing updated graphs as the primary season goes on. I will post blog entries when there are significant updates, but the wiki page with all the details will always be on the AbulWiki at 2012 Presidential Delegate Graphs.
You will find delegate counts everywhere as the days progress (assuming the Republican race doesn’t resolve itself nearly instantly) but the added value I think I have on my charts as opposed to elsewhere is that I will be concentrating on the percentage of remaining delegates needed to win outright.
Last time around looking at the race this way rather than simply at delegate counts or percentage of delegates allocated so far let you see fairly clearly that Clinton’s chances against Obama had become essentially zero long before the general media finally admitted it. They hung on to the horserace story long past the point that the math made any Clinton catch up scenario reliant on incredible miracles.
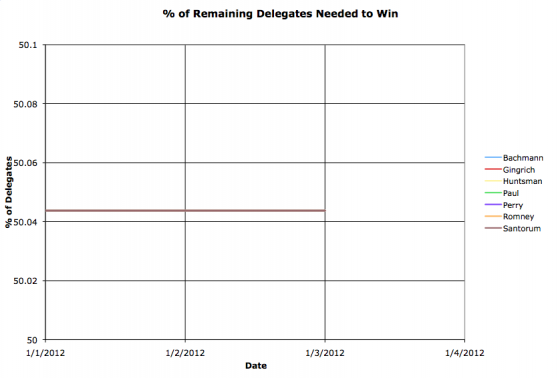
In any case, as of the best information I have at the moment, there will be 2286 delegates to the Republican National Convention. That means 1143 will give you a tie, but you will need 1144 for an outright win. So at the moment, prior to any delegates being awarded, each of the 7 major candidates still in the race need 50.044% percent of the outstanding delegates to win the Republican nomination.
And the race is on!
(Note 1: Since there is no significant challenger to Obama on the Democratic side, I’m not going to produce the graphs showing him marching inexorably to the nomination… if the no competition situation on the Democratic side changes unexpectedly, I’ll of course start to map out the race on that side too.)
(Note 2: You may remember that last time around I did general election prediction charts based on the electoral college and state by state polling. These will be coming soon as well. Gulp. That was a lot of work last time around. :-) )
|
|


