This is the website of Abulsme Noibatno Itramne (also known as Sam Minter).
Posts here are rare these days. For current stuff, follow me on Mastodon
|
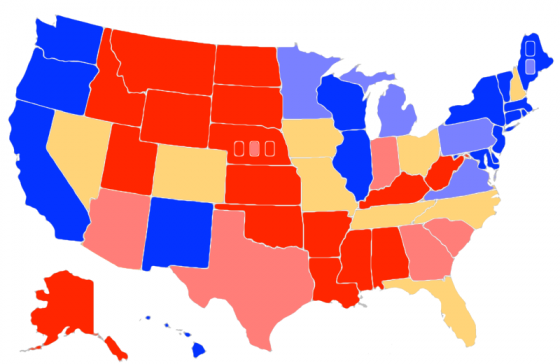
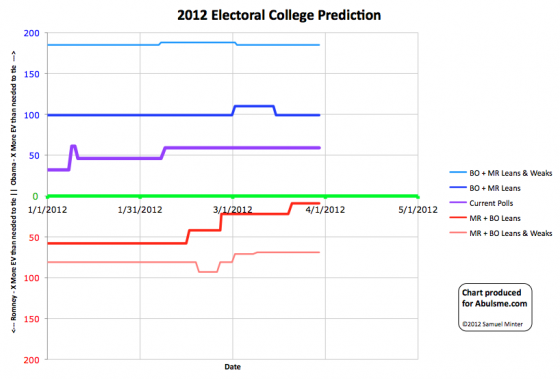
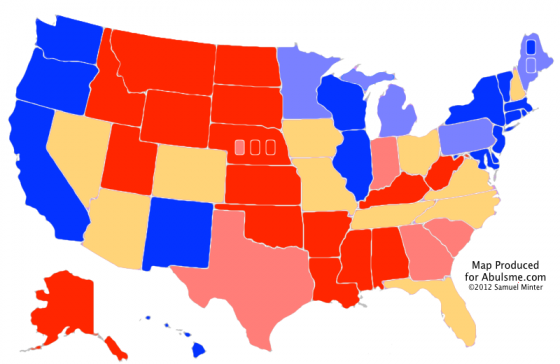
Map and chart from the Abulsme.com 2012 Electoral College Prediction page. Both assume Obama vs Romney with no third party strong enough to win states. Lines on the chart represent how many more electoral votes a candidate has than is needed to tie under several different scenarios. Up is good for Obama, Down is good for Romney.
So my update today included a new PPP poll in Nebraska. This poll included a breakdown by congressional district, which is useful because Nebraska is one of two states (the other is Maine) which currently have the potential of splitting their electoral college vote. Both states do this with 2 electoral votes going to the statewide winner, then 1 electoral vote for the winner of each congressional district. Thanks PPP for actually doing the CD split!!
Anyway, as I was adding the new data points for Nebraska at large and each of the three congressional districts, I noticed the previous data for the 1st and 2nd congressional districts included some errors. (Specifically the 2008 Republican and Democratic results were reversed… I use the 2004 and 2008 elections to seed the numbers for states that have had less than five actual Obama vs Romney polls.) The end result of this was that the 1st district had been classified as Weak Romney when it should have been Strong Romney, and the 2nd district was classified as Strong Romney when it should have been Weak Romney. I corrected this and the new poll results didn’t change the classifications again.
The net result of this is just that on the map I had the wrong one of the three boxes in Nebraska light red. It should have been the 2nd box instead of the 1st. This has now been corrected. Since both districts are one electoral vote and the changes balanced each other, the lines on the graph do not change at all.
The summary remains:
|
Romney |
Obama |
| Romney Best Case |
278 |
260 |
| Current Status |
210 |
328 |
| Obama Best Case |
170 |
368 |
Note 2012 May 23 10:43 UTC: Due to an error in my spreadsheet, a change in status for Wisconsin from Weak Obama to Strong Obama that should have been noted on this update on March 30th, was prematurely made on March 2nd. The corrected time series chart can be seen starting with the May 23rd update. Thanks to Darryl at HorsesAss for finding the mistake.
Note 2012 Jun 16 21:22 UTC: Actually, with more information, the Wisconsin transition should have happened on March 31st. See the correction on the June 19th update.
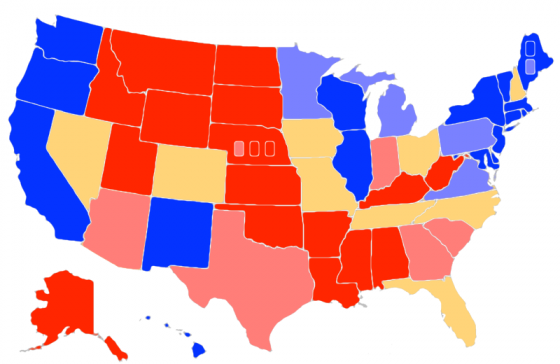
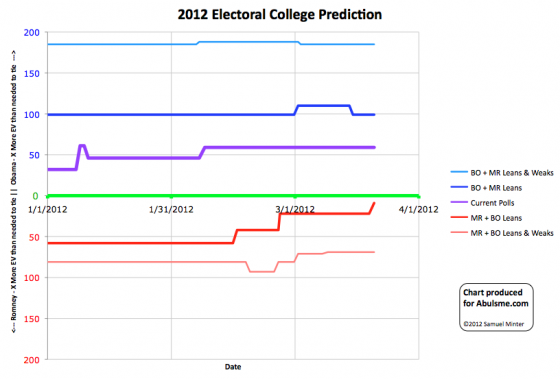
Map and chart from the Abulsme.com 2012 Electoral College Prediction page. Both assume Obama vs Romney with no third party strong enough to win states. Lines on the chart represent how many more electoral votes a candidate has than is needed to tie under several different scenarios. Up is good for Obama, Down is good for Romney.
Surely we must be close to Romney’s nadir, right? We expect him to suffer in the polls while going through his primary battle, but once it becomes clear he is the nominee and he can start pivoting to the general election, he should start fighting back. Right? That’s what we expect? Romney should hope that this is his low point, because his best case is now just barely squeaking out a win…
The new update today to my “last five poll average” for Virginia pushes Obama’s lead to over 5%. So I move the state out of the swing state category and into “Weak Obama” which I color light blue above.
This change makes our summary look like this:
|
Romney |
Obama |
| Romney Best Case |
278 |
260 |
| Current Status |
210 |
328 |
| Obama Best Case |
170 |
368 |
This means that in Romney’s best case (that is, he wins every single swing state), he wins with only 9 more electoral votes than the 269 needed to tie. That is getting awfully close.
That would mean that out of the nine swing states (defined as states where the leading candidate is ahead by less than 5% in the polls)…
- Romney MUST win Florida (29), Ohio (18), North Carolina (15), Tennessee (11) and Missouri (10) to win.
- He could afford to lose ONE of Iowa (6), Nevada (6) or New Hampshire (4) and still win.
- If he won all the rest, but lost Colorado (9) then we’d end up with a 269 to 269 tie, which would throw the election to the House of Representatives (voting by state delegation) which would likely result in a Romney win as well.
(Meanwhile, in Obama’s best case, he wins with 99 more electoral votes than needed to tie.)
That is of course if the election was today, which it is not. We have a long way to go. These lines will move up and down quite a bit before we get to November.
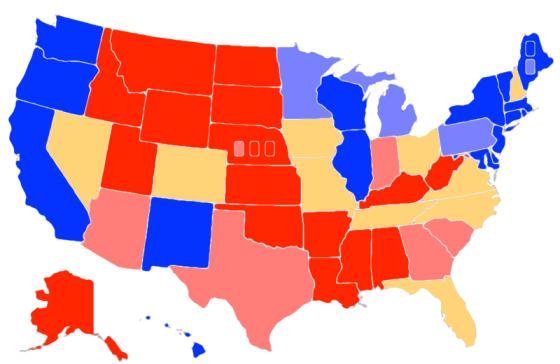
Map from the Abulsme.com 2012 Electoral College Prediction page. This map reflects Obama vs Romney. If any other candidate takes the lead in the Republican delegate race we’ll switch to making maps for them. This reflects the current state of polling, which of course will change drastically as the campaign progresses from now until November.
The latest update in my five poll averages puts Romney’s lead in Arizona over 5%, so the state moves out of the “Lean Romney” swing state status to “Weak Romney” indicating Romney’s lead is more than 5% but less than 10%. This moves Arizona out of the list of states that could easily go either way, and reduces the margin in Obama’s “Best Case” Scenario.
|
Romney |
Obama |
| Romney Best Case |
291 |
247 |
| Current Status |
210 |
328 |
| Obama Best Case |
170 |
368 |
And the trends over time…
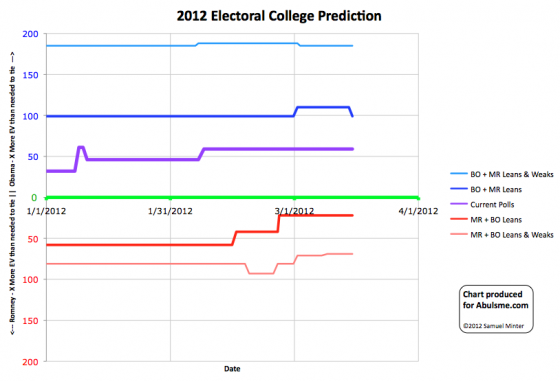
Chart from the Abulsme.com 2012 Electoral College Prediction page. Lines represent how many more electoral votes a candidate has than is needed to tie under several different scenarios. This chart reflects Obama vs Romney. Lines moving up indicate Obama’s situation improving, lines moving down indicate Romney’s situation improving. If any other candidate takes the lead in the Republican delegate race we’ll switch to making charts for them.
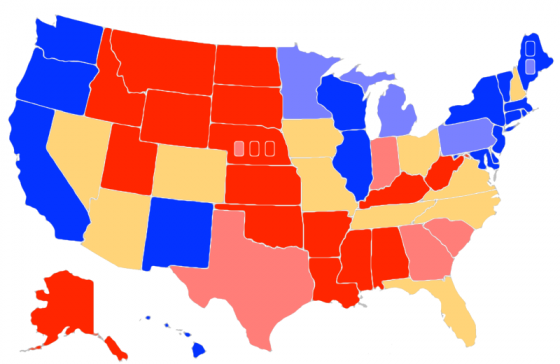
Map from the Abulsme.com 2012 Electoral College Prediction page. This map reflects Obama vs Romney. If any other candidate takes the lead in the Republican delegate race we’ll switch to making maps for them.
So the latest poll in Maine (the first since October) puts our “last five poll average” up an Obama lead of 12.1%, so the state moves from our light blue color (indicating a 5% to 10% lead) to dark blue (indicating a lead over 10%). Obama won Maine in 2008 by over 17%, so this isn’t a huge surprise.
This is for the whole state though. Maine is one of two states (the other is Nebraska) that allocate some of their electoral votes based on the state wide vote, but some of them by the winners in each congressional district. We have no polling yet for the individual congressional districts in Maine, so they are colored in by the average of the results in 2004 and 2008. So we classify ME-1 as Strong Obama (lead over 10%) and ME-2 as Weak Obama (lead between 5% and 10%).
In practice these states have almost never split their vote, but it does happen sometimes… Nebraska split its vote in 2008… so we have to allow for the possibility in our model.
Since this change does not effect a swing state, our summary remains the same:
|
Romney |
Obama |
| Romney Best Case |
291 |
247 |
| Current Status |
210 |
328 |
| Obama Best Case |
159 |
379 |
And our chart over time…
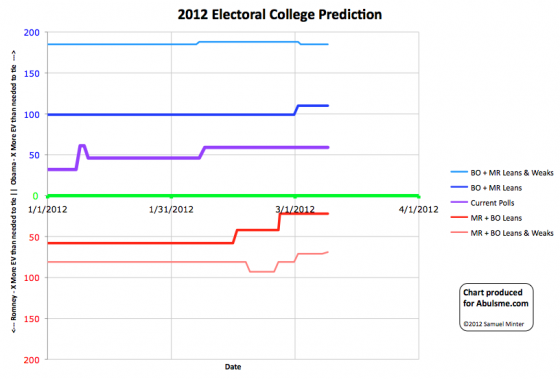
Chart from the Abulsme.com 2012 Electoral College Prediction page.
In the last month there have been 8 state category changes. 6 of them have gone in Obama’s direction. It will be awhile until the state by state polls are frequent enough and in enough states to be quickly responsive to the state of the race, but from the polling we do have, it is apparent that the continuing Republican primary battle seems to be slowly but surely weakening Romney’s hand against Obama. The expectation is that once Romney can pivot to the general election, he’ll be able to start trying to reverse that tide. But until then, he seems to just continue to lose ground.
Map from the Abulsme.com 2012 Electoral College Prediction page. This map reflects Obama vs Romney. If any other candidate takes the lead in the Republican delegate race we’ll switch to making maps for them.
For a short time Romney’s last five poll average had dropped to less than a 10% lead in Montana, but the latest poll pushes that average back over 10%, so we color the state bright red again. Since either way Montana is not close to being a swing state (although the margin was only 2.3% in the 2008 election!) this does’t effect the overall summary of the race.
|
Romney |
Obama |
| Romney Best Case |
291 |
247 |
| Current Status |
210 |
328 |
| Obama Best Case |
159 |
379 |
This does represent the first state to move in Romney’s direction in a couple of weeks, which can be seen in our trend chart:
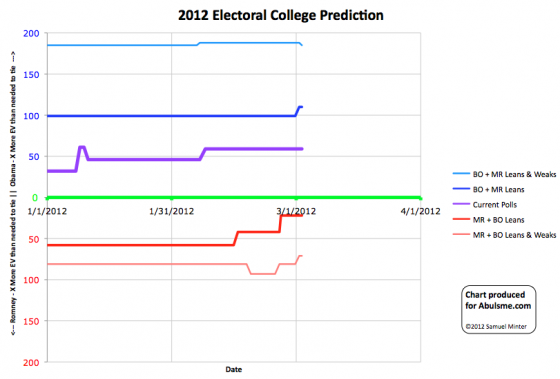
Chart from the Abulsme.com 2012 Electoral College Prediction page.
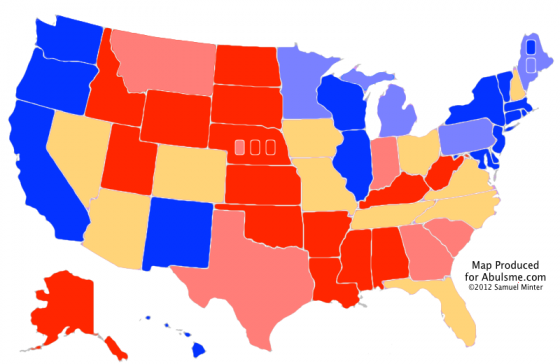
Map from the Abulsme.com 2012 Electoral College Prediction page. This map reflects Obama vs Romney. If any other candidate takes the lead in the Republican delegate race we’ll switch to making maps for them.
New polls in our last five poll averages move Obama’s lead in Wisconsin to over 10%, so that state moves into the “Strong Obama” category.
More interestingly perhaps, Romney’s lead in Tennessee drops to under 5%, moving that state to the “Lean Romney” category, which for purposes of our “best case” scenarios, puts the state into play for Obama. In 2008 McCain won Tennessee by a 15% margin, so this is somewhat surprising. We’ll see if this holds up as we move further into the year, but for the moment, that is where we are.
New Summary:
|
Romney |
Obama |
| Romney Best Case |
291 |
247 |
| Current Status |
210 |
328 |
| Obama Best Case |
159 |
379 |
And the trends since the beginning of the year…
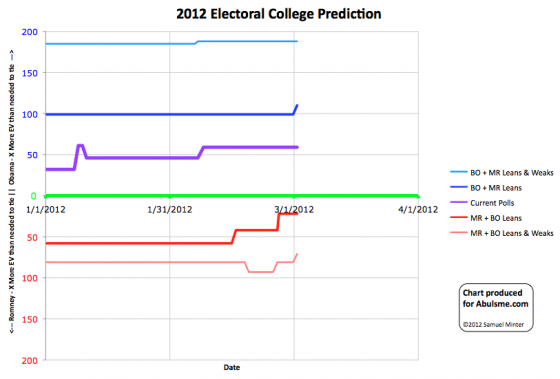
Chart from the Abulsme.com 2012 Electoral College Prediction page.
Up is better for Obama, so you can see that at least so far, things have generally been heading in his direction. It is of course still very early, so much will change between now and November.
Correction 2012 May 23 10:18 UTC: As it turns out, Wisconsin should NOT have flipped from Weak Obama to Strong Obama with this update on March 2nd. This change was influenced by the presence of a Washington State poll that I incorrectly included in my Wisconsin data. When this is backed out, Wisconsin does eventually go Strong Obama, but not until March 30th. Thanks to Darryl at HorsesAss for finding the error in my spreadsheet. The time series chart is corrected to reflect this starting with my May 23rd update.
Correction 2012 Jun 8 14:56 UTC: So, Tennessee shouldn’t have moved on this day either. The HorsesAss data included an old Tennessee poll from October 2011, that shows a strong Romney lead. The presence of this poll would have delayed the Tennessee move to “Lean Romney” until May 24th. This was noted and the historical graphs corrected starting with the June 8th update.
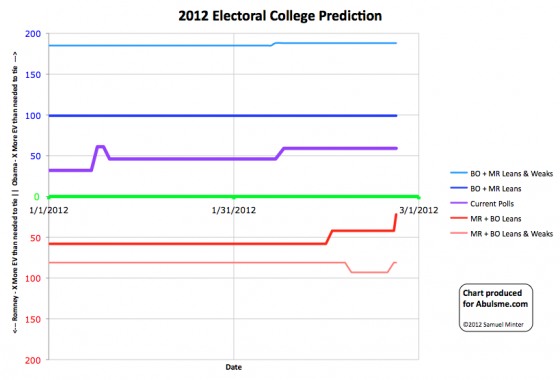
Chart from the Abulsme.com 2012 Electoral College Prediction page. Lines represent how many more electoral votes a candidate has than is needed to tie under several different scenarios. This chart reflects Obama vs Romney. If any other candidate takes the lead in the Republican delegate race we’ll switch to making charts for them.
This is a big one today. Obama’s 5 poll average in Pennsylvania is now more than a 5% lead. This means I take Pennsylvania out of swing state status. It is no longer “too close to call”, it is blue. This reduces Romney’s best case (win all the swing states scenario) to only a 291 to 241 win. It is still a win, but his best case is now a vey narrow win, only 22 electoral votes past the 269 needed to tie. That turns Florida into a “Must Win”, as without winning Florida, there is no longer a way to get to 269. (At least without reaching past the swing states and pulling back states where Obama is even further ahead.)
New summary:
|
Romney |
Obama |
| Romney Best Case |
291 |
247 |
| Current Status |
210 |
328 |
| Obama Best Case |
170 |
368 |
And new map…
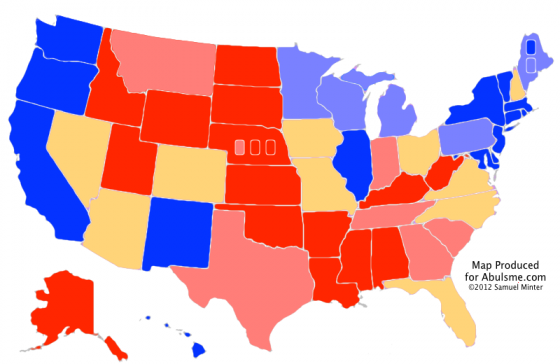
Map from the Abulsme.com 2012 Electoral College Prediction page.
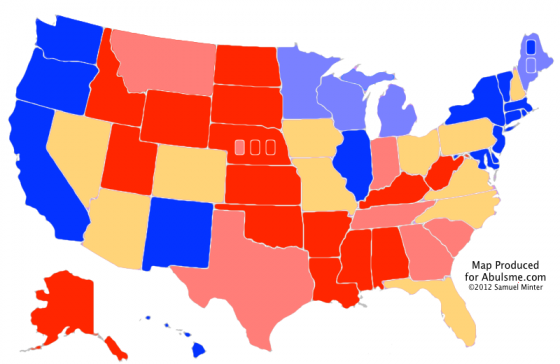
Map from the Abulsme.com 2012 Electoral College Prediction page. This map reflects Obama vs Romney. If any other candidate takes the lead in the Republican delegate race we’ll switch to making maps for them.
So on February 19th our five poll average for Washington state had Obama’s lead dip below 10%, moving them from Strong Obama to Weak Obama. Today another poll puts Obama’s 5 poll average back over 10%, so we put the state back in the Strong Obama category. Either way, just above or just below 10%, Washington is nowhere near being a swing state.
Since this doesn’t affect the inventory of swing states, the overall summary is the same:
|
Romney |
Obama |
| Romney Best Case |
311 |
227 |
| Current Status |
210 |
328 |
| Obama Best Case |
170 |
368 |
And the chart over time…
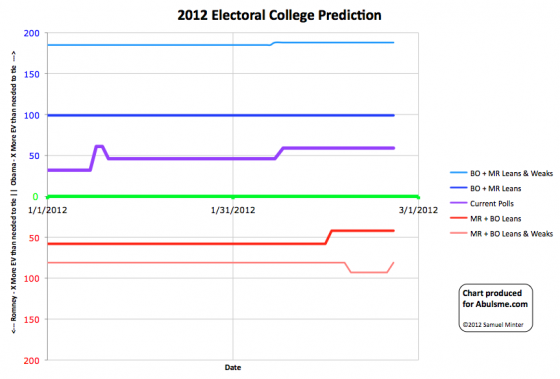
Chart from the Abulsme.com 2012 Electoral College Prediction page. Lines represent how many more electoral votes a candidate has than is needed to tie under several different scenarios.
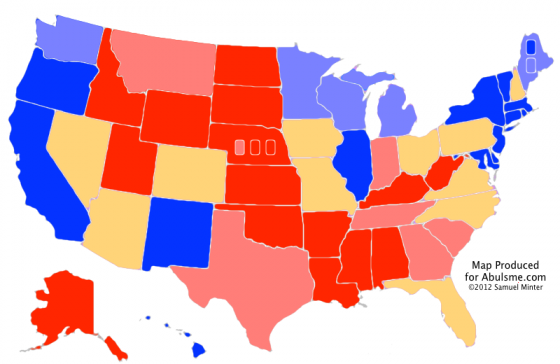
Map from the Abulsme.com 2012 Electoral College Prediction page.
So, a new poll in Washington state moves Obama’s 5 poll average from a lead just a little more than 10%, to a lead just under 10%. To be fair, this is the 5th real poll I have, so this for the first time moves the 2008 election results used to seed the averages out, and makes this the first look that is based solely on Obama vs Romney polling. It does though move Washington from the “Strong Obama” category down to my “Weak Obama” category. I keep thinking maybe I should rename the categories, because a 9.5% lead isn’t exactly all that “Weak”. But leads that size have been known to disappear via strong campaigning, major events in the campaign, etc. The right way to interpret this category is “Candidate has a decent lead, but not so huge they can take the state for granted.” My name just sucks a little. :-)
In any case, since this doesn’t effect a swing state, this doesn’t move the basic numbers of the race:
|
Romney |
Obama |
| Romney Best Case |
311 |
227 |
| Current Status |
210 |
328 |
| Obama Best Case |
170 |
368 |
This is the first movement on our charts toward Romney since January 11th though, so that is worth noting.
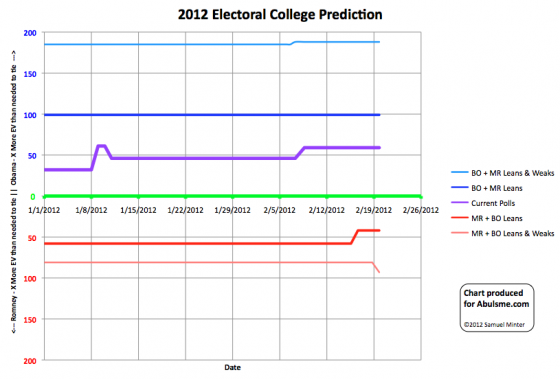
Chart from the Abulsme.com 2012 Electoral College Prediction page. Lines represent how many more electoral votes a candidate has than is needed to tie under several different scenarios.
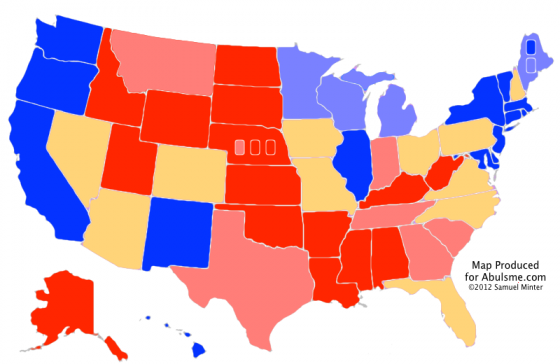
Map from the Abulsme.com 2012 Electoral College Prediction page.
I’ve switched the color of the swing states to gold to make them stand out more. Also note this analysis is strictly Obama vs Romney. If some other candidate takes the delegate lead on the Republican side, I’ll start an analysis for them too, but not before.
The big change today is that a new poll moves my five poll average for Michigan to a greater than 5% lead for Obama. This takes it out of my “Lean Obama” swing state category and into the “Weak Obama” category, meaning that Obama has a nice lead in the state, but not so large he can take it for granted.
In terms of the range of outcomes that seem possible (again, if the election were held today, which it won’t be, and a lot will happen before November), we consider as the extremes of what is likely all the swing states going one way or the other. This is a highly unlikely outcome in and of itself, but it serves to bound the range of possible outcomes. With Michigan slipping out of the swing state category, this means Romney’s best case scenario is now Romney 311 – Obama 227. To achieve this he would need to win all the states where he is currently ahead in polling, and also pull Florida, Pennsylvania, Ohio, Virginia, Colorado, Iowa and Nevada away from Obama.
The situation if everybody wins the states they are currently ahead in remains Obama 328 – Romney 210.
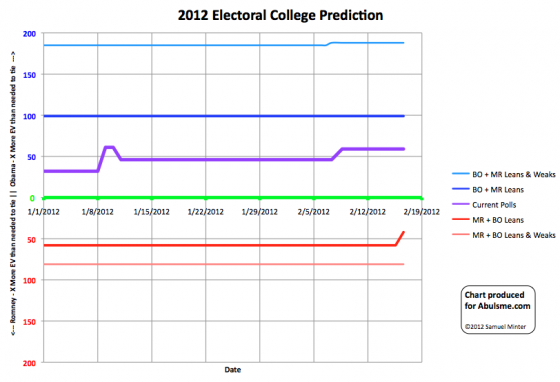
Chart from the Abulsme.com 2012 Electoral College Prediction page. Lines represent how many more electoral votes a candidate has than is needed to tie under several different scenarios.
|
|


