This is the website of Abulsme Noibatno Itramne (also known as Sam Minter).
Posts here are rare these days. For current stuff, follow me on Mastodon
|
Since the last notable change, Jill Stein became the presumptive nominee of the Green party. So I folded in 4-way poll results that included her in AZ/NC/OH/NJ/GA/PA/FL/CT. I also added new polls in VA/WI/CA. Of all of these updates, changes only resulted from the additions in Virginia and Pennsylvania.
Interestingly, although Trump has been plummeting in the national polls the last few weeks (see Pollster and RCP), 4 out of the 5 state level category changes and 4 out of 4 tipping point changes here at Election Graphs since Trump became the presumptive Republican nominee have been in Trump’s favor.
I have been attributing this to the natural lag in the kind of state poll averages tracked here… but the trend has gone on long enough that there may be something else happening. It is actually starting to look like Clinton’s lead has been narrowing in a number of states, even while Trump has been falling further behind at a national level. This is an odd pattern. It will be interesting to see if it continues.
In the mean time, lets look at the latest example:
Virginia
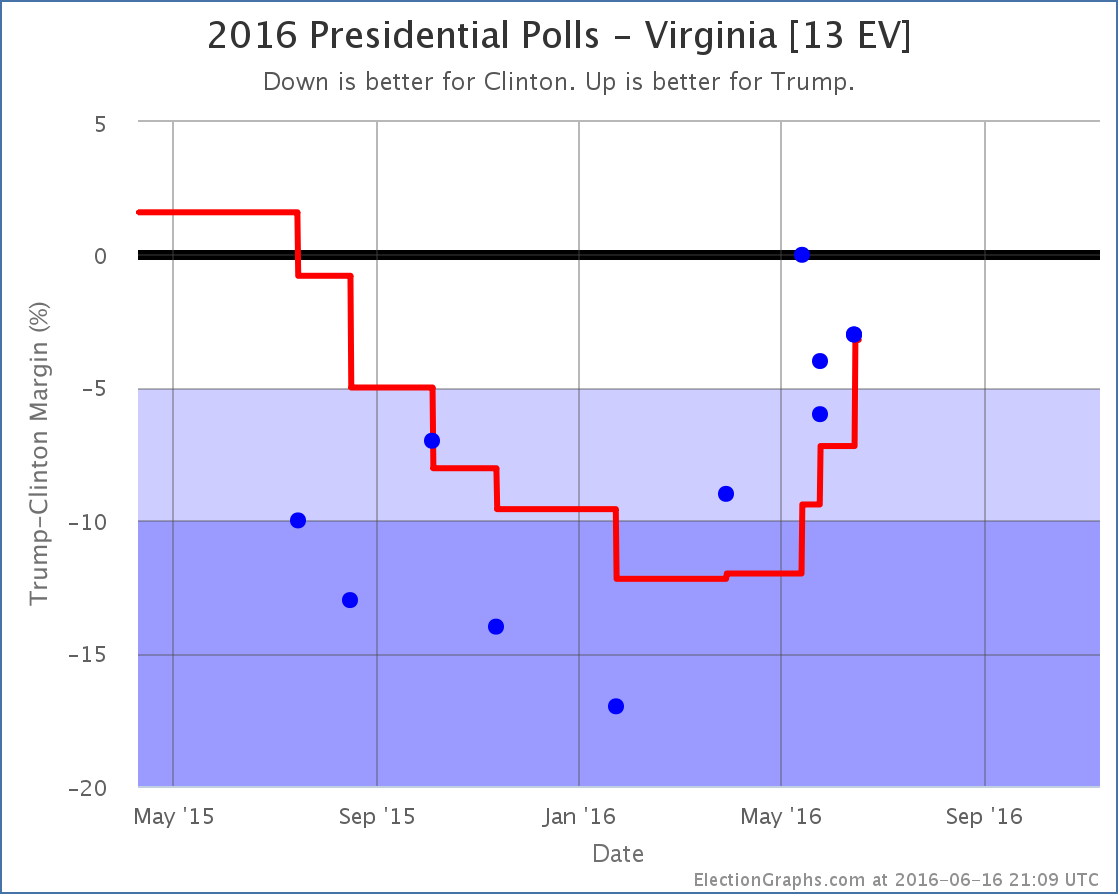
In Virginia on the eve of Trump becoming the clear winner on the Republican side he was behind by 12% in the Election Graphs average. With every poll since then, his position has improved. He’s now behind by only 3.2%. The most recent results were from June 13-15… well after the narrative of Trump’s collapse in the national polls was taking hold, and after weeks of Trump doing and saying things that seemed to be damaging his prospects nationally.
But yet the newest results have Trump down only 3% in a state where he had a poll showing him down 17% back in January. This trend does not look like a collapse. Quite the contrary. It does look like Trump is in a downward spiral in the national polls. But in Virginia specifically, he is doing better than he has since last August.
It seems strange that Virginia would be rapidly moving in the opposite direction than the national polls. Perhaps if we had weekly polls in Virginia we might have seen a different picture. Perhaps there have been large swings up and down that are just invisible because there have not been enough polls to show it. Maybe. But with the data we have, it really looks like Virginia has been on a Trumpward swing, despite the national trends.
With Virginia now close, we now include Trump winning it in “Trump’s best case”. So a quick look at the national trend:
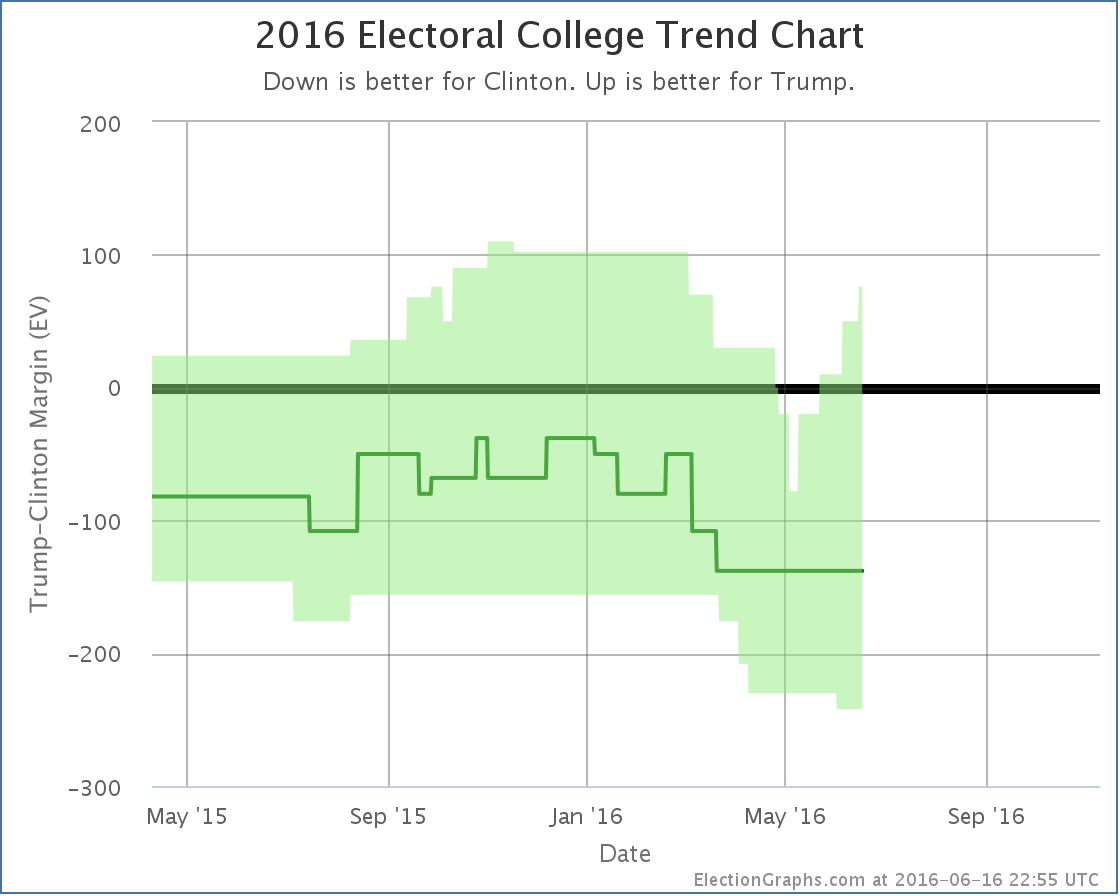
Aside from the one bump showing Clinton making Utah close, the trend here at the state level looks like Trump making a number of states closer. First Florida, then North Carolina, then Pennsylvania, now Virginia.
Trump isn’t flipping states, but he is making more states close. The national picture may look different, but at the state level, which is what actually determines the winner in November, there isn’t a Trump collapse visible yet. Trump is actually looking stronger.
Pennsylvania
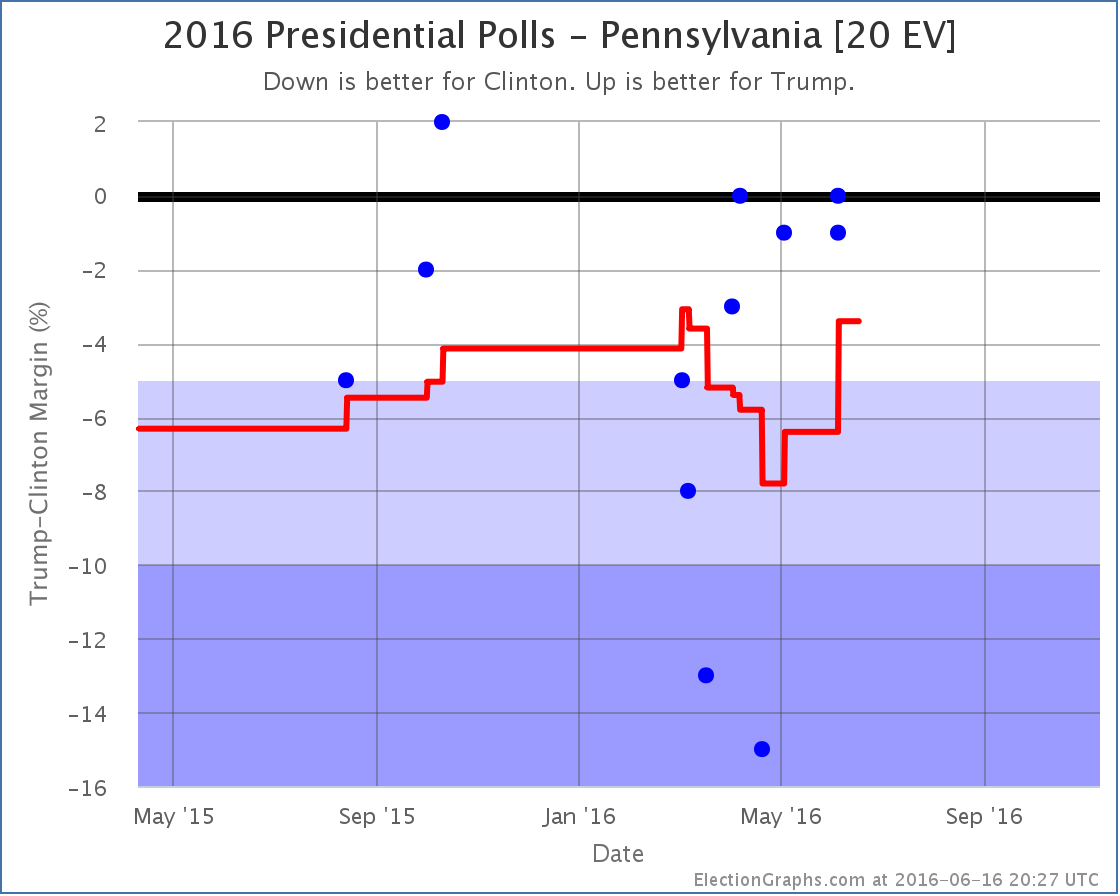
With Jill Stein now the presumptive nominee of the Green party, I added in a number of polls I had been tracking but not yet including in the analysis that included Jill Stein along with the major party candidates and Gary Johnson for the Libertarians. Among those was a poll in Pennsylvania showing a 1% Clinton lead over Trump. This did not change the status of Pennsylvania, which had already moved to Weak Clinton in the last update, but since Pennsylvania was the tipping point state, it moved that metric:
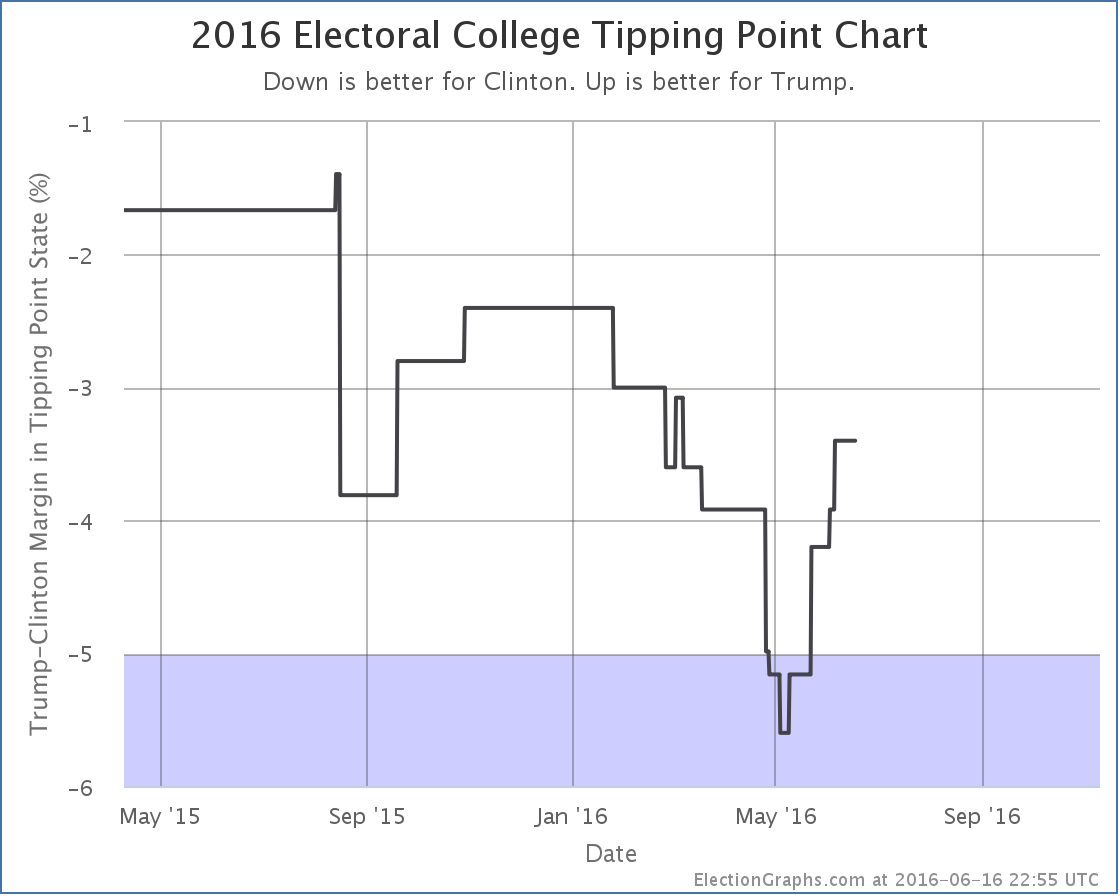
The tipping point state remains Pennsylvania, but the margin moves from a 3.8% Clinton lead to a 3.4% Clinton lead.
So with today’s updates, both Trump’s “best case” and his tipping point improve.
The downward trend in the national numbers may eventually show itself at the state level, but it hasn’t yet.
144.9 days until the polls start closing on Election Day 2016.
Note: This post is an update based on the data on ElectionGraphs.com. Election Graphs tracks both a poll based estimate of the Electoral College and a numbers based look at the Delegate Races. All of the charts and graphs seen in this post are from that site. Additional graphs, charts and raw data can be found there. Follow @ElectionGraphs on Twitter or like Election Graphs on Facebook to see announcements of updates or to join the conversation. For those interested in individual general election poll updates, follow @ElecCollPolls on Twitter for all the polls as they are added. If you find the information in these posts interesting or useful, please consider visiting the tip jar.
Clinton clinched the nomination last week, but DC still hadn’t voted. Now they have.
Clinton got 16 delegates, Sanders got 4.
Since last week when I posted the CA/NJ/NM/MT/SD/ND results, we had updates from CA/NJ/SD as well as many to superdelegate preferences. The net result of all of these was Clinton +7, Sanders +5.
So net change since last week: Clinton +23, Sanders +9.
All the caucuses and primaries are now over. There are still 116 superdelegates who have not expressed a preference publicly, but what they do at this point no longer matters to the nomination. Similarly, while it is possible that the superdelegates who have already supported someone could change their minds, it is unlikely to happen in significant numbers absent an earthshaking surprise.
So we are done.
Lets look at the updated graphs:
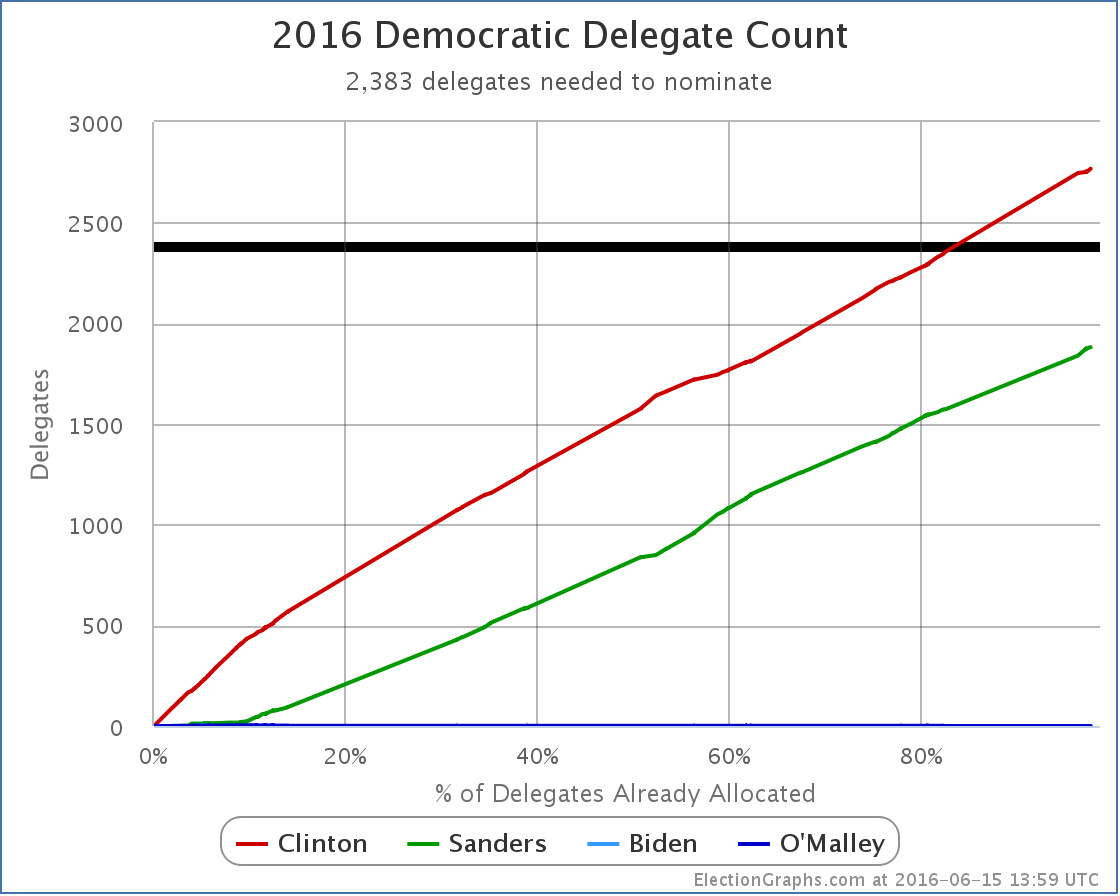
The delegate count is now: Clinton 2768, Sanders 1881, with 116 TBD.
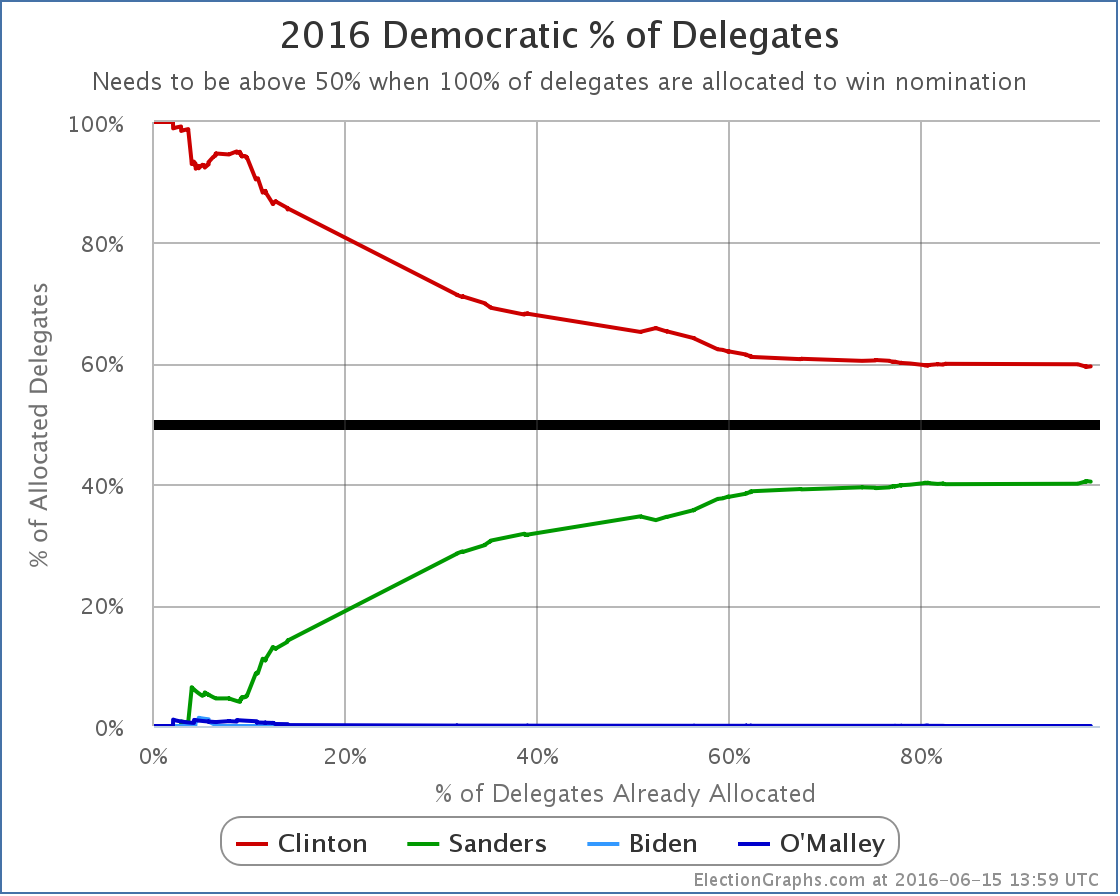
Clinton now has 59.54% of the delegates, Sanders has 40.46%.
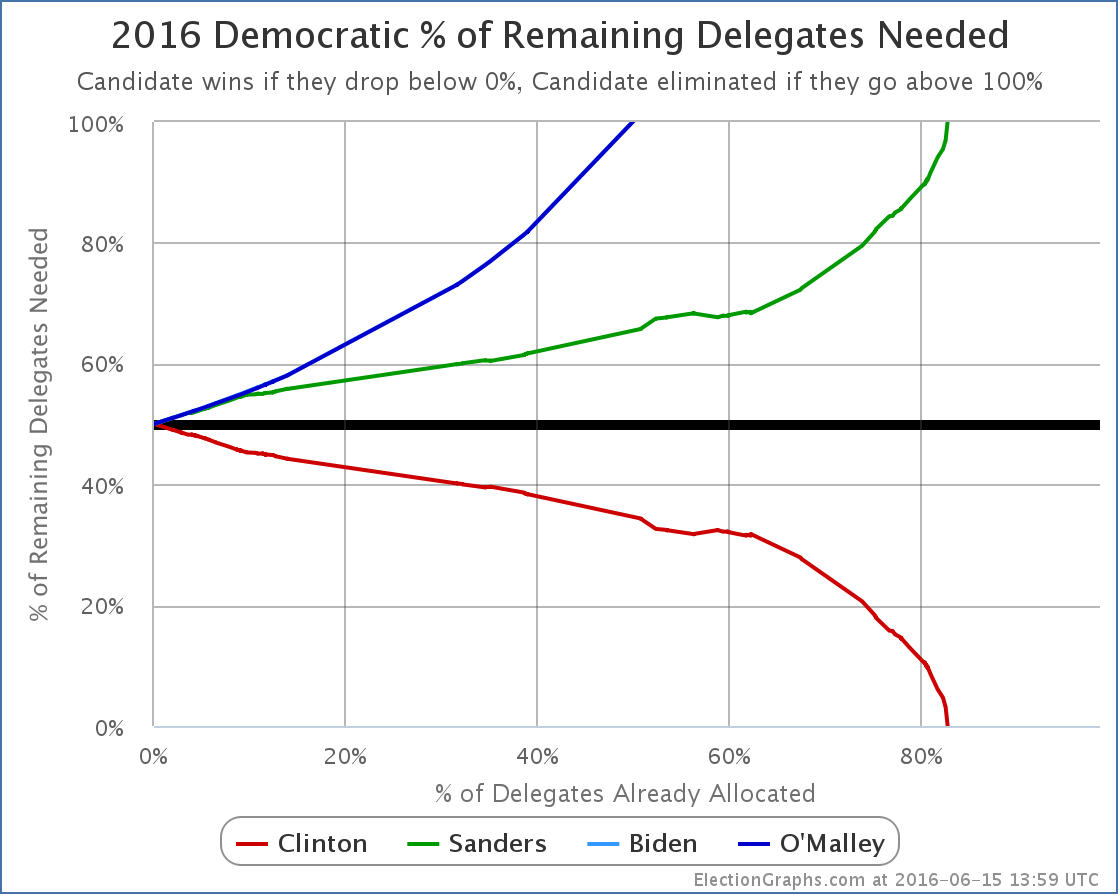
It didn’t change with the DC results since the race was already won, but here again is the “% remaining needed to win” chart.
There isn’t much else to see here absent unexpected craziness. I gave my thoughts wrapping up the Democratic race last week. If there are any additional developments you will see them here. But aside from straggler superdelegates revealing their preferences, nothing of significance is expected.
The Republicans are done too of course.
We have Clinton vs Trump. It is time to settle down and get comfortable for the general election coverage.
146.4 days until the polls start to close on Election Day 2016. Buckle up!
Update 2016-06-18 16:19 UTC – Superdelegate update: Clinton +12, Sanders -1.
Update 2016-06-22 15:47 UTC – Superdelegate update: Clinton +3.
Update 2016-06-22 15:48 UTC – Update from California: Clinton -8, Sanders +8.
Update 2016-06-24 17:06 UTC – Superdelegate update: Clinton +2.
Update 2016-06-28 06:39 UTC – Superdelegate update: Some shuffles, but zero net change.
Update 2016-06-30 06:00 UTC – Update from California. Net change: Clinton -1, Sanders +1
Update 2016-07-01 05:00 UTC – Update from California. Net change: Clinton -1, Sanders +1
Update 2016-07-10 16:00 UTC – Update from California and the Virgin Islands. Net Change: Clinton -1, Sanders +2
Update 2016-07-12 03:33 UTC – Superdelegate update: Clinton +2
Update 2016-07-13 03:56 UTC – Superdelegate update: Net change Clinton +1, Sanders -1. This is Sanders endorsing Clinton.
Update 2016-07-17 15:30 UTC – Superdelegate update: Clinton +3. Update from Puerto Rico: Clinton +1, Sanders -1
Update 2016-07-18 14:25 UTC – Superdelegate update: Clinton +1.5, Sanders -1.5
Update 2016-07-20 07:27 UTC – Superdelegate update: Clinton +2, Sanders -1
Update 2016-07-21 15:56 UTC – Superdelegate update: Clinton -1. This was due to Rep Takai (HI) dying, so total number of delegates also -1.
Update 2016-07-26 07:27 UTC – Final superdelegate update: Net change Clinton +1. This makes the final totals Clinton 2782.5, Sanders 1889.5. Next update will be the convention roll call.
Update 2016-07-28 15:34 UTC – Actual convention roll call results were Clinton 2842, Sanders 1865, DNV 56. So Clinton gained 59.5 delegates while Sanders lost 24.5 delegates compared to the last estimates here.
Note: This post is an update based on the data on ElectionGraphs.com. Election Graphs tracks both a poll based estimate of the Electoral College and a numbers based look at the Delegate Races. All of the charts and graphs seen in this post are from that site. Additional graphs, charts and raw data can be found there. Follow @ElectionGraphs on Twitter or like Election Graphs on Facebook to see announcements of updates or to join the conversation. For those interested in individual general election poll updates, follow @ElecCollPolls on Twitter for all the polls as they are added. If you find the information in these posts interesting or useful, please consider visiting the tip jar.
The massacre in Orlando this weekend is horrifying. I mourn along with everybody else.
On Twitter and Facebook people are predictably sorting themselves into either those who are using this as an opportunity to talk about how awful mass shootings are and how therefore we need to ban assault weapons vs people who are using this as an opportunity to talk about how horrifying terrorism is and how therefore we need to double up on the “war on terror” (in many cases with a fairly anti-Muslim orientation). A whole range of reactions is on display relating to how this specific attack was targeted at the LGBT community as well.
In the face of this, I always want to step back a bit and look at the bigger picture.
First of all, while mass killings understandably wrench the emotions differently and more strongly than individual killings, in the end, 50 people dying together is not worse than 50 people dying individually. They are equally tragic. But aside from the immediate families of those involved, the 50 people dying individually is more invisible to us as a society, so it tends to get ignored. The extra attention given to the incidents when many people are killed at once is understandable, but it also distracts from the magnitude and nature of the real problem. Mass killings make up an incredibly small portion of overall homicides. Concentrating on them will inevitably lead to people going after the wrong things when looking for solutions.
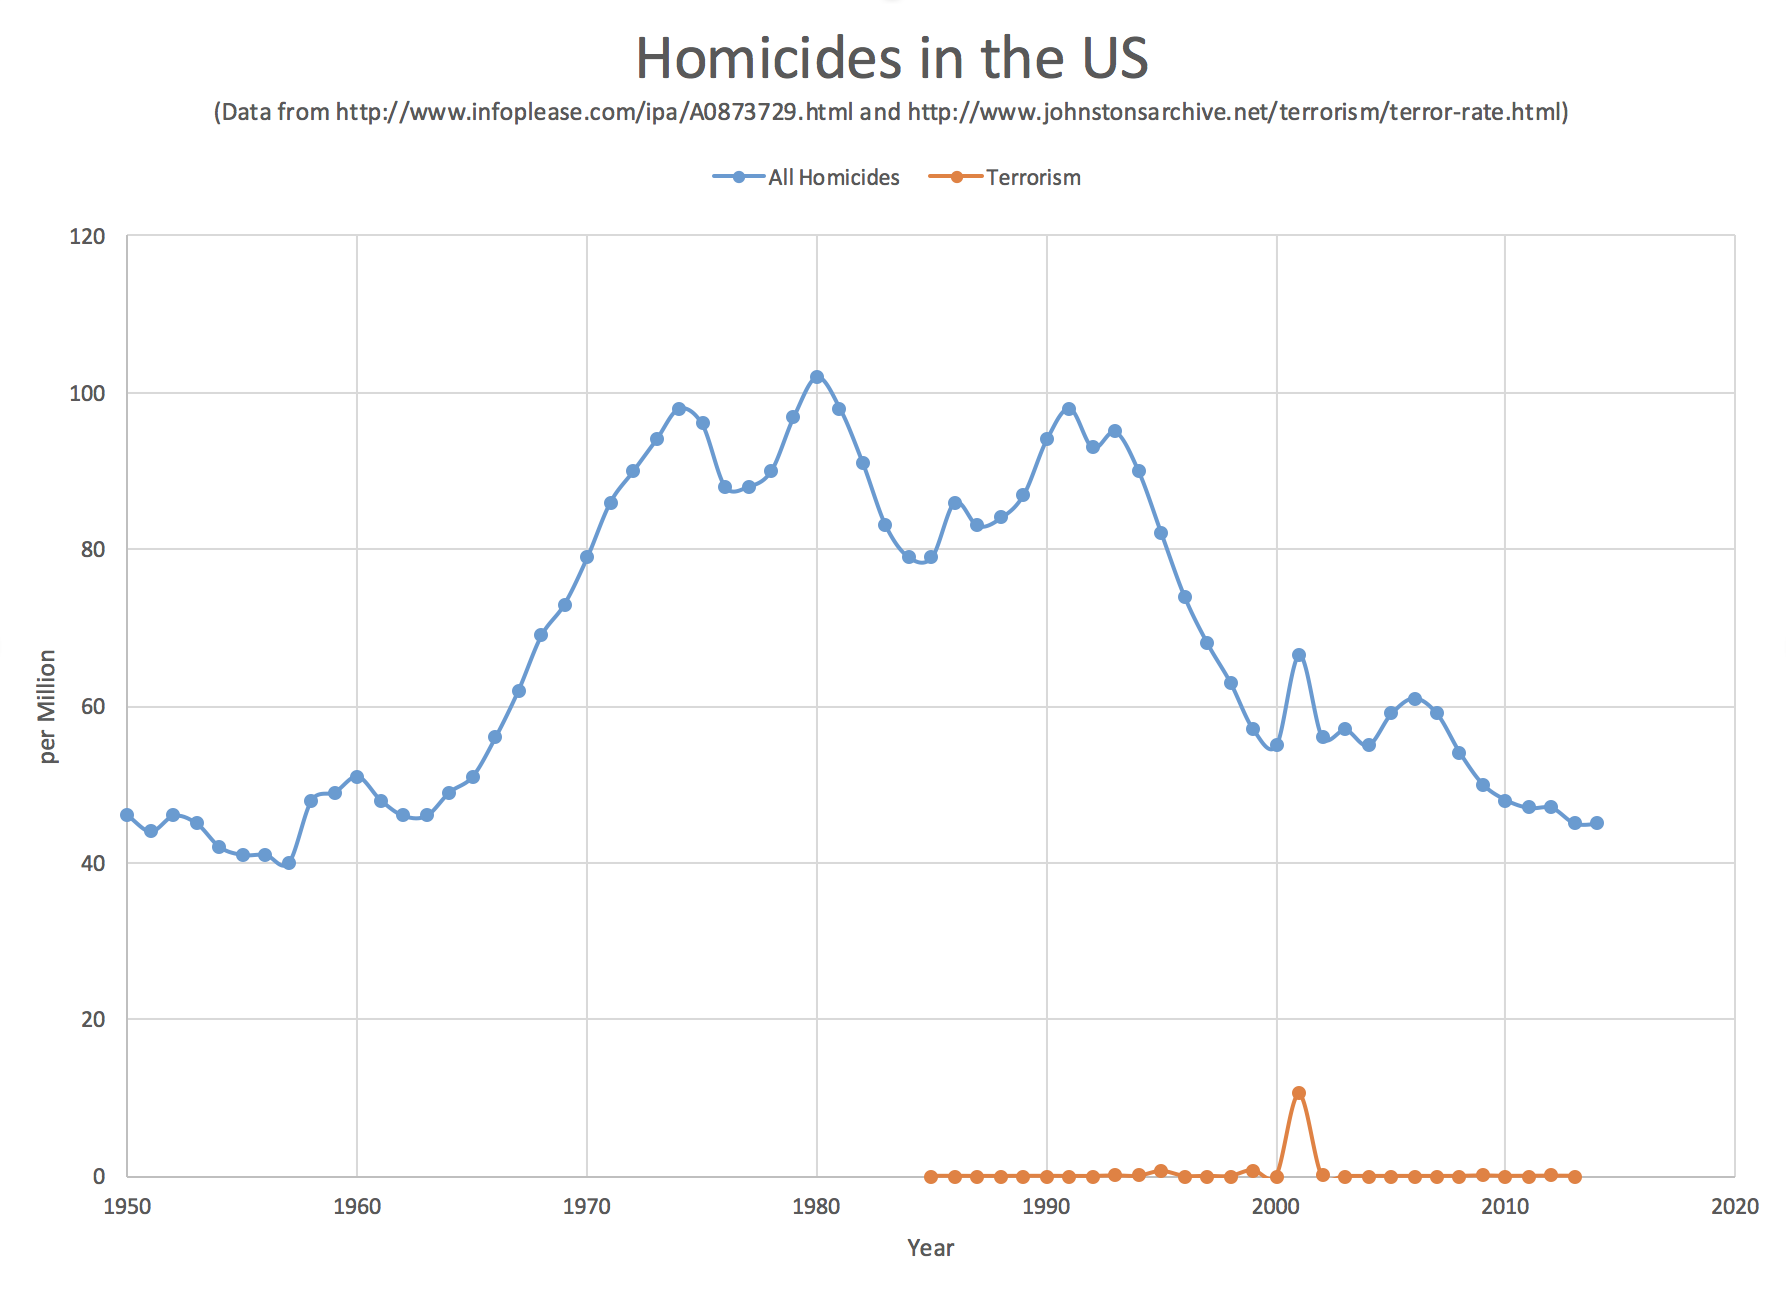
Second, yes, murders are a problem. Yes, the United States has a higher murder rate than comparable countries. Much higher. And we should be able to do much better. But… look at that chart above. The homicide rate nation wide has been DROPPING for decades. It is about half what it was in the 1980’s. The trends are going in the right direction. We are much safer than we were. From the frenzy whenever one of these attacks happens, you would think that we had a problem that was worse than it ever has been and was getting worse rapidly. No. We may have a long way to go to match our peer countries (19 per million for Germany, France and Canada; 13 per million for the UK; 8 per million for Japan, compared to 45 per million for the US) but we have been headed in the right direction for many years now. Things are getting better, not worse.
Third, with the notable exception of 9/11, deaths caused by terrorism in the United States are almost invisible compared to the rate of all homicides. Yes, it is horrible when a terrorist attack happens. Boston and San Bernardino and now Orlando are shocking. They disturb our sense of safety in a way that isolated killings do not. It is even more pronounced when the attacks specifically target one community, as the Orlando event targeted the LGBT community. The psychological effects of such attacks on the nation and on the targeted communities is real and should not be ignored. Responses though need to be proportionate to the problem, or they end up being like an allergic reaction, causing more harm through the response than the problem they are trying to solve. Even including 9/11, terrorist attacks were responsible for only approximately 0.6% of homicides from 1985 to 2013. I am of course not saying such attacks should be ignored in our policy, but I am saying that our response to these sorts of attacks, both in how the public reacts and in how policy changes as a result, is horribly disproportionate to the actual problem.
All in all, I wish people on all sides of these debates would take a step back from their emotionally charged initial reactions, and the sorting into political tribes they will defend regardless of the issue, and instead actually try to look at things in a facts based way, and if looking to solve problems, try to base solutions by actually trying to determine what might be most effective at moving the needle on the overall metrics.
So, for instance, banning assault weapons probably won’t make a big difference, because they are responsible for a really small portion of overall homicides. Focusing on them is a distraction, despite the high profile of the events they are involved in. Focusing on “Islamic Terrorism” will likely not help much either, as that too is responsible for small numbers in comparison to other motivations.
Meanwhile, making it overall a bit more difficult to get handguns might indeed reduce the numbers noticeably. But that would involve making a lot of people feel like you are taking away a fundamental right, which should also be factored into any cost/benefit analysis. It should not be ignored or dismissed. Solving one problem by making a huge portion of the population feel that you are attacking their fundamental values would just create other problems, possibly worse ones. Making long term changes to the culture so fewer people want weapons in the first place might work, but is something that would happen over many decades, and there is little patience for that. Working on anger management and conflict resolution skills as part of basic education might help quite a lot too, although is also something that takes a long time to show results. Increasing resources to identify and help people who are under stress, who are showing signs of becoming violent, or who have untreated mental illness that is a danger to themselves or others would surely make a big difference as well.
I don’t specifically claim to have the answer or the right mix of answers. I’m not specifically advocating any policy option. The above is just an off the top of my head look at a few options that people sometimes mention. The key is that I wish that people would look at the various options rationally, looking at the numbers and keeping an eye on the big picture, as well as taking into full account people’s concerns about rights and worries about safety. Violent death and homicide are problems that are approachable through analysis and experiment. We can see what works, and what doesn’t work. Both by trying things and observing things other countries have tried. We should be open to investigating the possibilities, and to experimentation. Keep what works, ditch what doesn’t.
But alas, this is the real world, so that won’t happen. Instead we will focus on highly visible incidents that aren’t representative of the overall problem, and everyone will focus on the problems and solutions their tribe tends to focus on, and will continue believing that the people on the “other side” are crazy or evil or just don’t understand, and the only thing that will happen is that the polarization of society will increase further.
Sigh.
(I did a somewhat similar post after Sandy Hook if anybody wants to review what I said then, and in that one I also talked about killings using guns vs killing using other weapons, something I chose not to revisit this time.)
A couple of days ago, Utah moved from Strong Trump to Weak Trump in my classifications, so I speculated that Trump’s post-clinching bump might be over. But with the most recent batch of polls (from Pennsylvania, Florida and Connecticut) there is already another move in Trump’s direction. Remember that the picture given by trailing state poll averages will always “lag” the underlying situation a bit, but for the moment, the trend I track here still looks like it is moving in Trump’s direction.
Lets look at the details. The state that changes status is Pennsylvania:
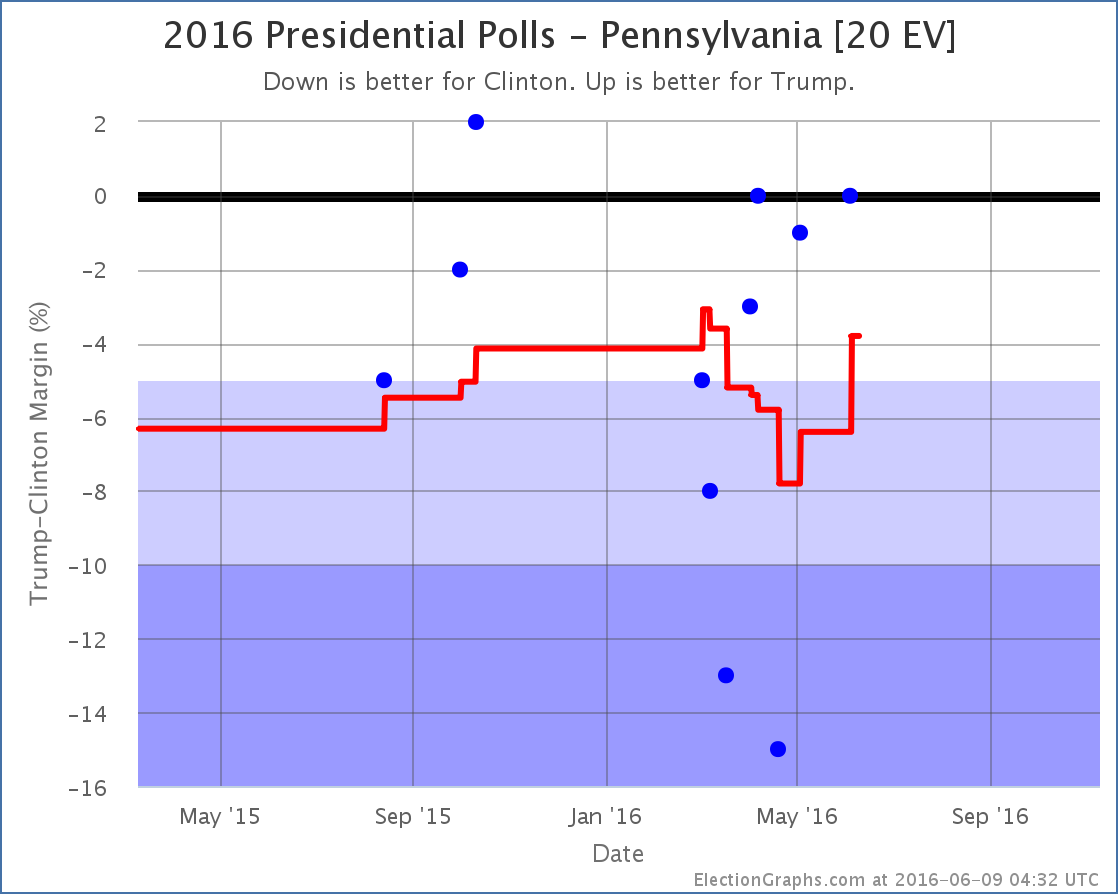
The range of poll results in Pennsylvania has been huge. From a 15% Clinton lead to a 2% Trump lead. With the addition of the latest poll, one of the two polls that showed Clinton up by more than 10% fall off the average, and therefore the average pops in Trump’s direction.This brings the average in Pennsylvania to a 3.8% Clinton lead. Clinton is still ahead, but it is once again close enough that I allow for the possibility of Trump pulling the state into his column.
If Trump actually is able to get Pennsylvania, it is a big get. Pennsylvania has the sixth largest number of electoral votes. Adding Pennsylvania into Trump’s best case, the national trend now looks like this:
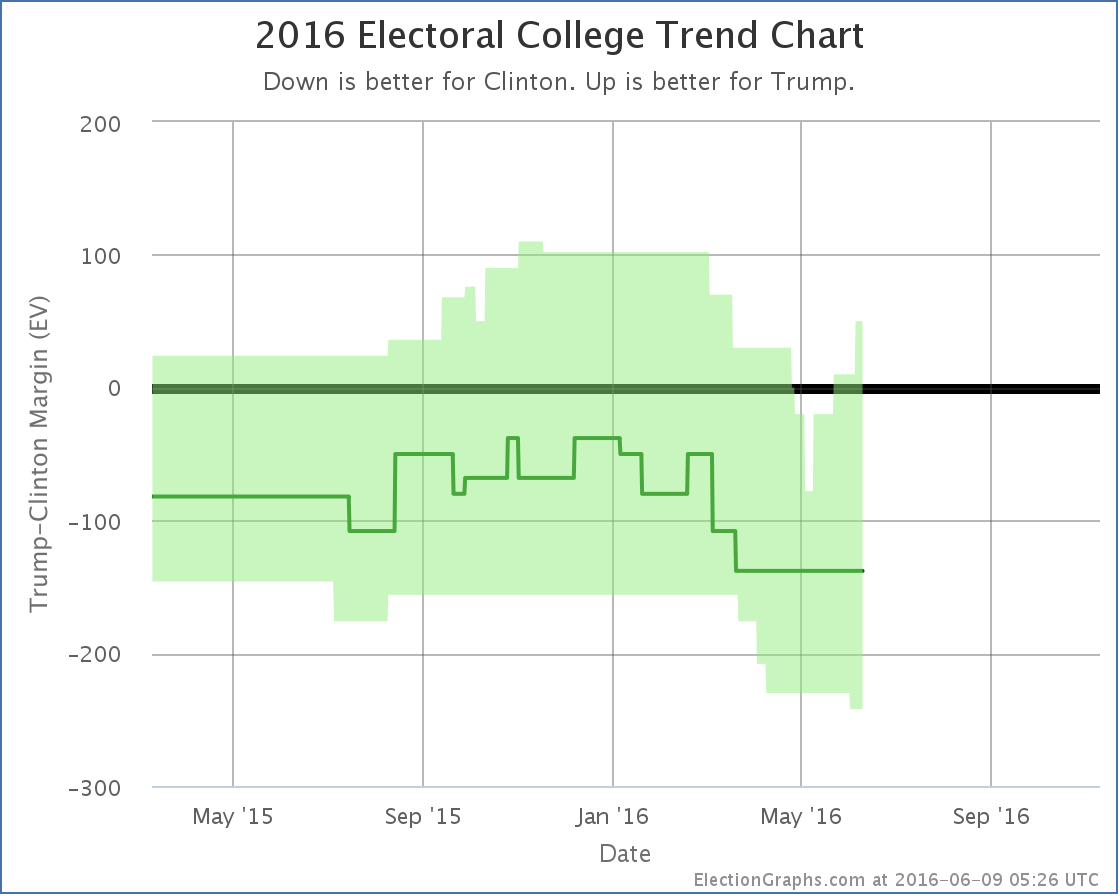
That spike in the upper right is Pennsylvania. In both electoral votes and the potential to make a difference in the race, Pennsylvania is more significant than Utah. If Clinton were to win Utah, it would be a surprise extra on top of an already large win, but a competitive Pennsylvania would potentially be very important to a winning path for Trump.
With Pennsylvania in the mix, if Trump won all the states where he leads, plus all the states where Clinton’s lead is less than 5%, Trump wins by a 50 electoral vote margin. This is his best “best case” since March.
Overall, despite Utah, and despite the fact the center “expected” line hasn’t moved, it looks like the overall trend here is still toward Trump.
The tipping point also moves with this change, and further boosts that impression:
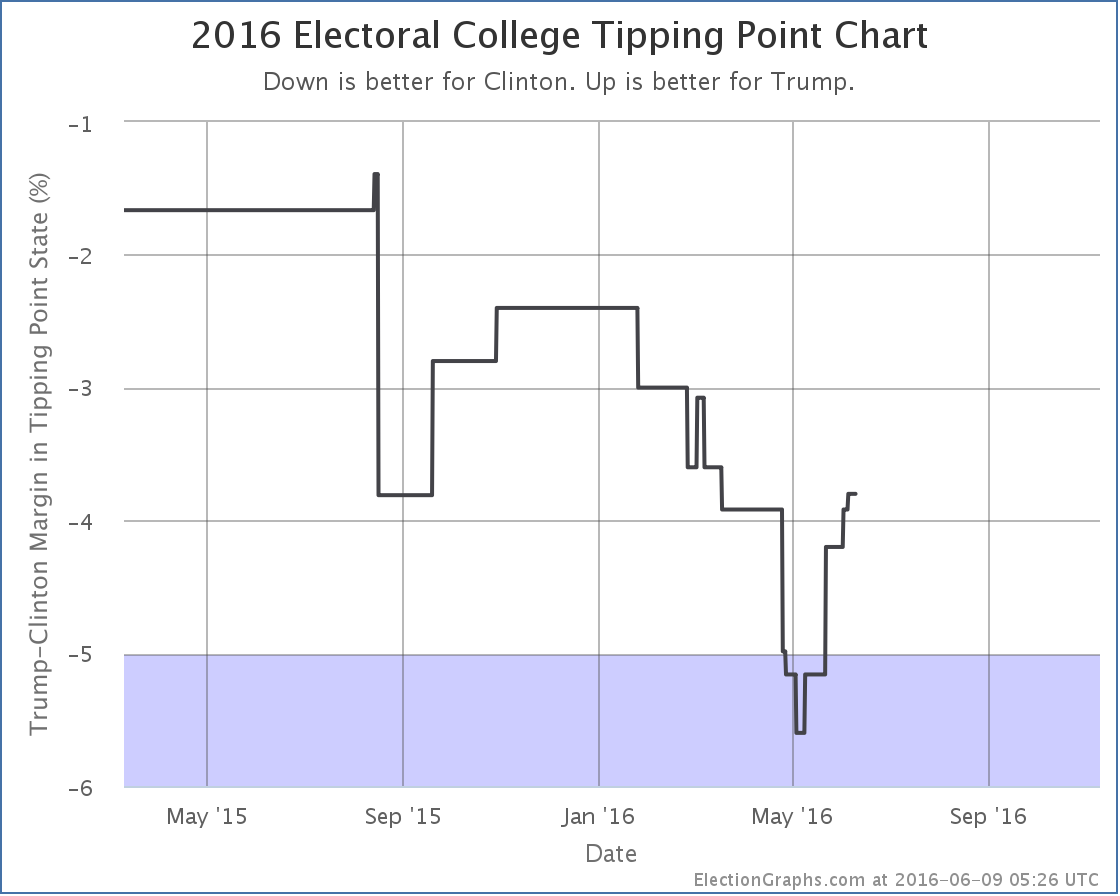
The tipping point moves from a Clinton lead of 3.9% in Nevada to a Clinton lead of 3.8% in Pennsylvania.
Given Clinton clinching the Democratic nomination and the national polls already showing Clinton pulling ahead, an end to the Trump bounce and a beginning of a Clinton bounce is to be expected. But it isn’t showing up here yet…
152.7 days until polls start to close on election night.
Note: This post is an update based on the data on ElectionGraphs.com. Election Graphs tracks both a poll based estimate of the Electoral College and a numbers based look at the Delegate Races. All of the charts and graphs seen in this post are from that site. Additional graphs, charts and raw data can be found there. Follow @ElectionGraphs on Twitter or like Election Graphs on Facebook to see announcements of updates or to join the conversation. For those interested in individual general election poll updates, follow @ElecCollPolls on Twitter for all the polls as they are added. If you find the information in these posts interesting or useful, please consider visiting the tip jar.
Trump clinched the nomination a week and a half ago but there were a few more contests left. CA/NJ/SD/MT/NM have now weighed in with their 303 delegates. Trump got all 303. As an unopposed candidate at this point, this is not unexpected.
And while the Democrats still have DC left, this is the end of the primary process on the Republican side. There are still 18 uncommitted delegates whose preferences are unknown, but their decisions at this point won’t change much.
Lets look quickly at the updated graphs:
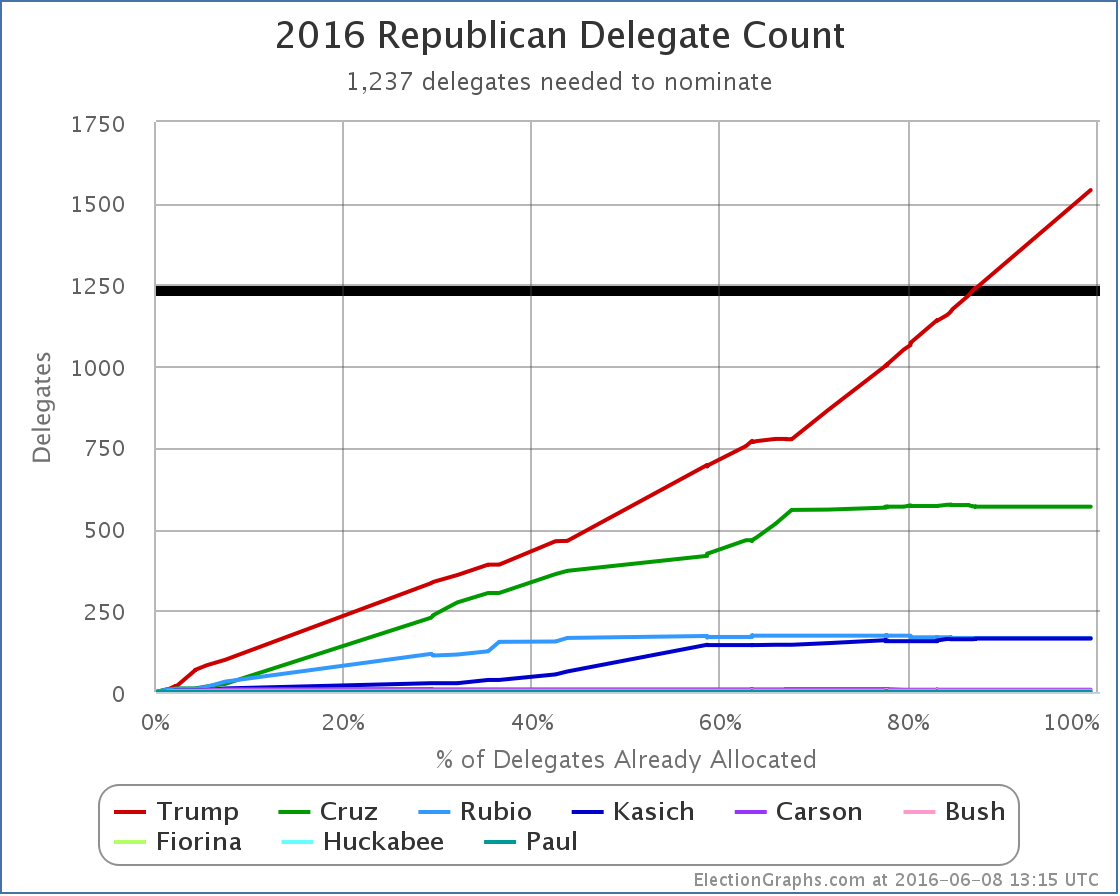
With this update Trump moves from just barely over the “magic number” to well over it with plenty of room to spare. The delegate count is now: Trump 1541, Cruz 569, Rubio 166, Kasich 164, Carson 7, Bush 4, Fiorina 1, Huckabee 1, Paul 1.
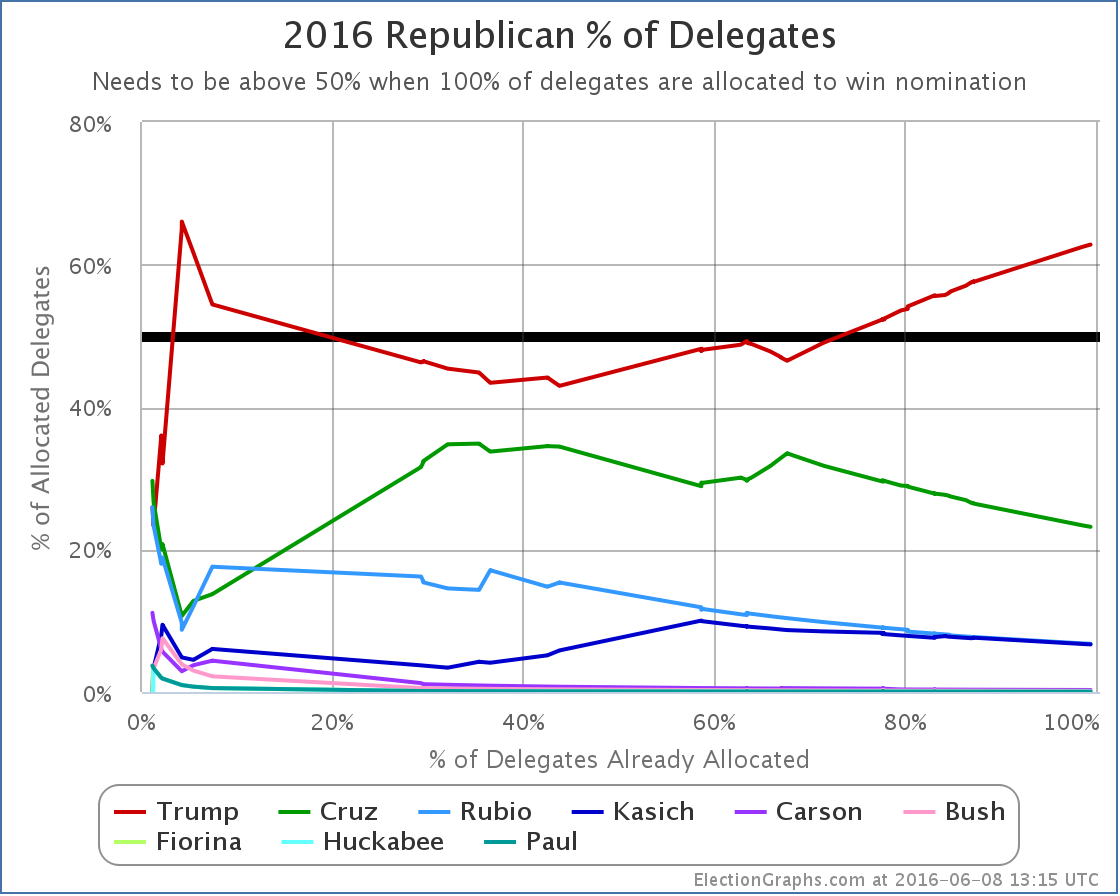
Trump now has 62.80% of the delegates allocated so far.
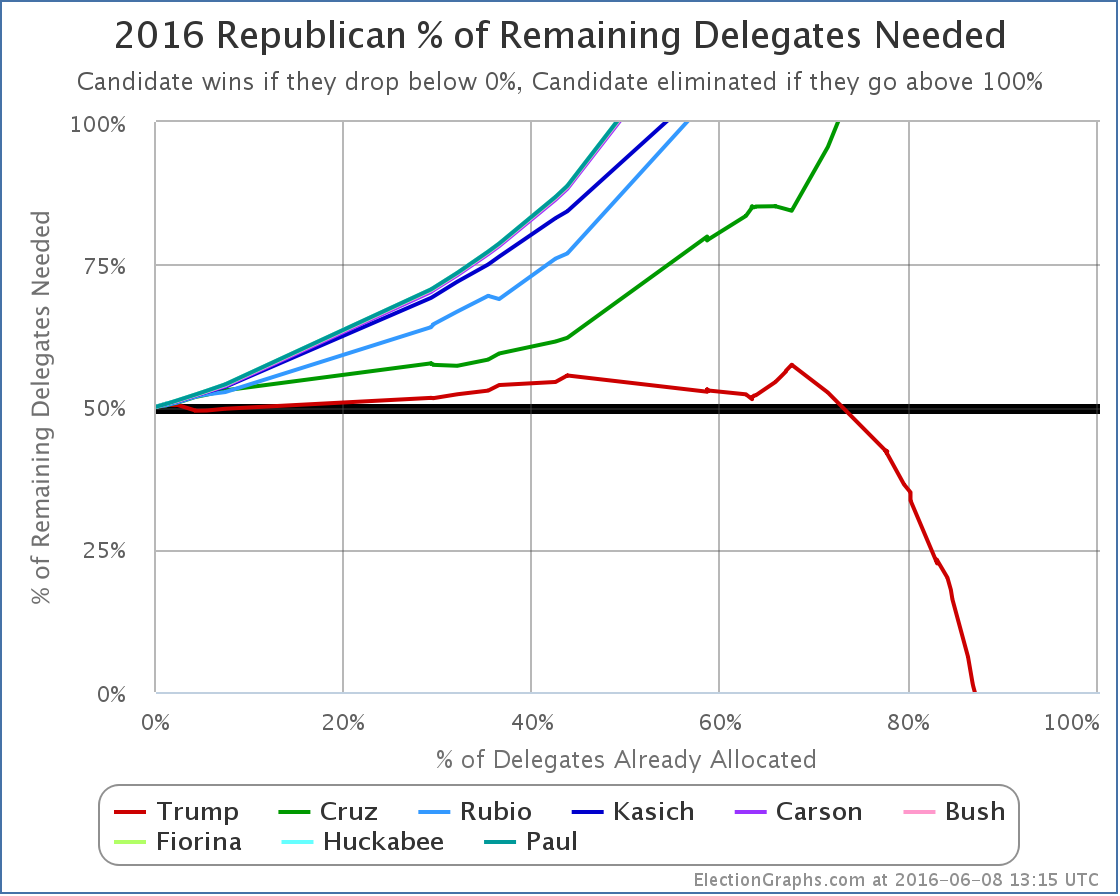
And just for reference, the “% needed to win” in final form.
There isn’t much more to say since this race is over minus any unexpected craziness. If there are any additional developments of note, we’ll update accordingly, but none is expected at the moment.
Time to concentrate on the general election.
Update 2016-06-30 06:00 UTC – Update from Vermont. Net change Kasich -1, Paul +1. (A Kasich delegate who considered themselves free after Kasich dropped out pledged his support to Paul.)
Update 2016-07-20 07:19 UTC: Final Election Graphs estimate was Trump 1541, Cruz 569, Rubio 166, Kasich 163, Carson 7, Bush 4, Paul 2, Fiorina 1, Huckabee 1, TBD 18. We now have the official roll call from the Republican National Convention: Trump 1725, Cruz 484, Kasich 125, Rubio 123, Carson 7, Bush 3, Paul 2, DNV 3. Differences were due to the application of rules in some states requiring all votes to go to candidates that were actually nominated (only Trump was officially nominated at the convention) and movement of additional uncommitted delegates to Trump.
Note: This post is an update based on the data on ElectionGraphs.com. Election Graphs tracks both a poll based estimate of the Electoral College and a numbers based look at the Delegate Races. All of the charts and graphs seen in this post are from that site. Additional graphs, charts and raw data can be found there. Follow @ElectionGraphs on Twitter or like Election Graphs on Facebook to see announcements of updates or to join the conversation. For those interested in individual general election poll updates, follow @ElecCollPolls on Twitter for all the polls as they are added. If you find the information in these posts interesting or useful, please consider visiting the tip jar.
By the Election Graphs count, Clinton now has 2745 delegates, which puts her well over the 2383 require to clinch the nomination.
As they did with the Republicans, AP went out and called many still publicly uncommitted superdelegates and was able to get the winning candidate to the magic number in their count a little earlier than those of us only using public commitments. In this case AP made their announcement Monday. The count here went over the magic number within minutes of the polls closing in New Jersey Tuesday night.
As of the writing of this post, all but 4 straggling delegates from New Jersey out of the 694 delegates up for grabs last night seem to be reasonably determined, so lets run down then numbers.
After Puerto Rico, Clinton only needed 5.05% of the remaining delegates to win. Sanders needed 95.19% of the remaining delegates. Clinton needed 43 delegates, Sanders needed 811.
In CA/NJ/NM/MT/SD/ND Clinton got 391 delegates while Sanders got 299. (As mentioned, there are still 4 TBD from NJ as of this writing.)
In the days between Puerto Rico and the June 7th results coming in, superdelegate changes yielded a net change of: Clinton +14, Sanders +1, O’Malley -1. Yes, that lone O’Malley superdelegate finally flipped… to Clinton.
Total change since Puerto Rico: Clinton +405, Sanders +300, O’Malley -1
That is Clinton 57.53%, Sanders 42.61%. (Adds to more than 100% because Clinton took the one delegate from O’Malley.)
So Clinton met her target, Sanders did not.
405 delegates is significantly more than the 43 delegates Clinton needed to go over the top.
She clinches. She is the presumptive nominee.
Lets check out the updated graphs:
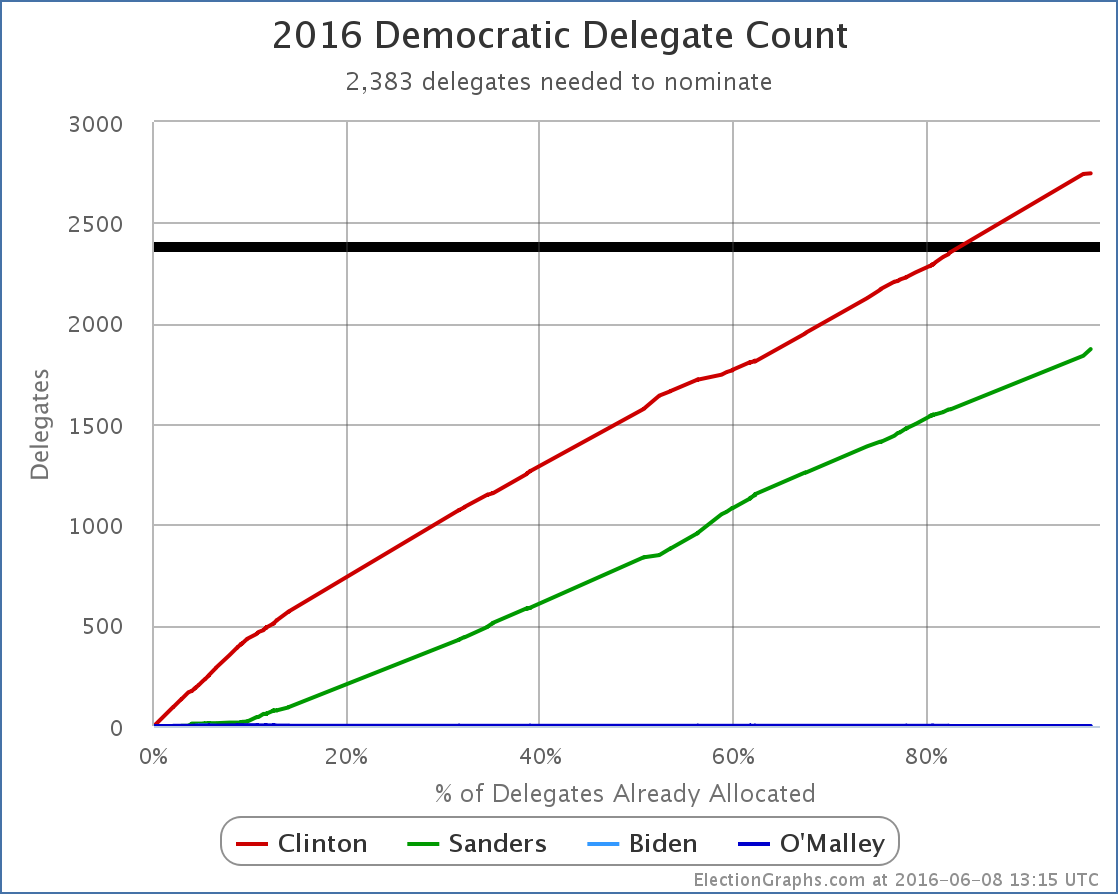
New delegate totals: Clinton 2745, Sanders 1872. Clinton blows past 2383 and is now well beyond where she needed to get.
There are 148 delegates left. Washington DC has 20 up for grabs next week. There are those 4 from New Jersey too. The other 124 are superdelegates who have not yet stated a preference. Clinton needs none of these delegates. Sanders could get every single one of these delegates, and would still lose decisively.
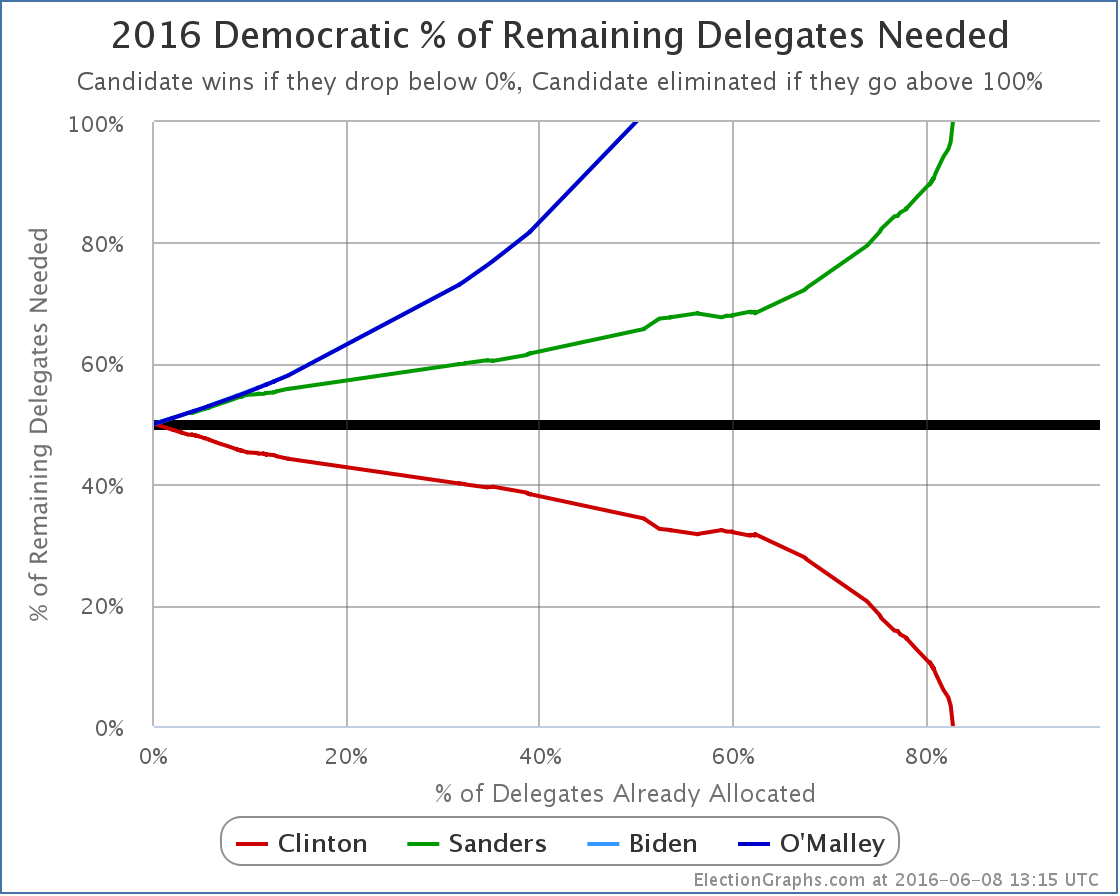
The “% of delegates needed to win” chart is complete. Clinton dropped below 0%, Sanders went above 100%.
One more graph:
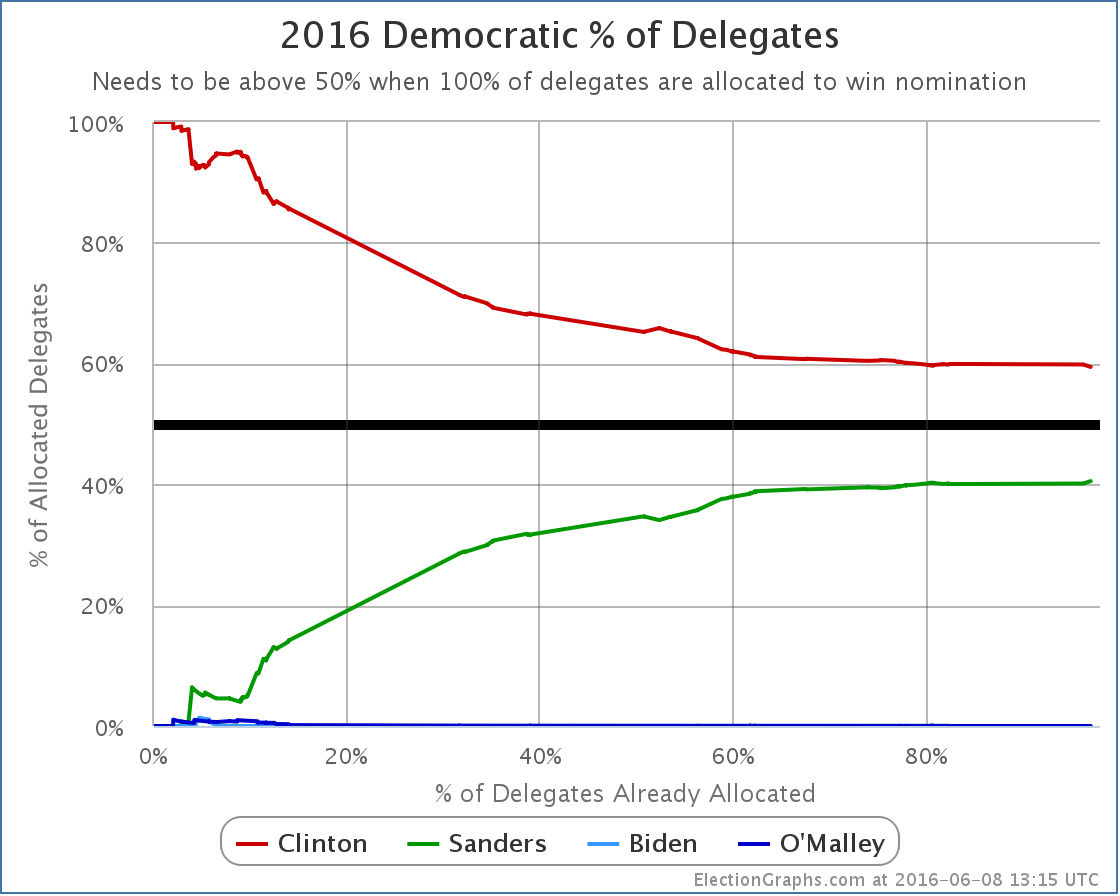
Since she started at 100% of the delegates by getting superdelegates before the first primaries or caucuses even happened, Clinton’s “% of delegates” number of course trended downward through most of the cycle. But for quite some time now the delegate race has stuck pretty close to being a 60% to 40% split in Clinton’s favor. As of now, it sits at Clinton 59.45%, Sanders 40.55%.
OK, now to step back a little…
Clinton dominated this race from the beginning. There were only a handful of moments where Sanders even managed to close the gap a little bit. Sanders was never even close. It was clear since the beginning of March… at the latest… that is being generous… it was fairly clear even before that… that Sanders catching up would take a miracle. The one thing that has been amazing throughout the primary process is the ability of many Sanders supporters to be in complete denial about this in the face of overwhelming evidence. It is one thing to be enthusiastic about your candidate and even to hope for that miracle, but it is another thing to not even recognize that you are losing and that it would indeed take that miracle to win.
And yes, some of those Sanders folks are still in denial even now. Because superdelegates. So a quick look. Right now we have Clinton 2745, Sanders 1872. There are 124 remaining superdelegates. Lets give them all to Sanders. For fun give Sanders all 20 DC delegates and the 4 from New Jersey too. Now we have Clinton 2745, Sanders 2020. All delegates are now allocated. Sanders is still short. To get to 2382 he would need at least 182 delegates who have committed to Clinton to change their minds and vote for Sanders instead. Clinton has 532 superdelegates by the latest count. So that means 34.2% of the superdelegates currently committed to Clinton would have to flip.
They would have to do that flip in the face of Clinton having won the popular vote (even if you include estimated popular vote for caucus states), Clinton having won the pledged delegate count, and Clinton having won the most states. Not to mention significant numbers of the superdelegates not simply being lukewarm Clinton supporters, but being people who she has actively cultivated for many years, a good number of which have actually been active in her campaign.
Is it mathematically possible? Yes. Of course it is. Is it going to happen absent something catastrophic happening to Clinton? No.
Some Sanders folks are still holding out the “What if Clinton is indicted?” scenario. My guess is most superdelegates would consider it an unfair and unjust indictment and stick by their candidate. It probably wouldn’t be enough. Perhaps I suppose. It is a stretch though. More realistically it would take a debilitating health issue or some brand new scandal so serious it dwarfs everything that has come up so far. Can you imagine these sorts of things? Of course. But they are all unforeseen unpredictable types of event, not things you decide to continue a campaign based on. After all, there are ways Martin O’Malley can still win the nomination too!
You can conjure similar scenarios on the other side too of course, but absent that kind of craziness, we now have our nominees in both parties.
So we have Clinton vs Trump. Time to start focusing on the general election analysis!
153.4 days until polls start to close on election day!
Update 2016-06-12 17:16 UTC – Superdelegate update. Net Change: Clinton +11
Update 2016-06-12 17:43 UTC – Missed one change in the superdelegate update above. Additional Change: Clinton -1. (So Clinton +10 for this day’s scan.)
Update 2016-06-12 18:02 UTC – Updates from California, New Jersey, and South Dakota (including the remaining 4 TBD delegates from New Jersey). Net change: Sanders +4.
Update 2016-06-15 01:40 UTC – Superdelegate update. Net Change: Clinton -3, Sanders +1.
Note: This post is an update based on the data on ElectionGraphs.com. Election Graphs tracks both a poll based estimate of the Electoral College and a numbers based look at the Delegate Races. All of the charts and graphs seen in this post are from that site. Additional graphs, charts and raw data can be found there. Follow @ElectionGraphs on Twitter or like Election Graphs on Facebook to see announcements of updates or to join the conversation. For those interested in individual general election poll updates, follow @ElecCollPolls on Twitter for all the polls as they are added. If you find the information in these posts interesting or useful, please consider visiting the tip jar.
Edit 15:19 UTC to mention the 4 delegates from New Jersey in the list of remaining delegates and the calculations for superdelegates flipping.
Since the last update there have been polls in New Jersey, California and Utah. The results in Utah are the ones that made a difference:
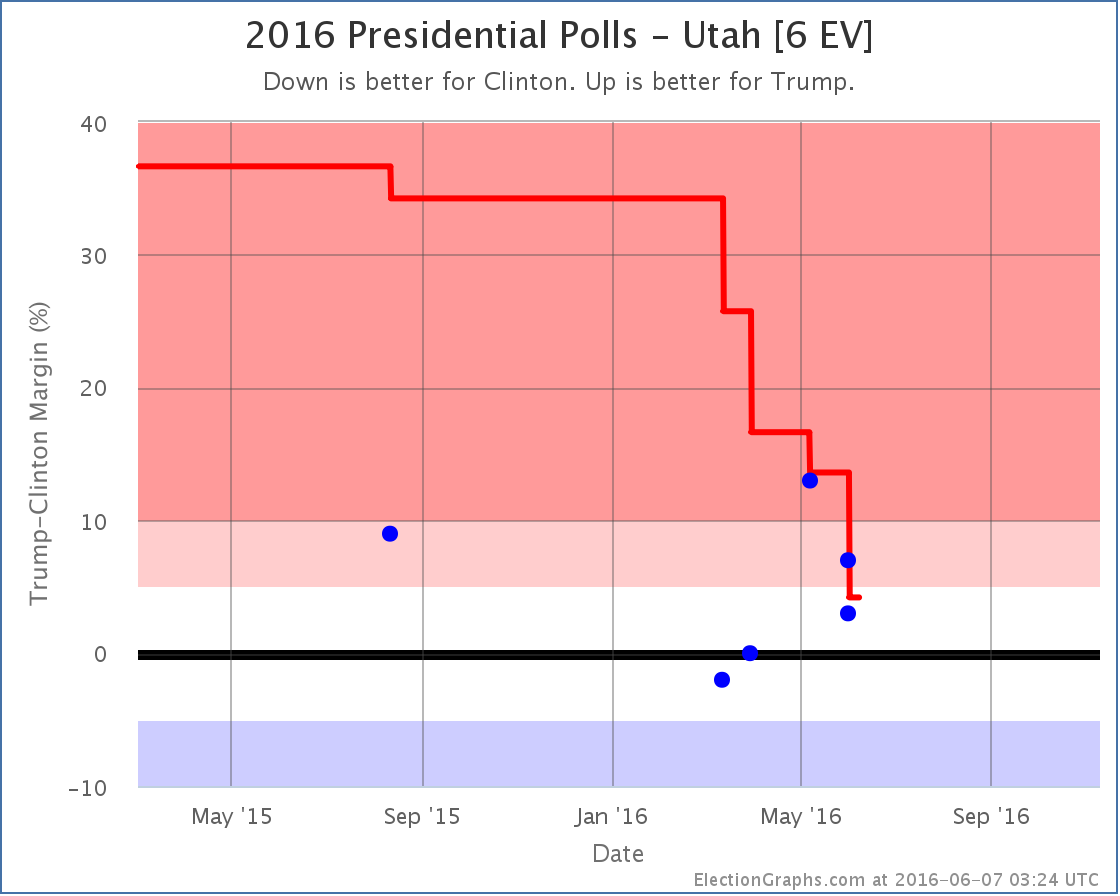
There are actually two new results logged in Utah, both from Gravis, covering the same time period. They asked the general election question twice. Once with just Clinton and Trump showing Trump leading by 7%, then again adding Johnson as a possibility, which reduces Trump’s lead to 3%. Rather than pick one or the other result, I include both.
It could be argued that this gives a single poll double weight in the average, but the way I think of it, this really is two separate results, measuring the election in different ways. So I chose to include both. This is arguable, and other people tracking poll averages may choose a different route. But this is the way I am doing it.*
In any case, these polls are within the range we have seen in all the polls this year. There is quite a bit of variability, but the one thing that is clear is that the Republican lead is much smaller than the 21% to 48% margins the Republicans saw in the 1996 to 2012 general elections. Since my poll averages are “primed” with the results of those five elections, it took awhile for the poll average to move from the huge Republican margin one would expect if Utah followed the pattern of the last few elections down to the 4.2% margin Trump now has. Put simply, this change was so large, a lot of evidence was needed before the average really believed it.
With Trump’s lead in Utah now less than 5%, it now goes into the Election Graphs “Weak Trump” category, which means it is a possible Clinton pick up. So her best case scenario improves:
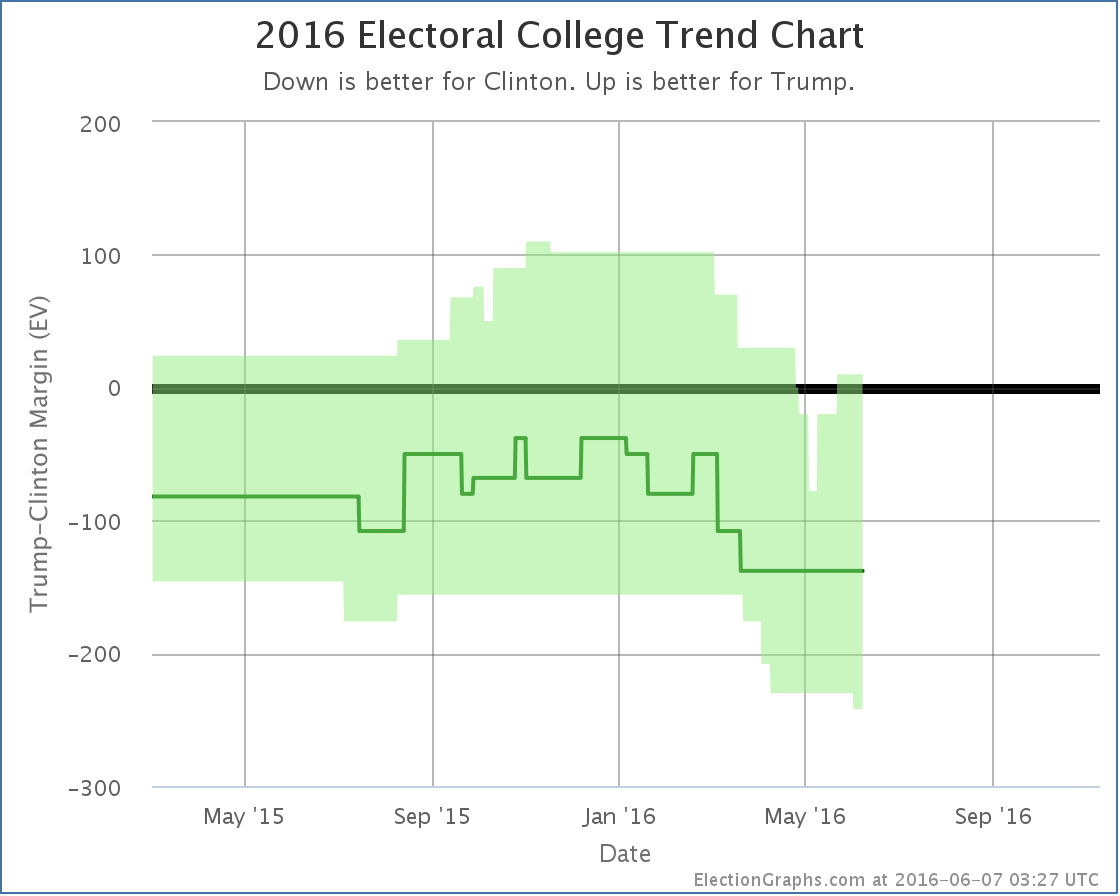
That little nub at the bottom right represents the possibility of Clinton winning Utah.
Leaving out the states where one of the candidates is ahead by more than 10%, the center of the spectrum now looks like this:
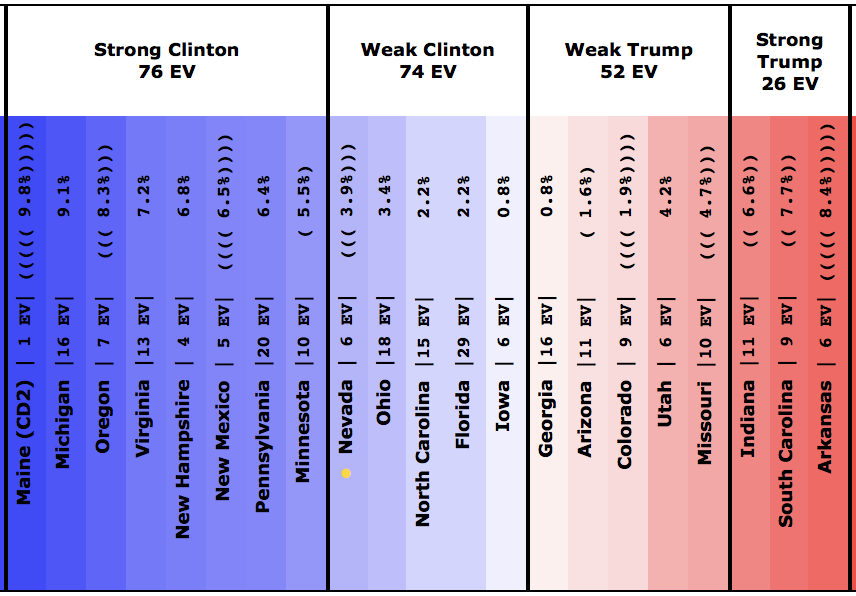
There are a lot of states here that haven’t yet had a full five polls for our average (indicated by the parentheses). But the fact that Georgia, Arizona and Utah may be competitive for Clinton show that Trump may indeed be “redrawing the map”… just not in his favor.
The tipping point is only a 3.9% Clinton lead on the other hand, so it isn’t an insurmountable lead by any means. Trump could still win this if campaign events go his way.
But Utah a possible Democratic stretch goal? Wow. Utah!
For reference, the last time Utah went Democratic was the Lyndon Johnson landslide over Barry Goldwater in 1964. Now, I still wouldn’t bet on Clinton winning Utah. But that it is even close is still stunning.
The overall situation summary now looks like this:
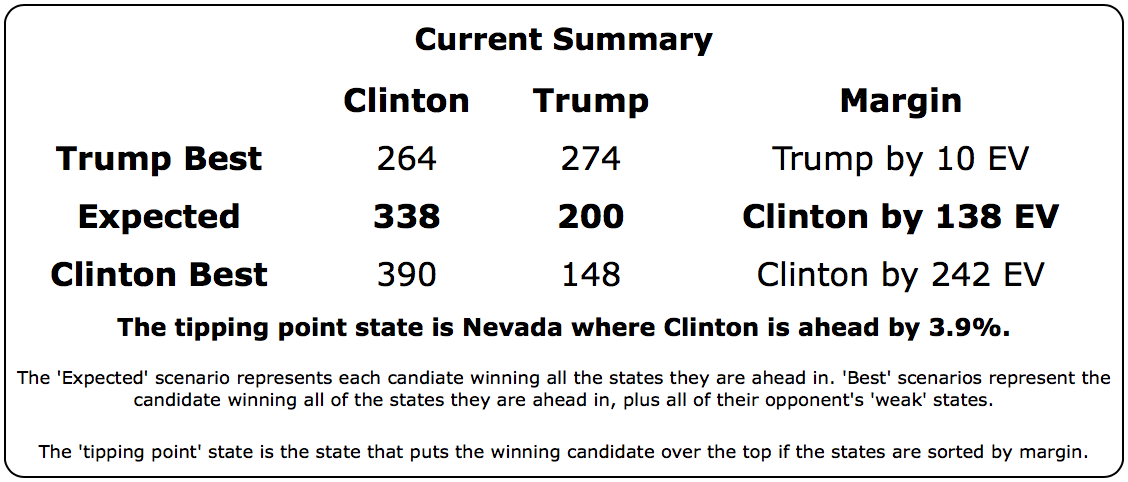
So wait, is the Trump bounce over? Well, this is a move in Clinton’s direction, so it breaks the streak of movements in Trump’s direction that had lasted for about a month. So by that measure at least the “bump” may be over.
This is just one change though, it would be premature to say that the trend is now in Clinton’s direction. As usual, we need to wait for more polls…
154.8 days until the general election polls start to close. There will be plenty of movement between now and then. Stay tuned.
* For more notes on how polls including third and forth parties will be treated on Election Graphs, see the archive of @ElecCollPolls tweets from May 29th.
Note: This post is an update based on the data on ElectionGraphs.com. Election Graphs tracks both a poll based estimate of the Electoral College and a numbers based look at the Delegate Races. All of the charts and graphs seen in this post are from that site. Additional graphs, charts and raw data can be found there. Follow @ElectionGraphs on Twitter or like Election Graphs on Facebook to see announcements of updates or to join the conversation. For those interested in individual general election poll updates, follow @ElecCollPolls on Twitter for all the polls as they are added. If you find the information in these posts interesting or useful, please consider visiting the tip jar.
Edit 14:20 UTC – Fixed typo.
After the Virgin Islands, Clinton only needed 9.26% of the remaining delegates to win. Sanders needed 90.96% of the remaining delegates.
In Puerto Rico, Clinton got 36 delegates, Sanders got 24.
Since the Virgin Islands, 6 more superdelegates were added to Clinton’s count as well.
So total change since the Virgin Islands: Clinton +42, Sanders +24.
That is Clinton 63.64%, Sanders 36.26%.
So Clinton met her target, Sanders did not.
Updated graphs:
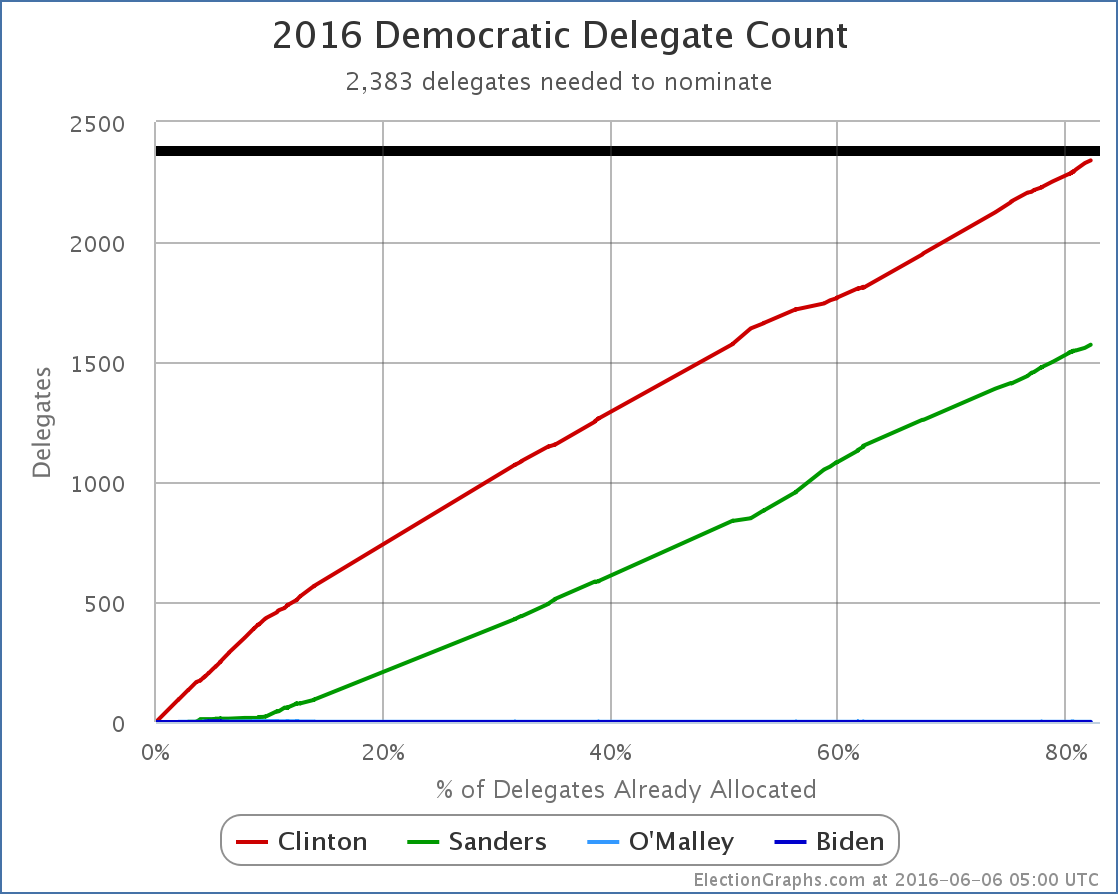
New delegate totals: Clinton 2340, Sanders 1572, O’Malley 1.
There are 852 delegates left. Clinton needs 43 of them. Sanders needs 811 of them.
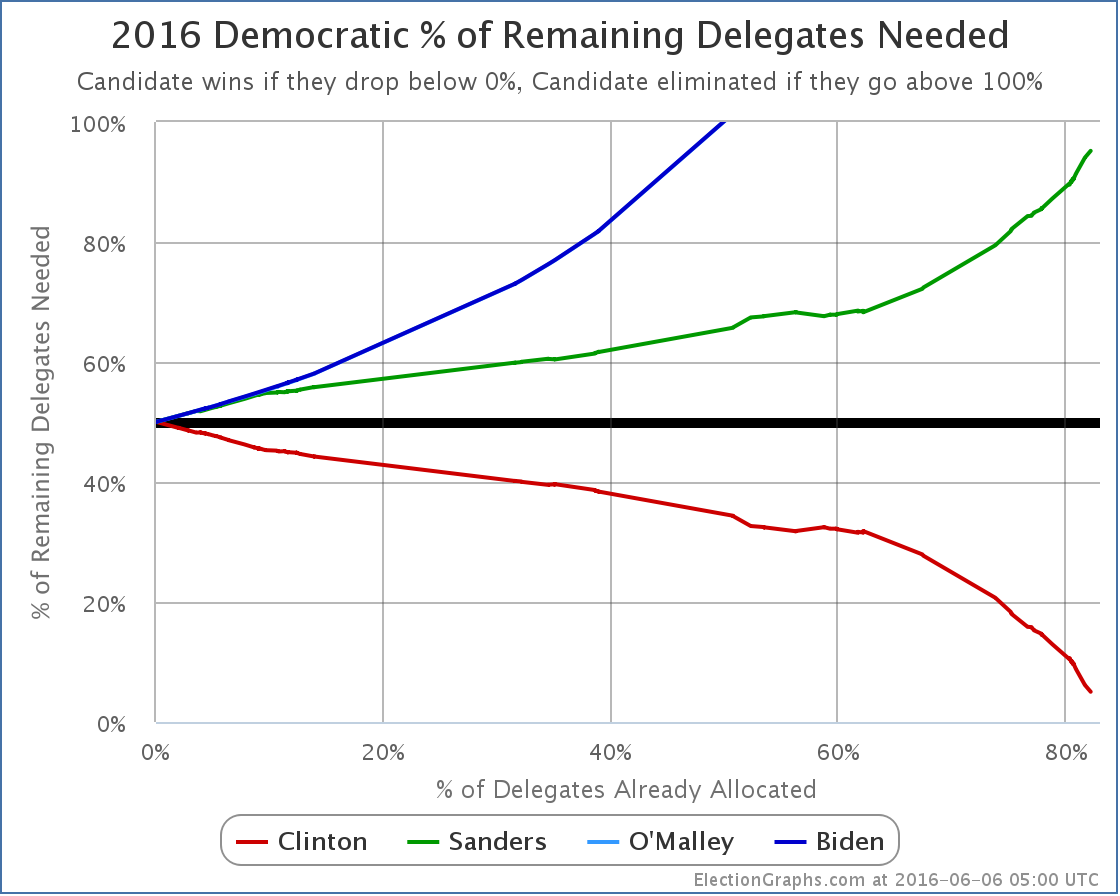
Clinton now needs 5.05% of the remaining delegates to win. Sanders needs 95.19%.
This of course includes superdelegates. Please see any number of previous posts here on Election Graphs as to why it is appropriate to include them, even though they can change their minds until they vote at the convention. If any superdelegates change their minds publicly before then, it will be tracked here.
Right now Clinton only needs 43 more delegates to clinch the nomination. There are still about 139 who have not stated a preference. There have been media reports that Clinton has 40+ superdelegates who have privately committed to her that they are waiting to roll out after the New Jersey results almost certainly push her over 2383 anyway. NBC, AP and some others also have a higher current delegate count than I do for Clinton by about 20 delegates due to information they have collected privately from superdelegates.
Put all of that together, and it is actually very possible, indeed probably very likely, that Clinton ALREADY has more than 2383 delegates that she is sure of. In terms of public confirmation, she is just a few handfuls of delegates away, the number of handfuls depending on whose delegate count you go by.
Superdelegates could give Clinton the nomination at any moment now. But since Clinton would prefer to win after the votes of regular citizens are counted, her campaign is almost certainly asking any currently uncommitted superdelegates leaning toward her to wait. So with as much certainty as you can ever get in these sorts of things, expect Clinton to be declared the presumptive nominee by everybody who does such things shortly after the polls start closing on June 7th.
For this site, the blog post about the June 7th results probably won’t go out until the next morning, but watch @ElectionGraphs on Twitter for hourly updates of the delegate totals, including of course noting when she wins the nomination by our own count.
Update 2016-06-07 00:52 UTC: I almost put “…at the latest.” on the end of the paragraph about the networks calling the result soon after polls start closing on the 7th. But alas, I didn’t. A few minutes ago AP reported that by their count Clinton is over 2383 and is therefore the presumptive nominee. They are including superdelegates who have not yet publicly expressed a preference, but have done so when asked privately. The count here will take a little bit to catch up, since it is dependent on public statements by superdelegates and/or actual election results. But the result will be the same…
Update 2016-06-07 22:31 UTC: My source trying to catch up with superdelegate info resulting from AP’s updated counts. Net Change: Clinton +15, Sanders +1, O’Malley -1. Yes, that one O’Malley superdelegate finally flipped… to Clinton.
Update 2016-06-07 23:55 UTC: Updated the number of superdelegates in a bunch of states as per Green Papers. Most changes were uncommitted slots anyway, but there was a net change of Clinton -1. There was no net change to the total number of delegates.
Note: This post is an update based on the data on ElectionGraphs.com. Election Graphs tracks both a poll based estimate of the Electoral College and a numbers based look at the Delegate Races. All of the charts and graphs seen in this post are from that site. Additional graphs, charts and raw data can be found there. Follow @ElectionGraphs on Twitter or like Election Graphs on Facebook to see announcements of updates or to join the conversation. For those interested in individual general election poll updates, follow @ElecCollPolls on Twitter for all the polls as they are added. If you find the information in these posts interesting or useful, please consider visiting the tip jar.
Edit 17:40 to fix a typo where I said Clinton needed 42 delegates instead of 43 in one of the places it is mentioned.
With the final results all but inevitable, these updates will be somewhat mechanical absent something unexpected happening.
After Oregon and Kentucky, Clinton only needed 11.37% of the remaining delegates to win. Sanders needed 88.84% of the remaining delegates.
In the Virgin Islands, Clinton got 6 delegates, Sanders got 1.
In other changes since Oregon and Kentucky due to superdelegate updates and adjustments in Maryland, Oregon and Michigan there was a net change of Clinton +17, Sanders +8.
So total change since Oregon and Kentucky: Clinton +23, Sanders +9.
That is Clinton 71.88%, Sanders 28.13%.
So Clinton met her target, Sanders did not.
Updated graphs:
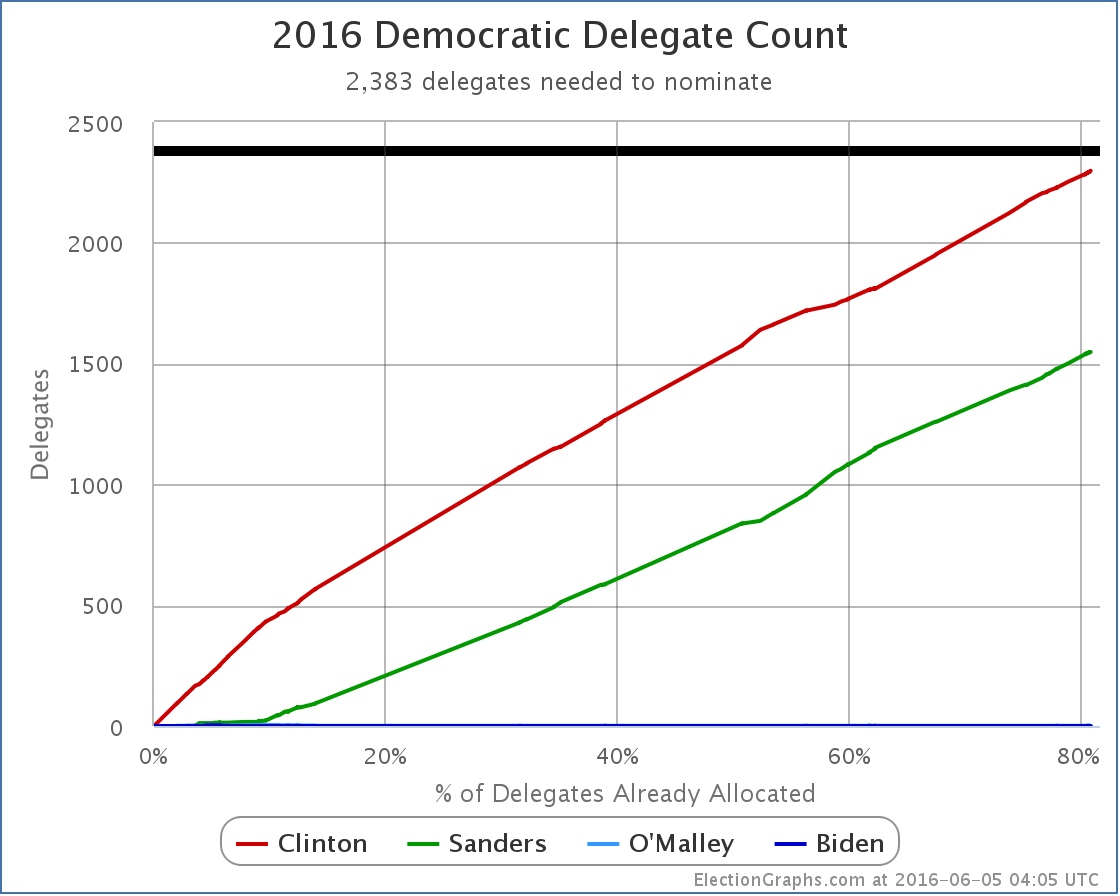
New delegate totals: Clinton 2298, Sanders 1548, O’Malley 1.
There are 918 delegates left. Clinton needs 85 of them. Sanders needs 835 of them.
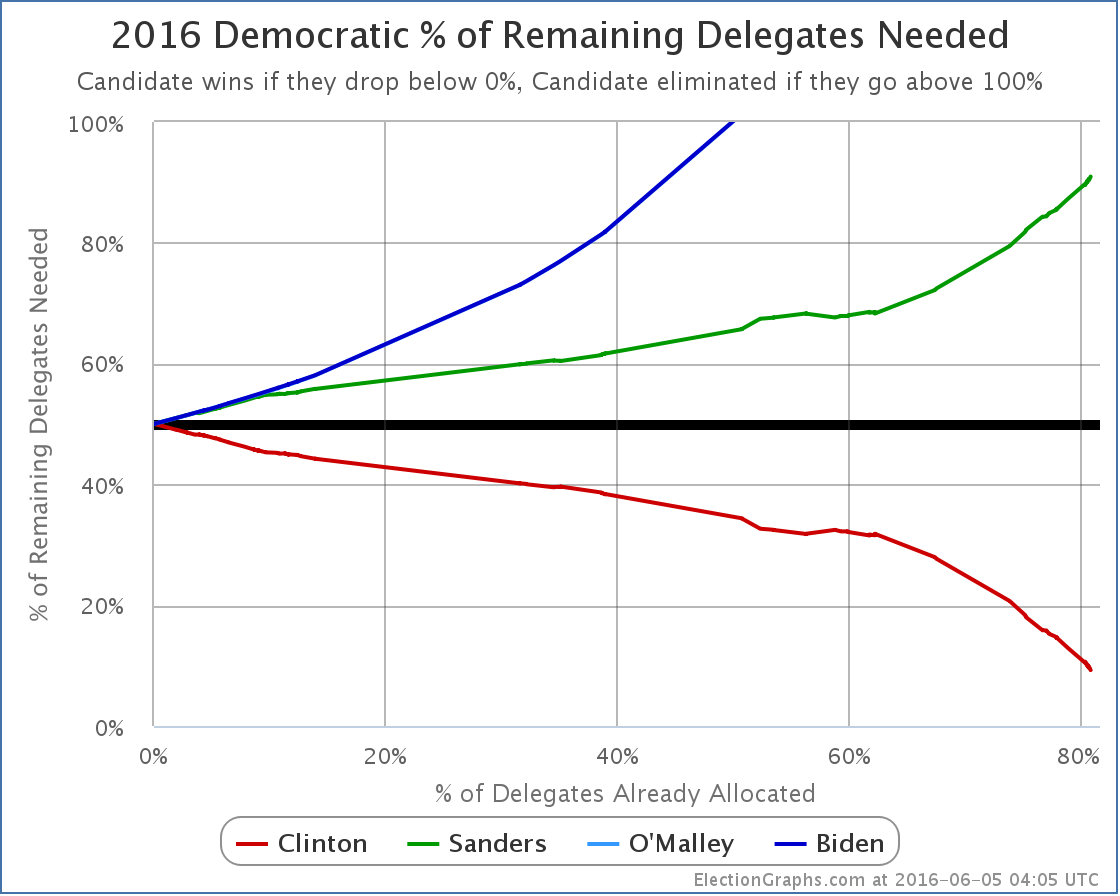
Clinton now needs 9.26% of the remaining delegates to win. Sanders needs 90.96%.
This of course includes superdelegates. The Sanders camp continues to insist that you shouldn’t count superdelegates until the convention because until then they can change their minds. It is true they can change their minds, but we have been logging whenever that happens, and it has been rare. The best we can tell about how superdelegates will vote is to take their public preferences at face value. If they change their minds and they say so, we will know and the counts will change. In the mean time, to ignore their preferences in the count would be to intentionally ignore data about the current situation.
Right now Clinton only needs 85 more delegates to clinch the nomination. There are still 145 superdelegates who have not stated a preference. They could put Clinton over the top at any time. The Clinton folks undoubtedly do not want superdelegates to put them over the top though, so they may actually be asking the remaining superdelegates NOT to make any endorsements in the next few days.
Some media agencies actually have Clinton’s delegate count a bit higher than our count, which matches The Green Papers exactly at this point. This is because those media organizations have been able to privately confirm the preferences of some superdelegates who have not made public commitments. Both this site and the Green papers use the Wikipedia superdelegate tally as our source, and this only includes publicly confirmed preferences.
In any case, we are very close. Between the Puerto Rican primary and superdelegates, it is possible Clinton will hit the magic number before the big contests on June 7th. Most likely though, she’ll get there as soon as the polls close in New Jersey on the 7th. The rest of the June 7th states will just be icing on the cake.
Update 21:45 – Superdelegate scan +6.
Note: This post is an update based on the data on ElectionGraphs.com. Election Graphs tracks both a poll based estimate of the Electoral College and a numbers based look at the Delegate Races. All of the charts and graphs seen in this post are from that site. Additional graphs, charts and raw data can be found there. All charts above are clickable to go to the current version of the detail page the chart is from, which may contain more up to date information than the snapshots on this page, which were current as of the time of this post. Follow @ElectionGraphs on Twitter or like Election Graphs on Facebook to see announcements of updates or to join the conversation. For those interested in individual general election poll updates, follow @ElecCollPolls on Twitter for all the polls as they are added.
Edit 2016-06-06 16:55 UTC to add yesterday’s superdelegate scan, which I had neglected to add at the time.
The national polls at this point show that Trump’s “bump” from clinching the nomination is most likely already over, and Clinton has started to gain ground again. You can see this in both the Pollster and RCP charts. Here at Election Graphs though we track the state level polls and model the electoral college.
Since in any given state there are fewer polls than are done at the national level, the state poll averages move more slowly, and therefore the national picture also reacts more slowly to changes in the state of the race. So while the national polls have seen the bounce come or go, we are still seeing improvement in Trump’s situation.
Since the last update about 9 days ago there have been polls added in New Mexico, Virginia, North Carolina, Oregon, Michigan, New York, New Jersey, New Hampshire, Georgia, California (x4), and Florida. The Florida one is the one that resulted in an overall change.
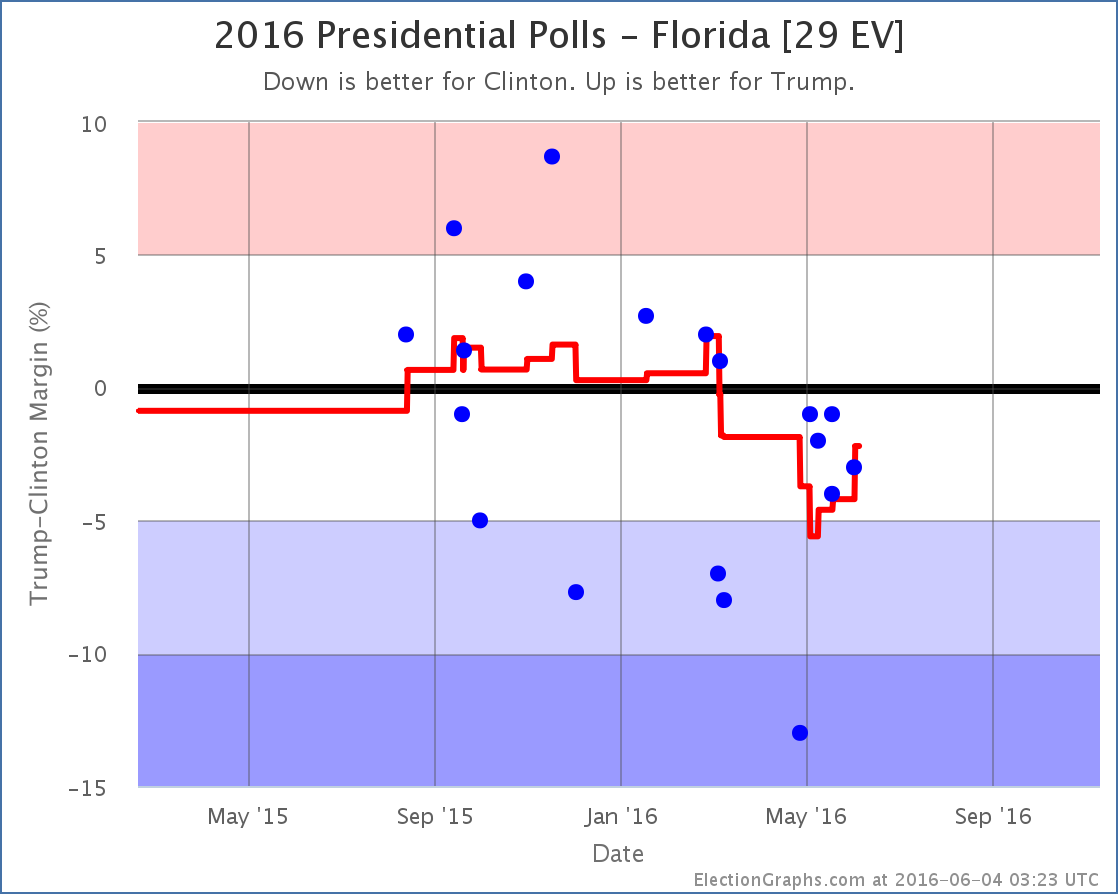
Basically, what now looks like an outlier poll from April showing Clinton with a huge 13% lead rolls off the average and so we have a pop in the Trump direction. Florida doesn’t change categories though. I had it classified as “Weak Clinton” before, and it is still “Weak Clinton” now.
But Florida was the tipping point state, the state that would have put Clinton over the top if you rank the states by how strongly they support one candidate over the other. So when Florida moves, so does the tipping point:
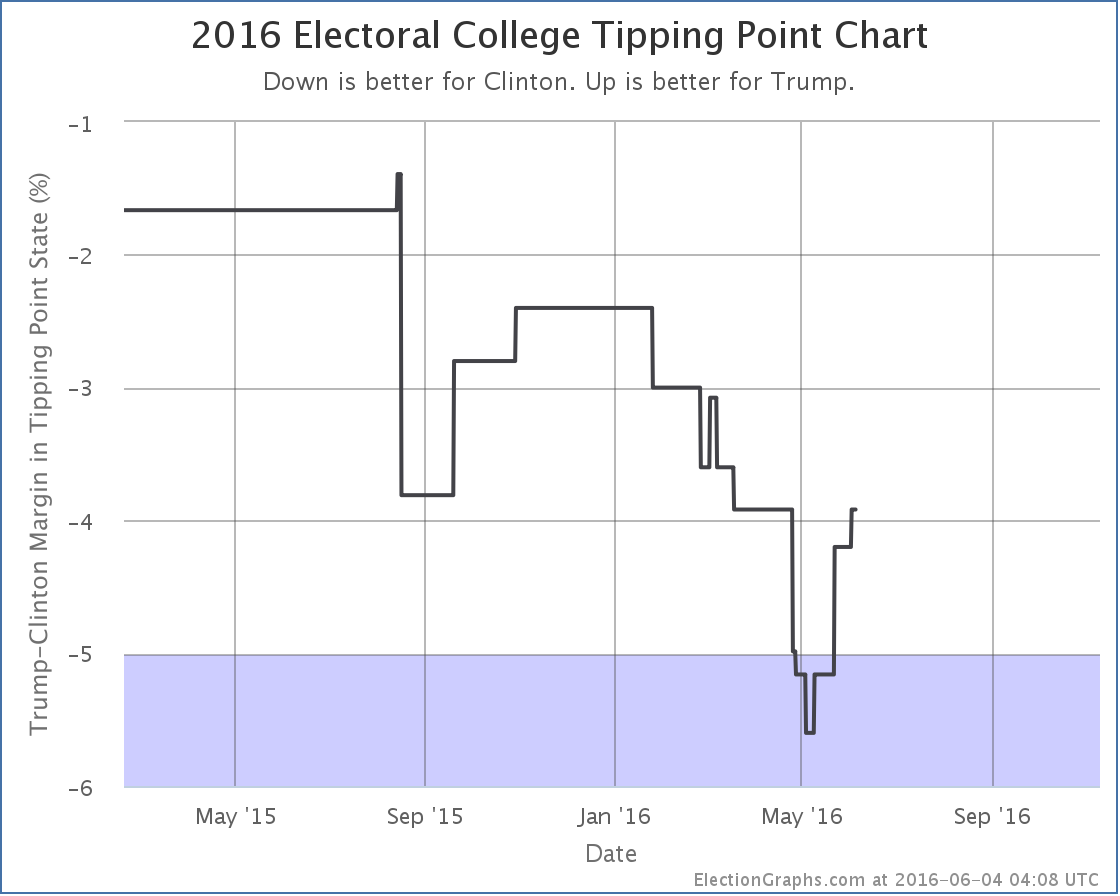
The tipping point moves from a 4.2% Clinton lead in Florida to a 3.9% Clinton lead in Nevada.
This means that while Clinton is clearly ahead, it would only take about 2% of people changing their minds (if those 2% were evenly distributed across the country) to flip the lead to Trump. You could get a similar result from the undecideds breaking disproportionately to Trump.
The national polls indicate Clinton is pulling further ahead again. We will quite possibly see that soon at the state by state level tracked here. But not yet. For now, the analysis here is still showing Trump gaining ground.
157.3 days until polls start to close on election night 2016.
Note: This post is an update based on the data on ElectionGraphs.com. Election Graphs tracks both a poll based estimate of the Electoral College and a numbers based look at the Delegate Races. All of the charts and graphs seen in this post are from that site. Additional graphs, charts and raw data can be found there. All charts above are clickable to go to the current version of the detail page the chart is from, which may contain more up to date information than the snapshots on this page, which were current as of the time of this post. Follow @ElectionGraphs on Twitter or like Election Graphs on Facebook to see announcements of updates or to join the conversation. For those interested in individual general election poll updates, follow @ElecCollPolls on Twitter for all the polls as they are added.
|
|


