- 13:39:02 A chart showing the “polling quality” of the best ten polled candidate combos is now on the national comparison page. http://t.co/gB1NMX7egi
- 14:09:13 Poll Added: Rutgers in NJ from 2015-02-03 to 2015-02-10 – Clinton 58% to Christie 35% http://t.co/uHPQnLCUQg
- 14:09:43 Clinton vs Christie state category change: NJ has moved from Strong Clinton to Solid Clinton http://t.co/uHPQnLCUQg
- 14:12:46 Poll Added: Rutgers in NJ from 2015-02-03 to 2015-02-10 – Clinton 58% to Bush 32% http://t.co/ScbFRZ2ihm
- 14:17:29 Poll Added: Rutgers in NJ from 2015-02-03 to 2015-02-10 – Clinton 60% to Walker 29% http://t.co/UrvfYfLMA0
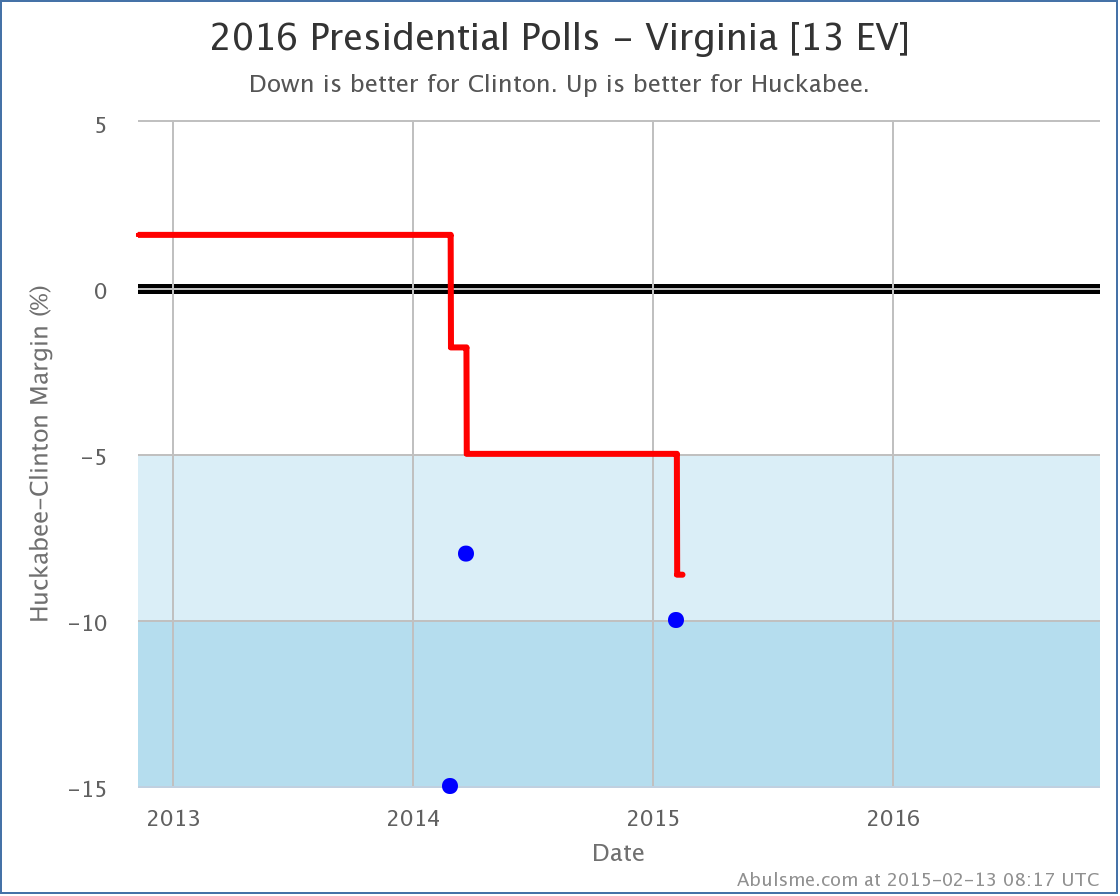
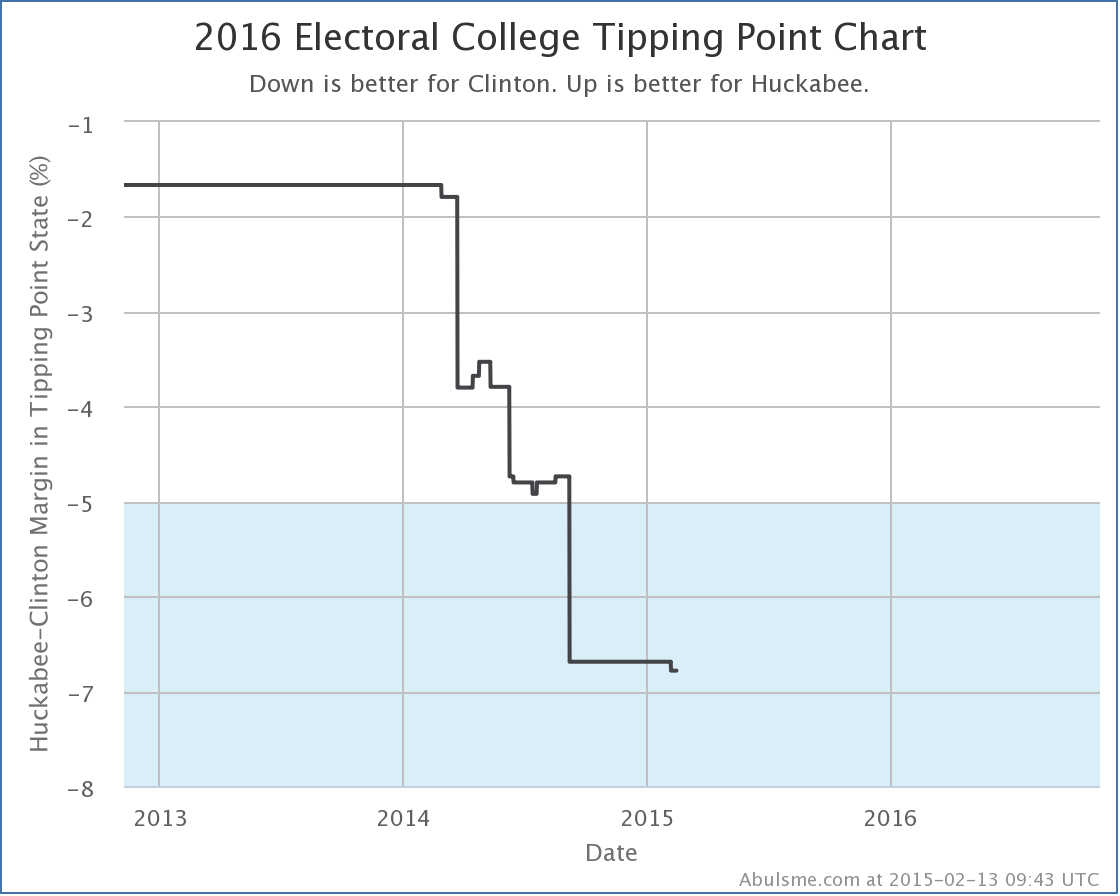
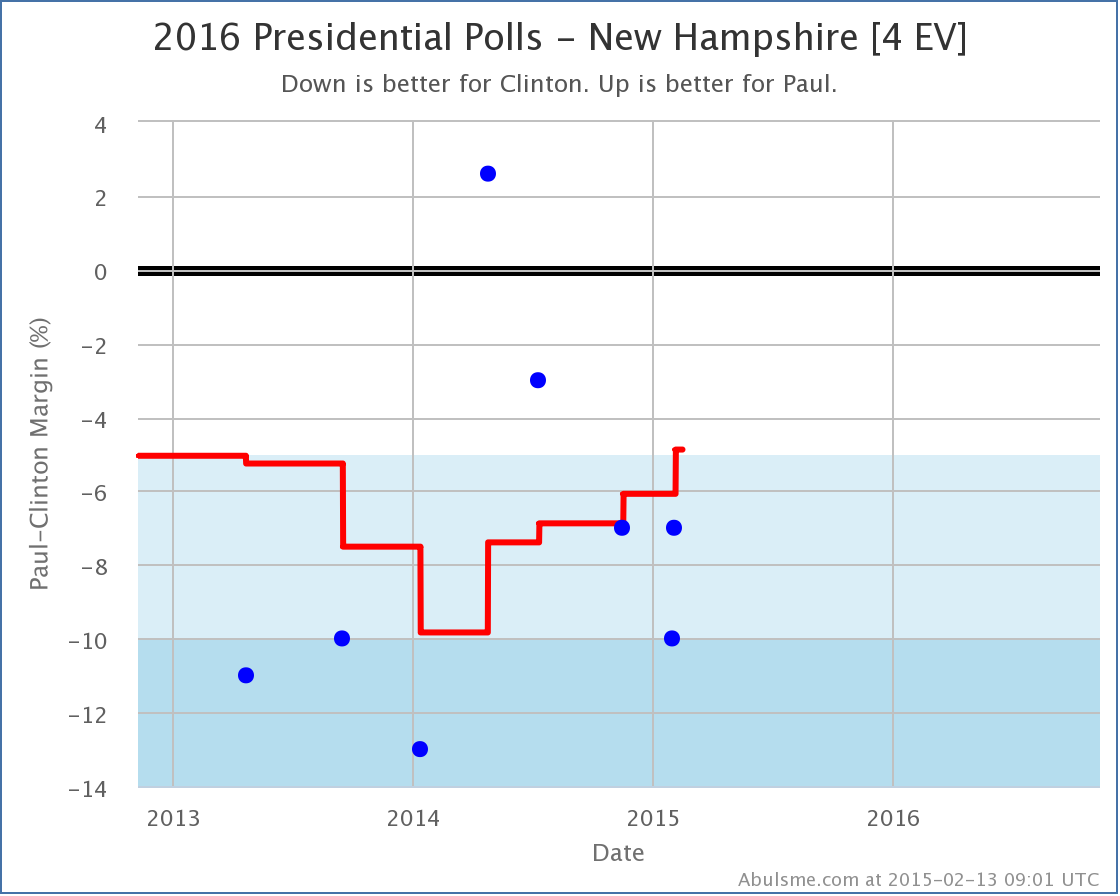
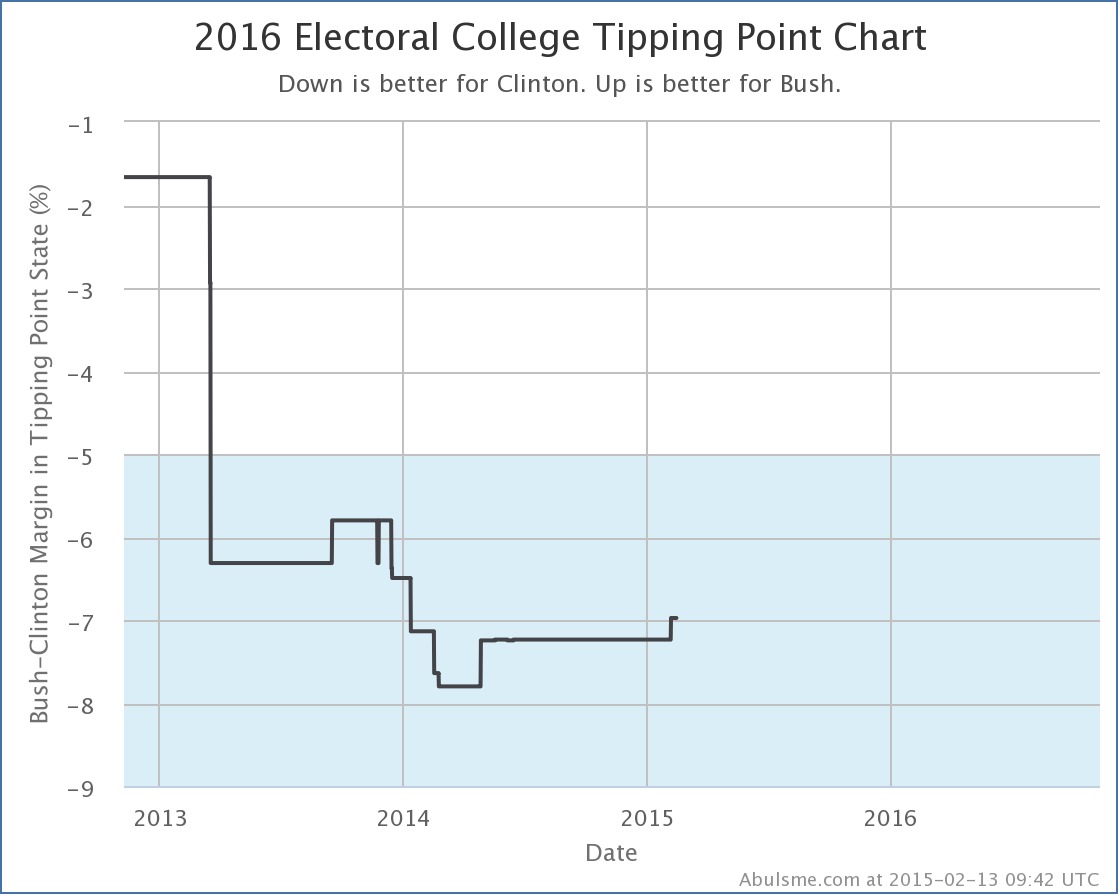
We are 634.6 days from the first polls closing as I write this message. But yet here I am with the fourth of these updates in a two week period. I honestly didn’t expect the polling to be picking up quite this fast. But it seems to be. So be it. Please keep in mind that everything here describes where things are now, and how things are trending NOW. We are far enough from the 2016 election that nothing here represents a prediction for what will happen in 2016. But knowing how things look now and observing the trends still provides interesting insight. Today I added new polls from CNU in Virgina and from Bloomberg / Saint Anselm / Purple in New Hampshire. These resulted in changes worth noting* for three candidate pairs. I’ll review them quickly in order of the magnitude of the change. Click on any of the charts to go to the election2016.abulsme.com site for more detail. Clinton vs Huckabee Huckabee had only been hanging on to the “Weak Clinton” category in Virginia by virtue of the fact that I pad my poll average with previous general election results if there are not yet five actual polls between the candidates in question. With the third poll directly pitting Clinton vs Huckabee in Virginia, Huckabee falls much further behind, and Virginia now seems to slip out of reach. Huckabee’s best case vs Clinton therefore gets worse. Without Virginia in the mix, Huckabee’s “best case” (where he wins all the states he is ahead in, plus all of the states where Clinton is ahead by less than 5%) is now to lose to Clinton by 76 electoral votes. This change also drops the “tipping point” (which represents how much of a uniform shift in polling across all states would be needed to flip the election) further in Clinton’s direction. The tipping point state for Clinton vs Huckabee is now Minnesota, where Clinton is ahead by 6.8%. Clinton vs Paul This chart of Clinton vs Paul polls in New Hampshire is interesting, and actually shows one of the disadvantages of using an average of the most recent polls, rather than some more sophisticated sort of trend smoothing. Paul’s average vs Clinton has been steadily improving for the last year. But if you look at the individual polls, you see that this is because some really bad polls for Paul from 2013 and early 2014 were “aging off” the average, being replaced by some relatively good polls for him from the last year, including one where he was actually ahead! But if you actually look at the trend of the individual polls since then, the trend has been back toward Clinton. With a straight up poll average, this trend in the last five polls is invisible. We just know that the average of the newest five is higher than that of the five most recent polls not counting the brand new one. Basically, a poll where Paul was behind by 13% was replaced by a poll where Paul was only behind by 7%, so the average moved toward Paul… even though there may be a different trend if you look within the five polls actually used in the average. If the trend in the last five polls is real (it may or may not be) then it would not be surprising to see New Hampshire fall back into “Strong Clinton” territory with the next poll. For now though, we grant Paul the possibility of winning New Hampshire in his “best case” which is now to lose to Clinton by only 88 electoral votes. Clinton vs Bush No changes in best, worst or expected case for Bush against Clinton, but since the tipping point in this case was Virginia, and we had polling in Virginia, it is not unsurprising that the tipping point here moved, if only a little. The tipping point here remains Virginia, but Bush moves from being behind 7.2% there, to only being behind by 7.0%. And that is it for today’s update. Please explore election2016.abulsme.com to find more detail and interesting bits and pieces. * For now, “Changes worth noting” are when the best, worst, or expected cases for one of the five best polled candidate pairs changes, when the tipping point changes by at least 0.1% for one of those candidate pairs, or if a new candidate pair becomes “best polled” or replaces one of the current five pairs on the list.
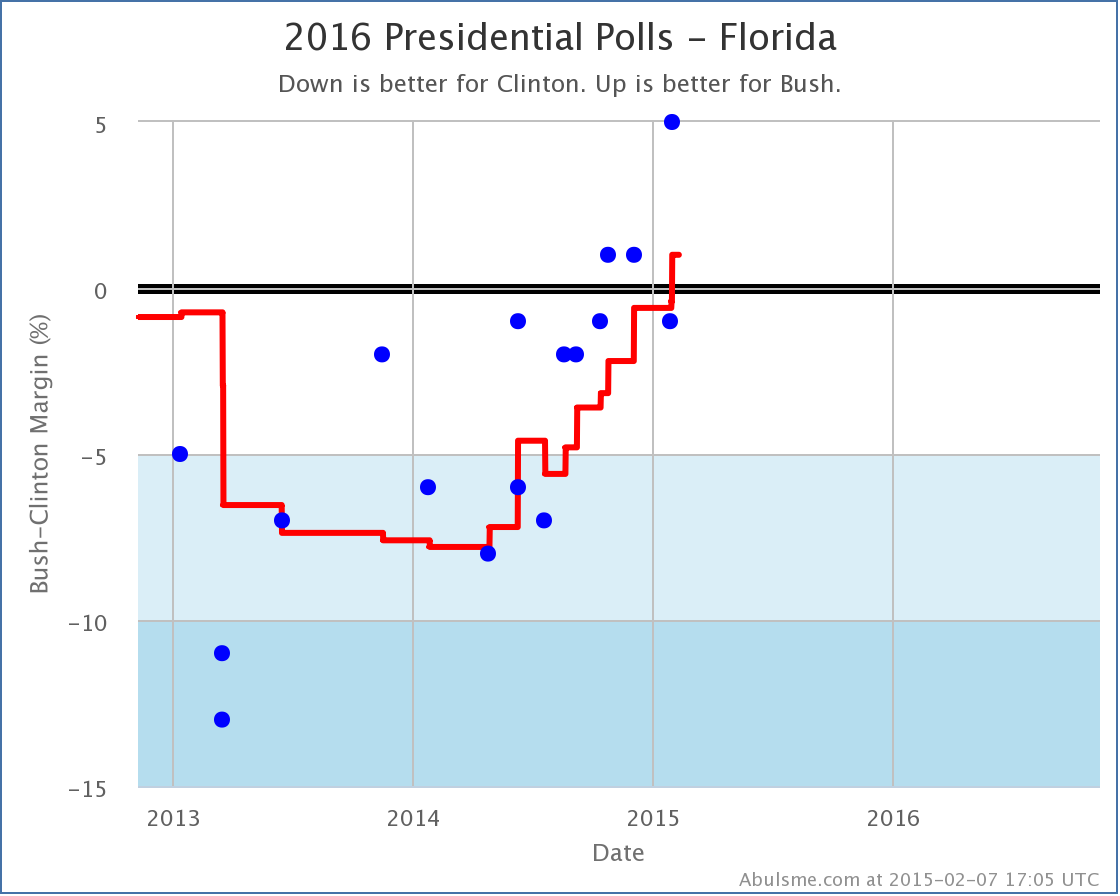
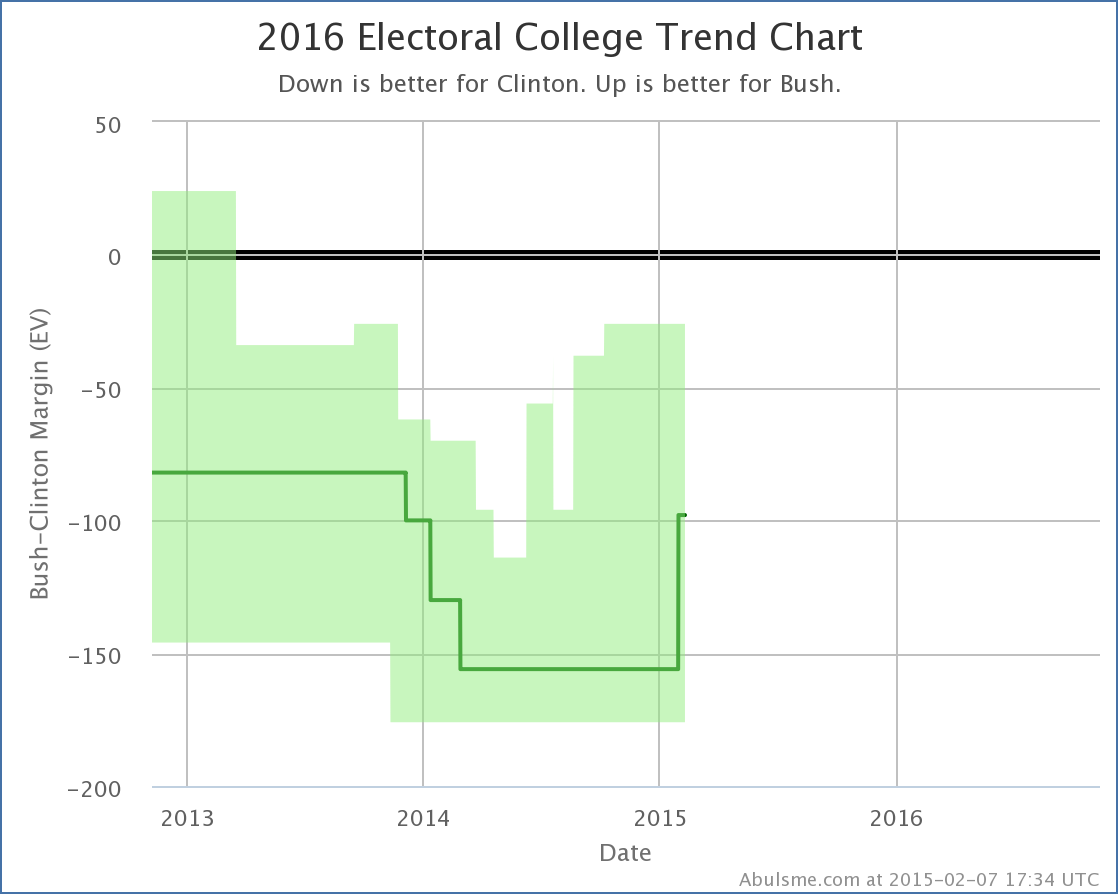
On Thursday I mentioned that if the current trend continued, new polls would push Bush into the lead in Florida and North Carolina before long. Well, only a couple days later, we have yet to see it in North Carolina, but we have that new poll in Florida. Florida is big (29 EV), so this of course makes a big difference on the national trend chart:
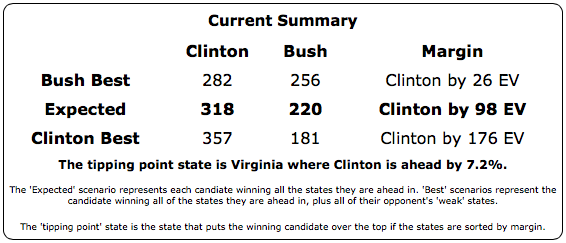
Will more states start flipping in Bush’s direction? Keep your eyes out over the next few months, the campaign is slowly getting into gear! In the meantime, Clinton vs Bush looks like this:
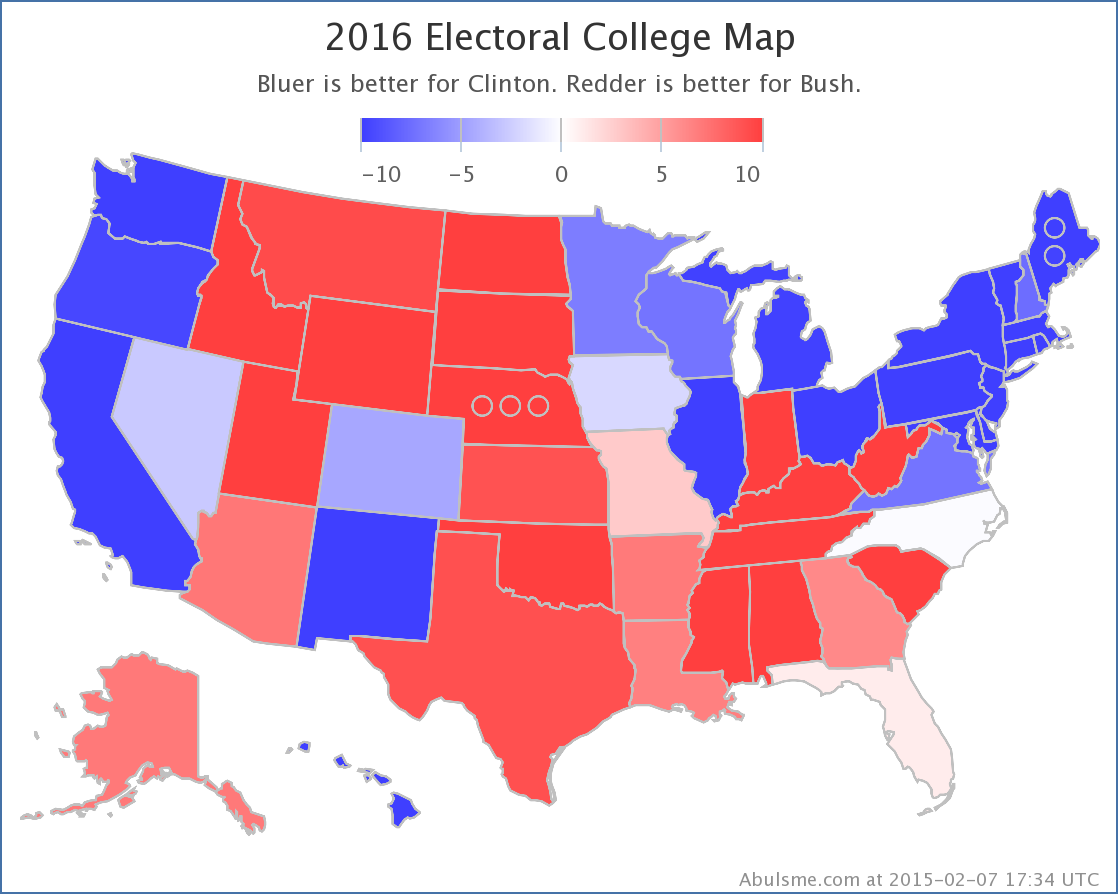
And we have just a tint of red down in Florida…
(Three electoral college posts from me in one week! Hopefully this isn’t the new normal quite yet…)
|
||
