- 17:30:36 Poll Added: PPP in FL from 2015-03-19 to 2015-03-22 – Clinton 47% to Bush 44% http://t.co/3IGlDffVjh
- 17:32:23 Poll Added: PPP in FL from 2015-03-19 to 2015-03-22 – Clinton 49% to Carson 41% http://t.co/xhbz8ozKsW
- 17:34:14 Poll Added: PPP in FL from 2015-03-19 to 2015-03-22 – Clinton 48% to Christie 41% http://t.co/U6cI4dIdfW
- 17:36:30 Poll Added: PPP in FL from 2015-03-19 to 2015-03-22 – Clinton 49% to Cruz 42% http://t.co/yuPXmZ9u7m
- 17:38:30 Poll Added: PPP in FL from 2015-03-19 to 2015-03-22 – Clinton 49% to Huckabee 44% http://t.co/ItC2RhsD9y
- 17:40:44 Poll Added: PPP in FL from 2015-03-19 to 2015-03-22 – Clinton 46% to Paul 42% http://t.co/LPuGbnDsGE
- 17:43:03 Poll Added: PPP in FL from 2015-03-19 to 2015-03-22 – Clinton 50% to Perry 42% http://t.co/6LG6vc1qSm
- 17:45:32 Poll Added: PPP in FL from 2015-03-19 to 2015-03-22 – Clinton 48% to Rubio 46% http://t.co/uIK6GB5G0r
- 17:47:53 Poll Added: PPP in FL from 2015-03-19 to 2015-03-22 – Clinton 49% to Walker 41% http://t.co/teKd3fmkPs
- 17:49:55 Poll Added: PPP in FL from 2015-03-19 to 2015-03-22 – Biden 43% to Walker 43% http://t.co/UGdHUI5nN0
- 17:50:07 Biden vs Walker state category change: FL has moved from Weak Biden to Weak Walker http://t.co/UGdHUI5nN0
- 17:51:40 Poll Added: PPP in FL from 2015-03-19 to 2015-03-22 – Warren 42% to Walker 41% http://t.co/0O3zTJ5Lo2
- 17:51:57 Warren vs Walker state category change: FL has moved from Weak Warren to Weak Walker http://t.co/0O3zTJ5Lo2
- 17:57:13 Poll Added: Quinnipiac in NY from 2015-03-11 to 2015-03-16 – Clinton 54% to Christie 34% http://t.co/TfAcgOAiaN
- 18:00:19 Poll Added: Quinnipiac in NY from 2015-03-11 to 2015-03-16 – Clinton 59% to Paul 31% http://t.co/qQX30u2ISY
- 18:02:35 Poll Added: Quinnipiac in NY from 2015-03-11 to 2015-03-16 – Clinton 58% to Huckabee 29% http://t.co/9AGBg466ne
- 18:04:12 Poll Added: Quinnipiac in NY from 2015-03-11 to 2015-03-16 – Clinton 58% to Bush 30% http://t.co/ElX1I2nV7L
- 18:08:43 Poll Added: Quinnipiac in NY from 2015-03-11 to 2015-03-16 – Clinton 58% to Rubio 31% http://t.co/ZBsN15Apwo
- 18:10:29 Poll Added: Quinnipiac in NY from 2015-03-11 to 2015-03-16 – Clinton 58% to Walker 31% http://t.co/d1EkTxfAQe
- 18:12:23 Poll Added: Quinnipiac in NY from 2015-03-11 to 2015-03-16 – Clinton 60% to Cruz 27% http://t.co/atdSmXH2tP
- 18:14:15 Poll Added: Quinnipiac in NY from 2015-03-11 to 2015-03-16 – Clinton 55% to Pataki 34% http://t.co/vRSteWB3my
- 18:24:12 Poll Added: Gravis in NH from 2015-03-18 to 2015-03-19 – Clinton 43% to Bush 40% http://t.co/ANpxWeAiQH
- 18:26:17 Poll Added: Gravis in NH from 2015-03-18 to 2015-03-19 – Clinton 46% to Walker 43% http://t.co/FsQn69Z0LD
- 18:28:14 Poll Added: Gravis in NH from 2015-03-18 to 2015-03-19 – Clinton 45% to Paul 42% http://t.co/wtiF9w9I66
- 18:28:22 Clinton vs Paul state category change: NH has moved from Weak Clinton to Strong Clinton http://t.co/wtiF9w9I66
- 18:31:31 Biden vs Walker expected case changed: Biden 310 to Walker 228 -> Biden 281 to Walker 257 http://t.co/sSYEMOGU7B
- 18:50:38 Paul best case vs Clinton has changed: Clinton 307 to Paul 231 -> Clinton 311 to Paul 227 http://t.co/uJpx4fLIZK
- 18:56:22 Warren vs Walker expected case changed: Warren 310 to Walker 228 -> Warren 281 to Walker 257 http://t.co/uJH3fRrEcD
- 23:22:07 [Blog Post] "Electoral College: New Hampshire swings away from Paul again" http://t.co/sJu5WJEpYV
|
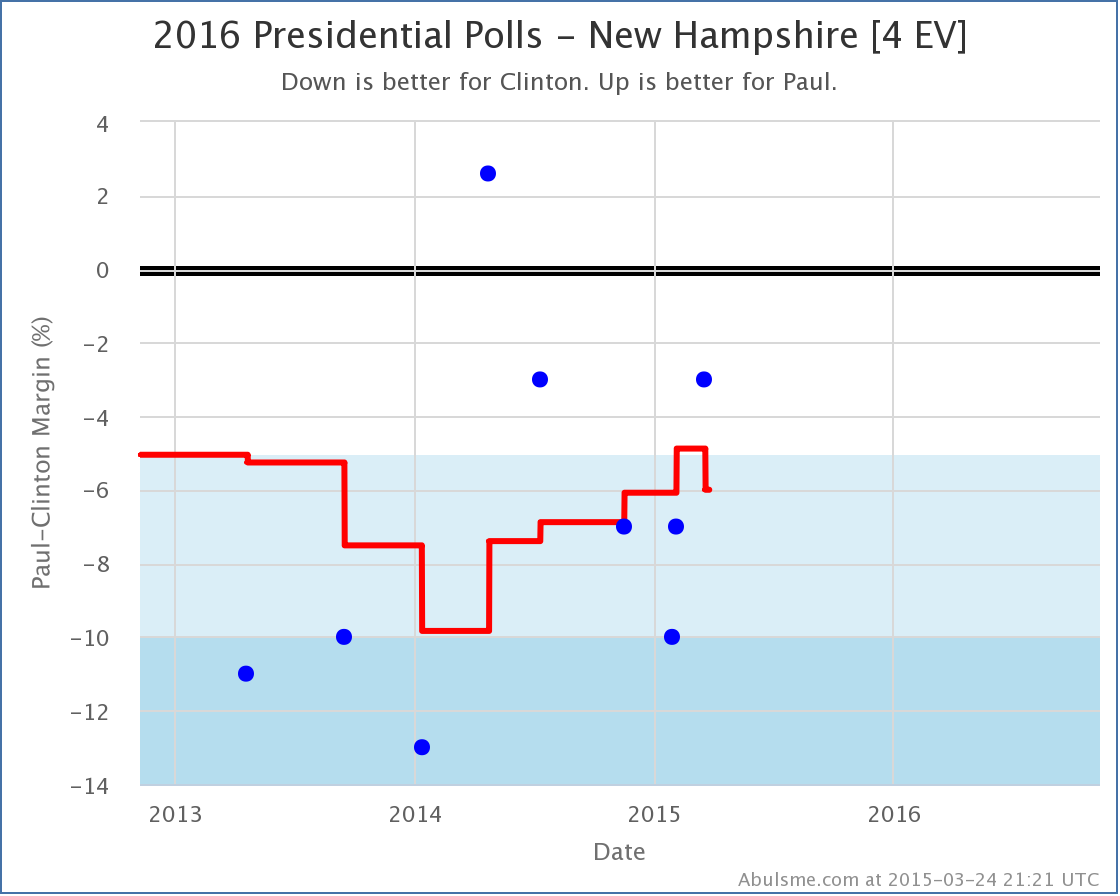
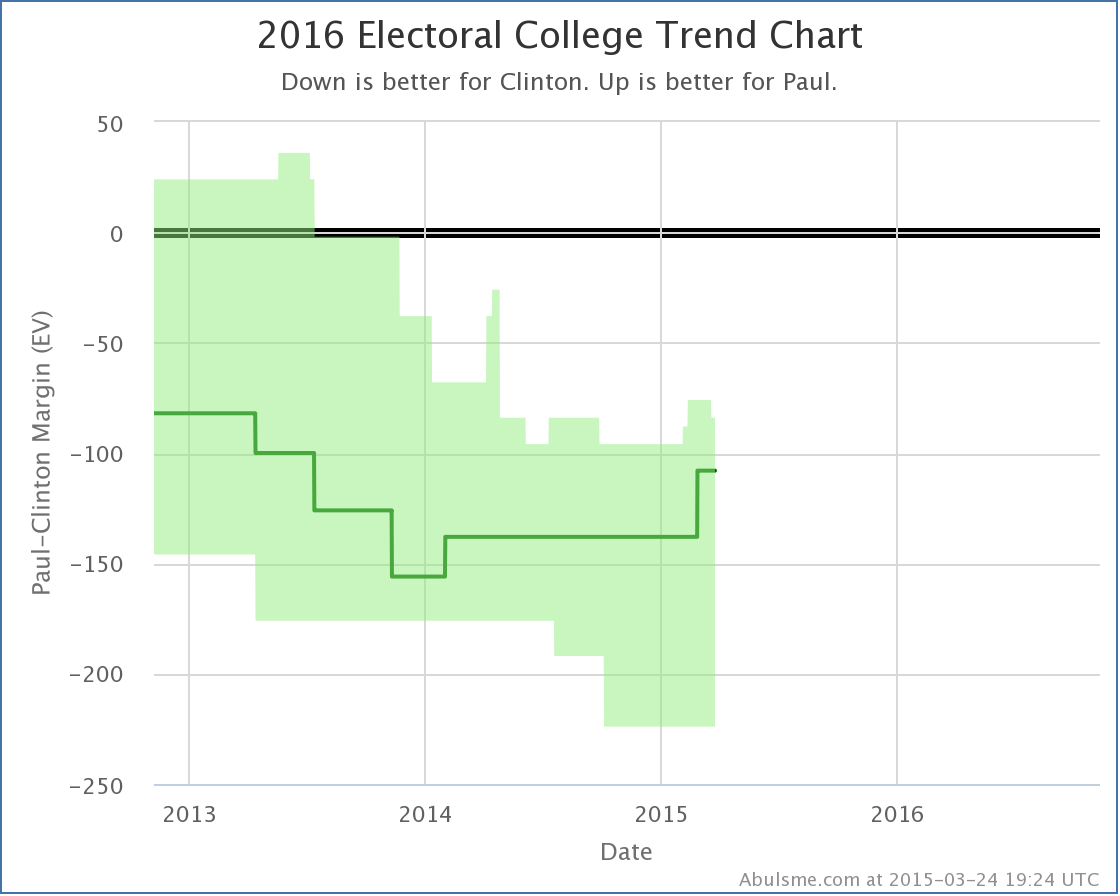
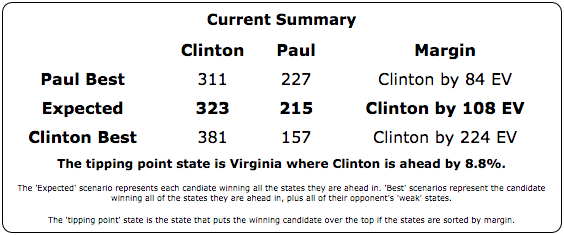
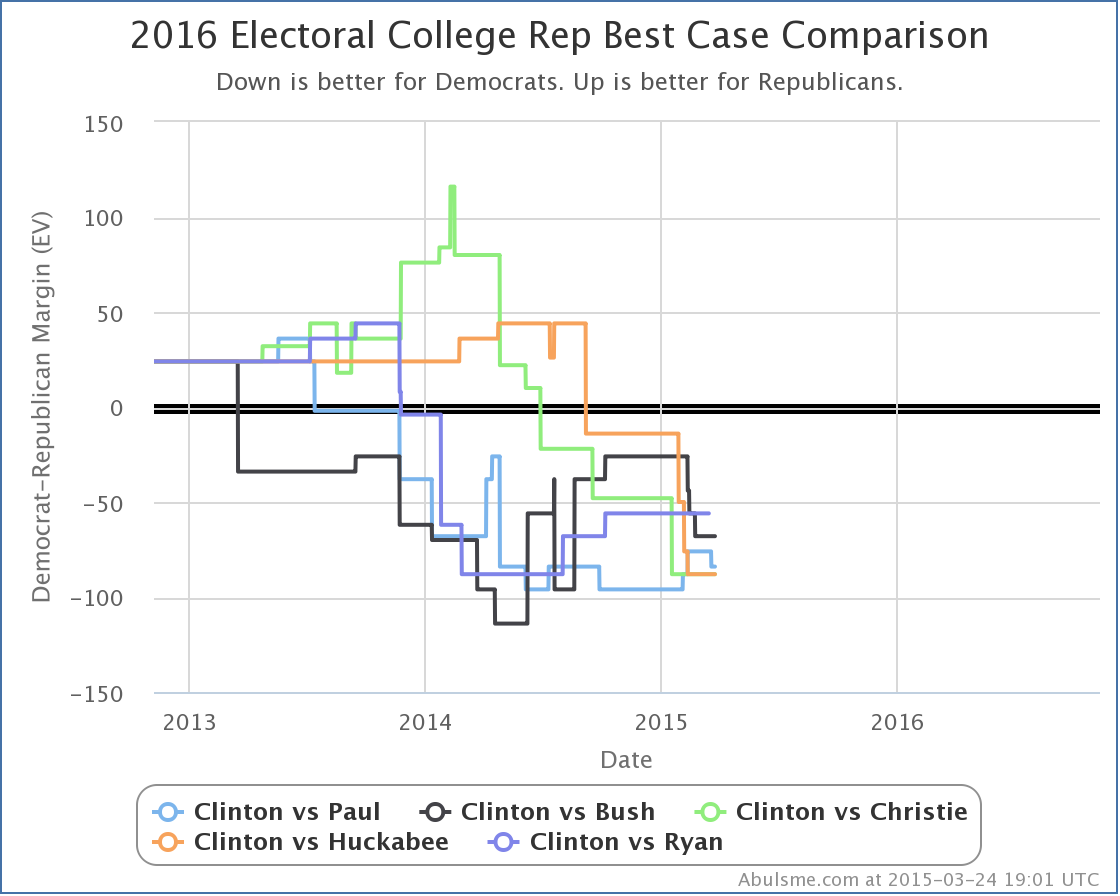
A bunch of new polls were added to my site today, but there was only one notable change. With a new Gravis Poll, Clinton’s lead in New Hampshire against Paul once again goes over 5%. Easy come, easy go I guess. This decline happens as the only poll so far showing Paul in the lead here falls off the average. That poll is looking more like an outlier at this point. Even without that one poll though, if you squint there does seem to be a general trend in Paul’s direction over the last year or so. As usual, we’ll have to wait for more polls to see if Paul resumes closing the gap in the average, or if this is actually a reversal of the trend. With New Hampshire now at a 6.0% Clinton lead in the average, it gets taken out of Paul’s “best case” scenario… Looking at Paul’s “best case” as compared to the rest of the “5 best polled” combinations tracked here: Since the November elections, Paul has improved his “best case” position from losing by 96 electoral votes, to losing by only 84 electoral votes. Bush, Christie and Huckabee meanwhile have actually all had their best cases get worse in this timeframe. (Ryan has held steady, but has said he isn’t running and hadn’t been polled much.) What about Cruz you say? Didn’t he just announce? And Walker? He’s still getting lots of buzz! Or maybe even Rubio? Well, the polling on those combinations still isn’t that great and don’t make my top five. But they are improving. Right now Clinton vs Cruz is the 6th best polled combo, Clinton vs Rubio is at #7, and Clinton vs Walker is at #8. You can click through on those links if you want to see what those look like at the moment. But the amount of state level polling on those guys still isn’t that great, so take what you see there with a big lump of salt. (And if you go even deeper and look at combos with non-Clinton Democrats, bring a whole wheelbarrow of salt.) Note: This post is an update based on the data on my 2016 Electoral College Analysis Site. All of the charts and graphs seen here are from that site. Graphs, charts and raw data can be found there for the race nationally and in each state for every candidate combination that has been polled at the state level. In addition, comparisons of the best polled candidate combinations both nationally and each in each state are available. All charts above are clickable to go to the current version of the detail page the chart is from, which may contain more up to date information than the snapshots on this page, which were current as of the time of this post.
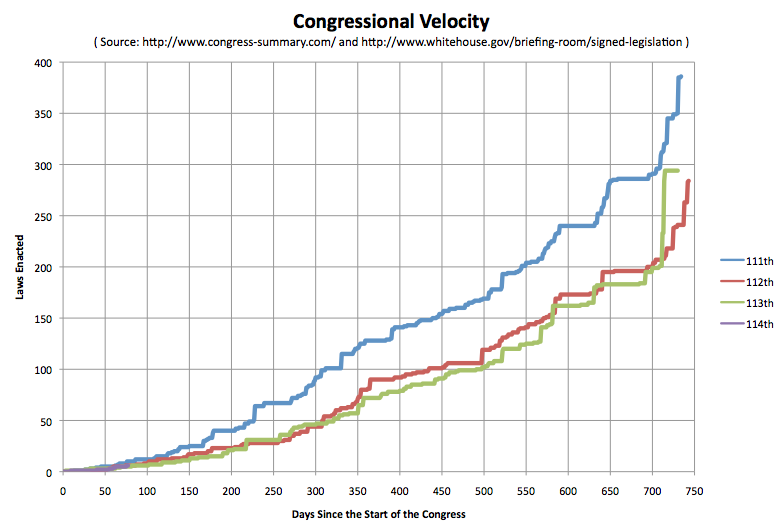
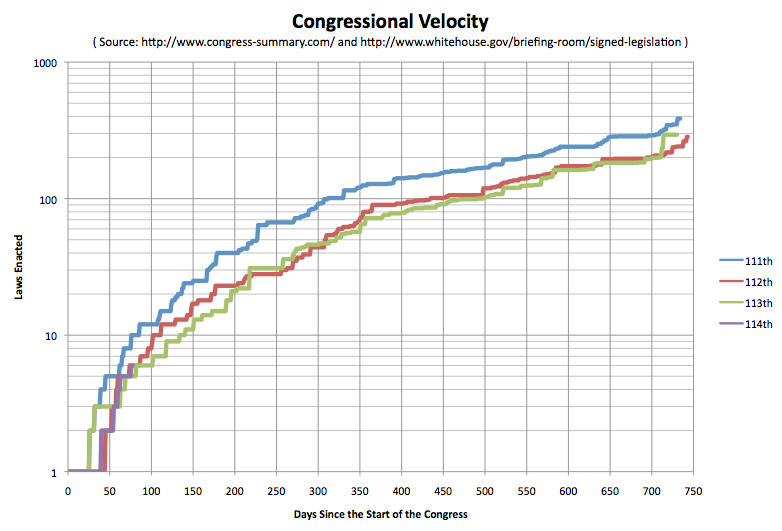
Standard Into: This is the latest in a series of quarterly posts on congressional legislative output. I started these in June 2013 in response to a flurry of commentary about how the 113th congress was lagging behind in output compared to previous congresses. Now, it is fundamentally debatable if passing fewer laws is a good thing, a bad thing, or just a completely meaningless number since of course the impact of laws varies widely. I’m guessing in reality, it is a pretty meaningless number. But I noticed that in many of these debates, there was a lack of rigor in the ways these numbers were used. For instance, it seemed common to compare the current number of laws passed in the 113th, to the TOTAL passed in the 112th or 111th. Or maybe talking about the “pace” at which legislation was being passed as if there was an expectation that this would continue linearly. Never did I hear a comparison that actually looked specifically at where the previous congresses had been at the same point in the cycle. So I made one. Now the new stuff: The 113th congress is over. No new laws were signed after my December update. So the 113th ended up with 294 bills signed compared to 239 in the 112th and 249 in the 11th. But now the 114th congress is in session. How is that going so far? As of March 20th, the 76th day of the new congress, 6 bills have been signed into law:
At the same time in the last few congresses, the 113th had 5 laws, the 112th had 6 laws, and the 11th had 10 laws. So for this time in the cycle, we’re pretty much right in line with the last two congresses, and just a tad behind the 111th. Here are the graphs:
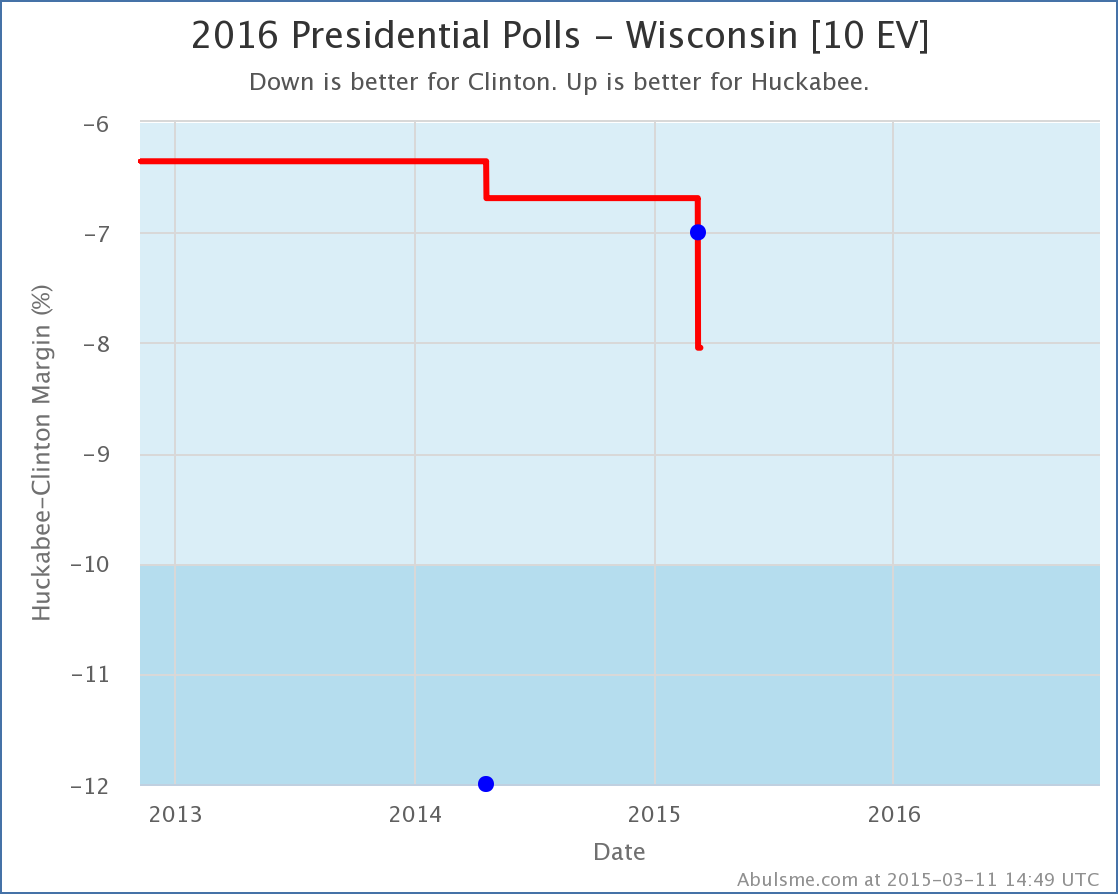
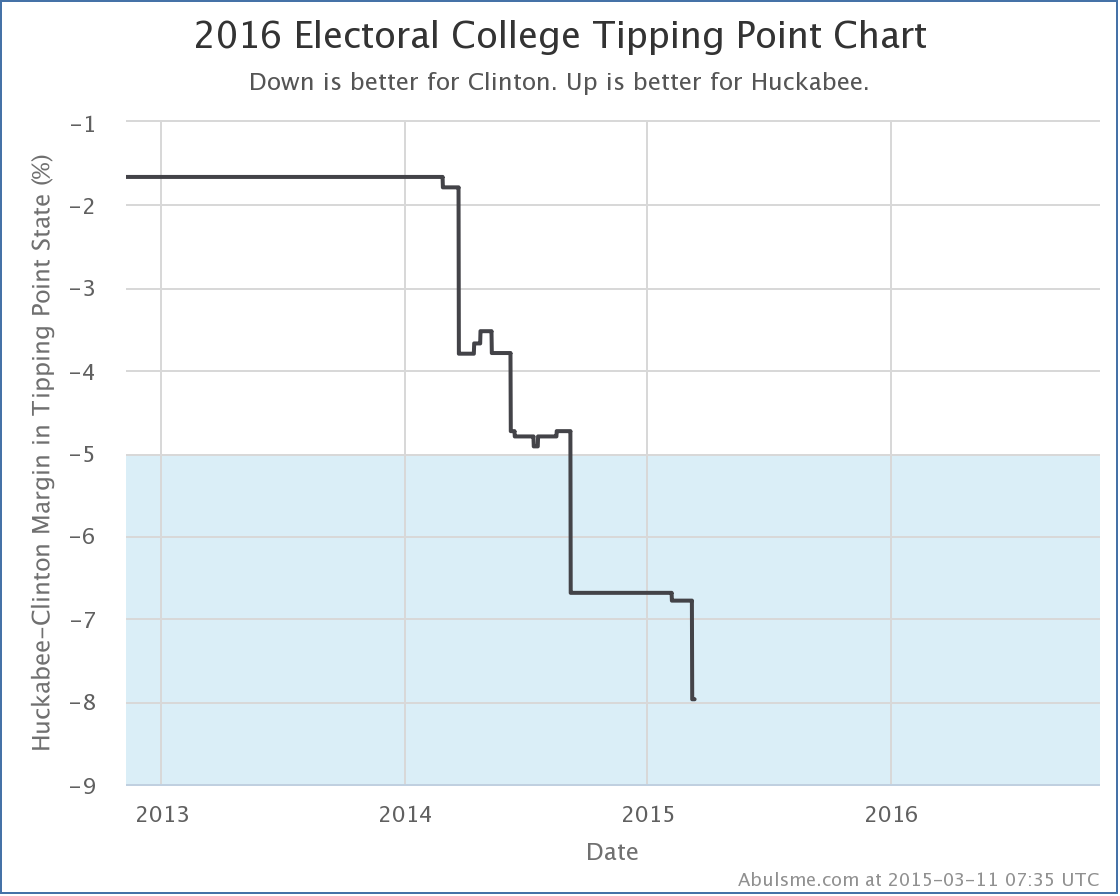
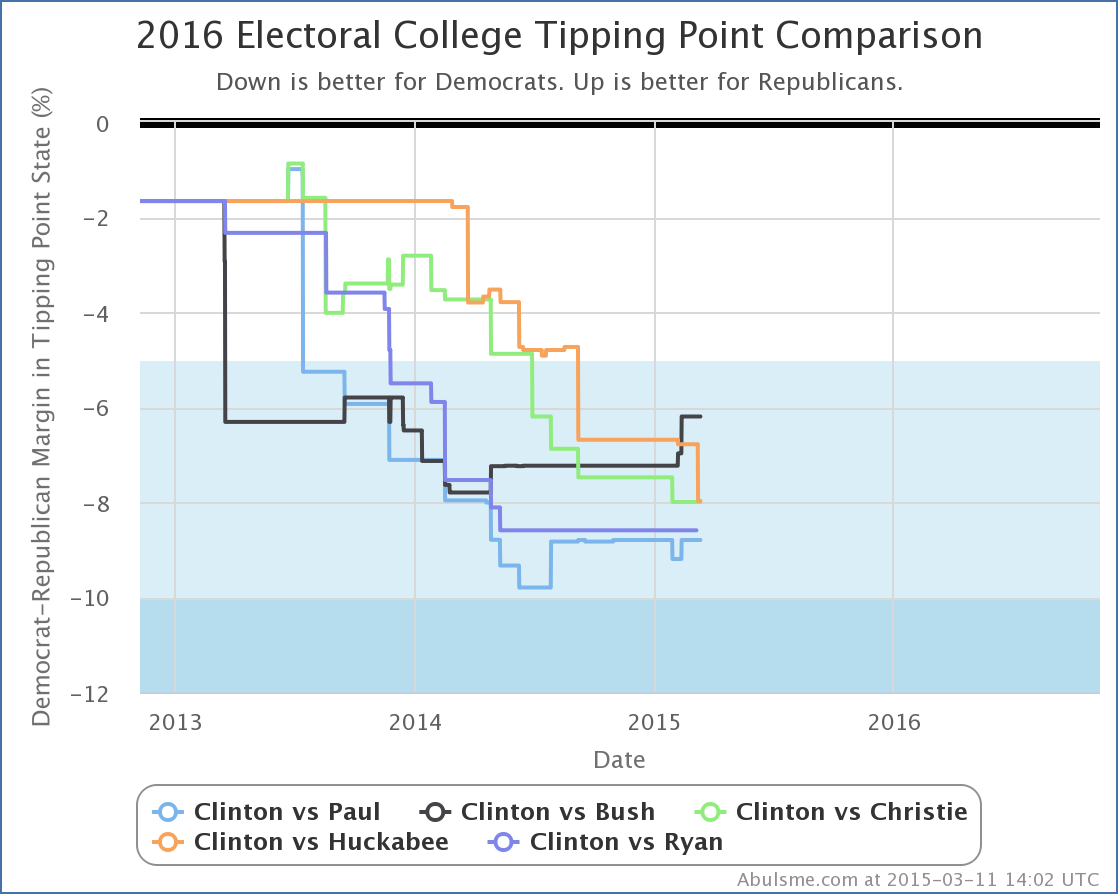
Today’s update was new PPP polling in Wisconsin. PPP polled 11 candidate combinations. Of these only one produced a notable change in one of the “5 best polled candidate pairs” I track most closely here. Specifically, this was the second poll of Clinton vs Huckabee in Wisconsin (the last was also by PPP, back in April 2014). This poll did not cause a category change in the average, it was Strong Clinton before, and it is Strong Clinton now: So with no category change, why am I bothering with a post? Well, Wisconsin slipping further into Clinton territory (from a 6.7% Clinton lead to a 8.0% Clinton lead) reshuffled the ordering of the states when sorted by margin and Wisconsin slipped past Minnesota (where Clinton leads by 6.8%). Minnesota had been the tipping point state. So Clinton doesn’t necessarily need Minnesota any more, because it is easier to get Wisconsin. This means the tipping point shifts to 8.0% in Virginia. The last time the tipping point moved even briefly in Huckabee’s direction was last August, but as you can see, the general trend has been that the more polling there is on this combination, the worse it looks for Huckabee. Since this is an otherwise short update, a quick look at how the tipping point looks across all five “best polled” candidate combinations at the moment: All of the Republicans are running way behind Clinton, but the trends are different. Basically, we can group the five candidates (all vs Clinton) into three categories based on the last six months or so of tipping point movement:
Ryan has said he is not running of course. There is also lots of talk about Walker, and sometimes of Cruz or Rubio, or even of combinations involving Democrats other than Clinton occasionally, but polling at the state level on all of those other combinations is still significantly more sparse than the five combinations here, and therefore the data less reliable, so we leave them out for now. Note: This post is an update based on the data on my 2016 Electoral College Analysis Site. All of the charts and graphs seen here are from that site. Graphs, charts and raw data can be found there for the race nationally and in each state for every candidate combination that has been polled at the state level. In addition, comparisons of the best polled candidate combinations both nationally and each in each state are available. All charts above are clickable to go to the current version of the detail page the chart is from, which may contain more up to date information than the snapshots on this page, which were current as of the time of this post. Edit 2015-03-16 17:44 UTC to add standard note to end.
|
||
