- 17:39:33 [Blog Post] "Curmudgeon’s Corner: Massive Corruption is Always Fun" http://t.co/yZaB24EMyR
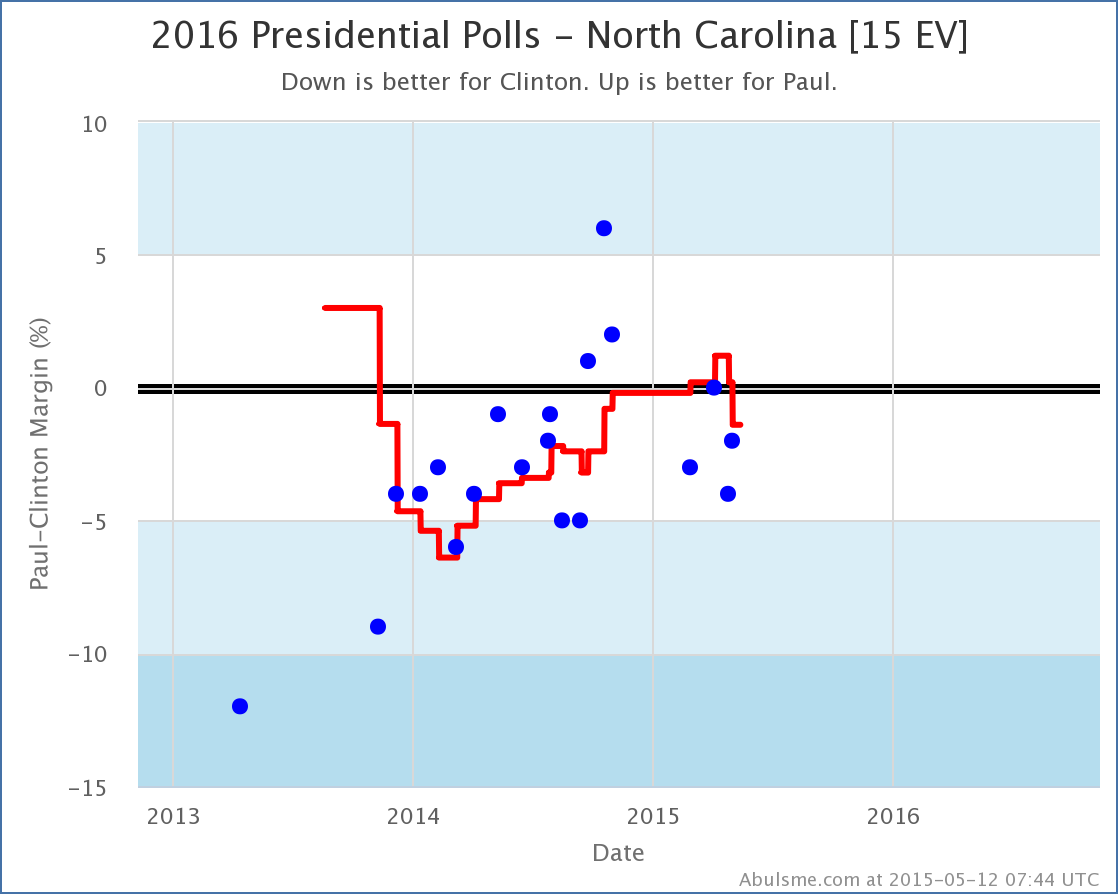
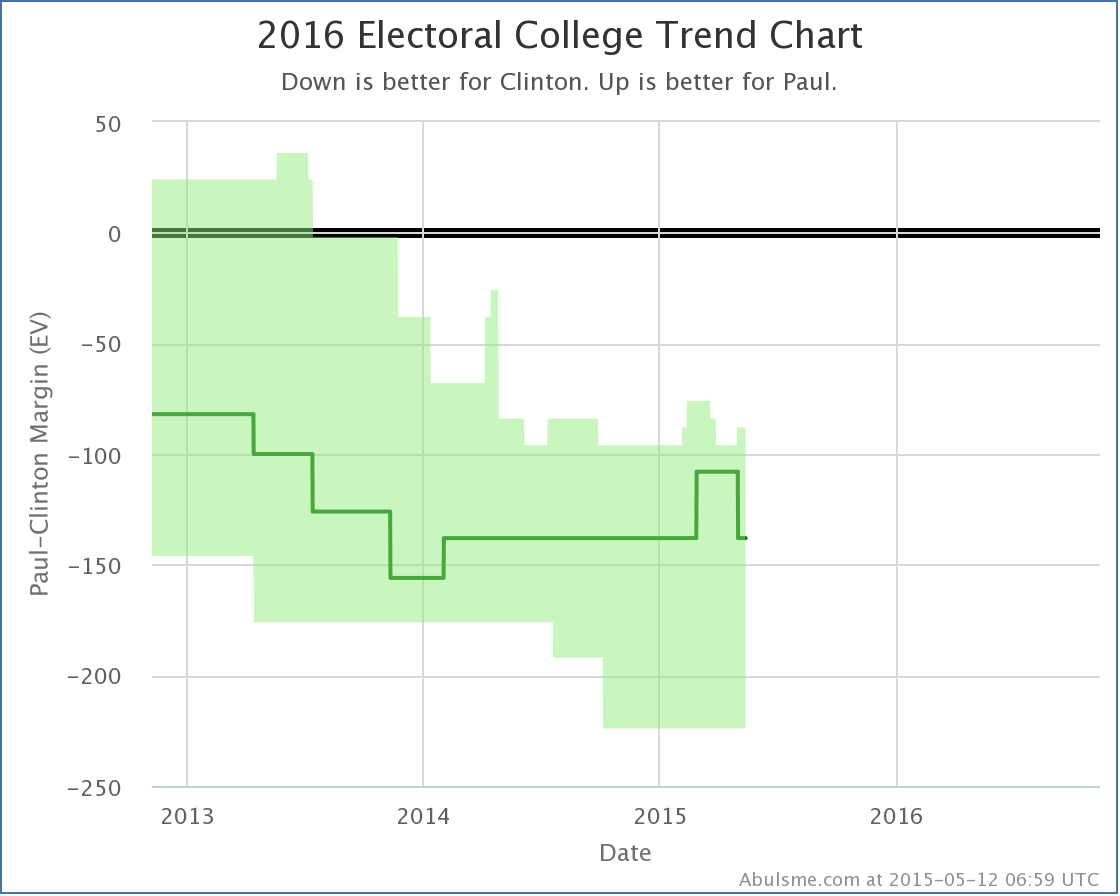
Today’s new poll from Gravis in North Carolina scrambles up the “five best polled candidate combinations” by the metric I use a bit, with Clinton vs Huckabee now the “best polled”, followed by Clinton vs Bush, Clinton vs Paul, Clinton vs Christie and Clinton vs Rubio. (This is basically because Clinton vs Huckabee is now very close in a state that has been very well polled.) That’s just bookkeeping though, there was one status change of note: Clinton vs Paul The newest poll in North Carolina bumps a poll from last October that had Paul ahead by 6% out of the poll average. With that poll gone, the average changes from Paul ahead by 0.2% to Clinton ahead by 1.4%. But the bottom line here is that all but one poll in the past year shows less than a 5% gap between Paul and Clinton. This is a close state. Yes, all but a few have shown Clinton ahead, so calling this “Weak Clinton” seems fair, even if you go beyond the last five polls. But it is close, and could flip back to Paul easily enough. For now though, North Carolina returns to the Clinton side of the fence, and so the “Expected Case” moves 30 electoral votes toward Clinton: With this Paul is back to losing to Clinton by 138 electoral votes, which is where he has been for most of the last year. Note: This post is an update based on the data on my 2016 Electoral College Analysis Site. All of the charts and graphs seen here are from that site. Graphs, charts and raw data can be found there for the race nationally and in each state for every candidate combination that has been polled at the state level. In addition, comparisons of the best polled candidate combinations both nationally and each in each state are available. All charts above are clickable to go to the current version of the detail page the chart is from, which may contain more up to date information than the snapshots on this page, which were current as of the time of this post. Edit 15:20 UTC to fix a typo.
|
||

