- 12:22:53 Poll Added: PPP in OH from 2015-06-04 to 2015-06-07 – Clinton 45% to Bush 43% http://t.co/CmwdinP593
- 12:28:58 Poll Added: PPP in OH from 2015-06-04 to 2015-06-07 – Clinton 44% to Carson 43% http://t.co/1j1n1tqpHb
- 12:33:00 Poll Added: PPP in OH from 2015-06-04 to 2015-06-07 – Clinton 44% to Christie 41% http://t.co/Rs8PzFN9nD
- 12:35:25 Poll Added: PPP in OH from 2015-06-04 to 2015-06-07 – Clinton 44% to Cruz 43% http://t.co/51N2SKvLGN
- 12:38:36 Clinton vs Carson tipping point change: Clinton by 1.7 in OH -> Clinton by 1.3 in FL http://t.co/UoG4J80WBi
- 12:39:29 Poll Added: PPP in OH from 2015-06-04 to 2015-06-07 – Clinton 45% to Huckabee 42% http://t.co/cmyZTNA8LN
- 12:42:57 Poll Added: PPP in OH from 2015-06-04 to 2015-06-07 – Clinton 40% to Kasich 47% http://t.co/te6RooPTUz
- 12:43:09 Clinton vs Kasich state category change: OH has moved from Strong Clinton to Weak Clinton http://t.co/te6RooPTUz
- 12:47:17 Poll Added: PPP in OH from 2015-06-04 to 2015-06-07 – Clinton 41% to Paul 44% http://t.co/sYqneClBAI
- 12:50:50 Poll Added: PPP in OH from 2015-06-04 to 2015-06-07 – Clinton 44% to Rubio 44% http://t.co/taxkiEDbkF
- 12:53:33 Poll Added: PPP in OH from 2015-06-04 to 2015-06-07 – Clinton 44% to Walker 43% http://t.co/K0z6pGuVco
- 12:53:47 Clinton vs Walker state category change: OH has moved from Weak Clinton to Strong Clinton http://t.co/K0z6pGuVco
- 12:57:19 Poll Added: PPP in OH from 2015-06-04 to 2015-06-07 – Bloomberg 32% to Walker 40% http://t.co/7nkwek9Vab
- 12:57:40 Bloomberg vs Walker state category change: OH has moved from Weak Bloomberg to Weak Walker http://t.co/7nkwek9Vab
- 13:01:18 Poll Added: PPP in OH from 2015-06-04 to 2015-06-07 – Chafee 24% to Walker 39% http://t.co/QUzhD6VOt8
- 13:01:57 Chafee vs Walker state category change: OH has moved from Weak Chafee to Weak Walker http://t.co/QUzhD6VOt8
- 13:07:05 Poll Added: PPP in OH from 2015-06-04 to 2015-06-07 – O'Malley 26% to Walker 41% http://t.co/FA6qHPxhc1
- 13:07:31 O'Malley vs Walker state category change: OH has moved from Weak O'Malley to Weak Walker http://t.co/FA6qHPxhc1
- 13:12:01 Poll Added: PPP in OH from 2015-06-04 to 2015-06-07 – Sanders 30% to Walker 40% http://t.co/VXnmNB91YM
- 13:12:28 Sanders vs Walker state category change: OH has moved from Weak Sanders to Weak Walker http://t.co/VXnmNB91YM
- 13:16:42 Poll Added: PPP in OH from 2015-06-04 to 2015-06-07 – Webb 25% to Walker 41% http://t.co/i675ObH5cQ
- 13:17:12 Webb vs Walker state category change: OH has moved from Weak Webb to Weak Walker http://t.co/i675ObH5cQ
- 13:39:09 Bloomberg vs Walker tipping point change: Bloomberg by 1.7 in OH -> Bloomberg by 0.9 in FL http://t.co/Rkjzc1SGNS
- 13:39:11 Bloomberg vs Walker expected case changed: Bloomberg 310 to Walker 228 -> Bloomberg 292 to Walker 246 http://t.co/TAWmraokqH
- 13:39:41 Chafee vs Walker tipping point change: Chafee by 1.7 in OH -> Chafee by 0.9 in FL http://t.co/hUDti4tSdt
- 13:39:43 Chafee vs Walker expected case changed: Chafee 310 to Walker 228 -> Chafee 292 to Walker 246 http://t.co/P6xWMqZ8KY
- 13:40:15 Clinton vs Kasich tipping point change: Clinton by 5.1 in IA -> Clinton by 2 in OH http://t.co/cEcQeUDJeu
- 13:40:17 Kasich best case vs Clinton has changed: Clinton 275 to Kasich 263 -> Clinton 257 to Kasich 281 http://t.co/cMssqTmmMB
- 13:40:57 O'Malley vs Walker tipping point change: O'Malley by 1.7 in OH -> O'Malley by 0.9 in FL http://t.co/NND544V9eV
- 13:40:58 O'Malley vs Walker expected case changed: O'Malley 310 to Walker 228 -> O'Malley 292 to Walker 246 http://t.co/mypn5Oh5mE
- 13:41:28 Sanders vs Walker tipping point change: Sanders by 1.7 in OH -> Sanders by 0.9 in FL http://t.co/77hX2363JZ
- 13:41:30 Sanders vs Walker expected case changed: Sanders 310 to Walker 228 -> Sanders 292 to Walker 246 http://t.co/ADjeYgccuQ
- 13:42:03 Webb vs Walker tipping point change: Webb by 1.7 in OH -> Webb by 0.9 in FL http://t.co/L8xnWNxUGZ
- 13:52:45 Web vs Walker expected case changed: Webb 310 to Walker 228 -> Webb 292 to Walker 246 http://t.co/2kF5gbzqyg
- 14:44:09 Clinton vs Cruz tipping point change: Clinton by 11.8 in OH -> Clinton by 11.4 in OH http://t.co/ZcJdpkzXIt
- 14:46:47 Clinton vs Huckabee tipping point change: Clinton by 8.1 in OH -> Clinton by 7.8 in OH http://t.co/rnZxqnc4wn
- 14:52:40 Clinton vs Paul tipping point change: Clinton by 7.6 in OH -> Clinton by 7 in MN http://t.co/SdIaeh1qcu
- 14:57:11 Walker best case vs Clinton has changed: Clinton 295 to Walker 243 -> Clinton 313 to Walker 225 http://t.co/YcAEgQ11FC
- 15:35:07 I changed around the colors on a variety of the charts on the site today. I think it is an improvement, but feedback welcome. Let me know.
- 18:28:49 [Blog Post] "Electoral College: Clinton weakens in Ohio" http://t.co/Saso5IMLLn
|
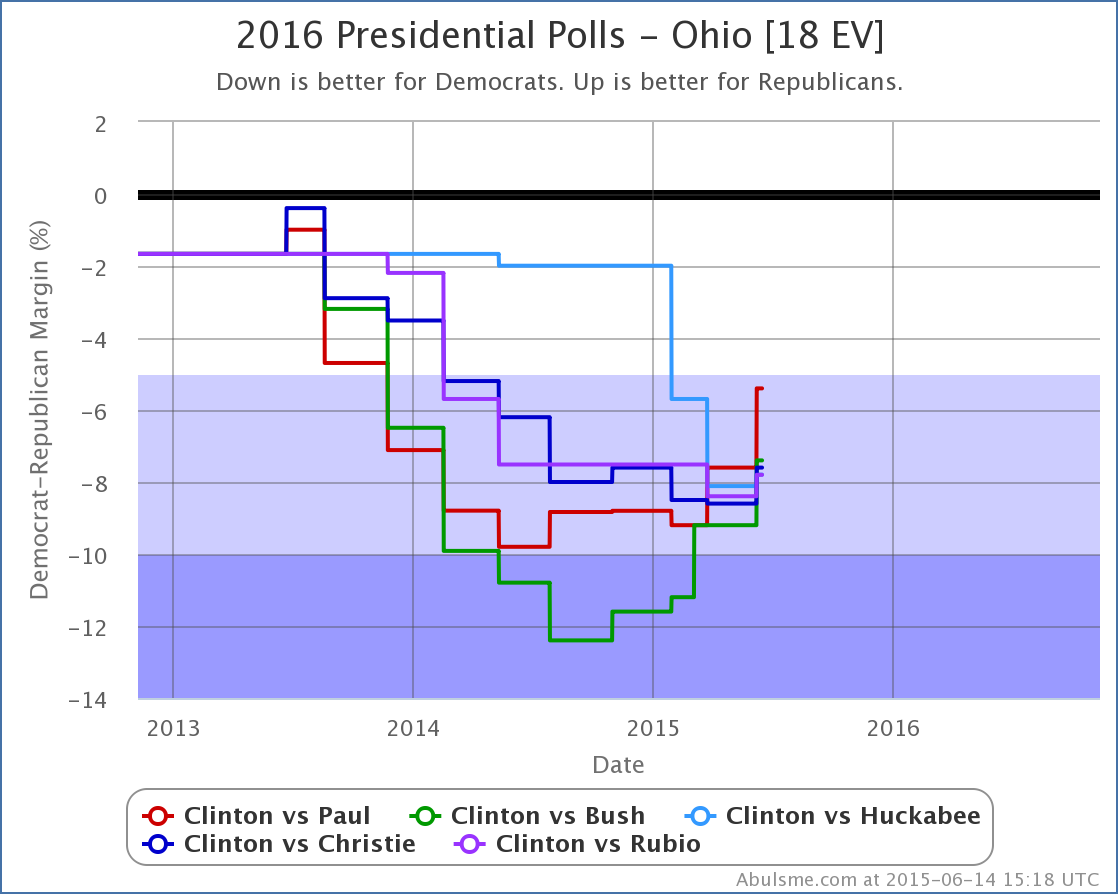
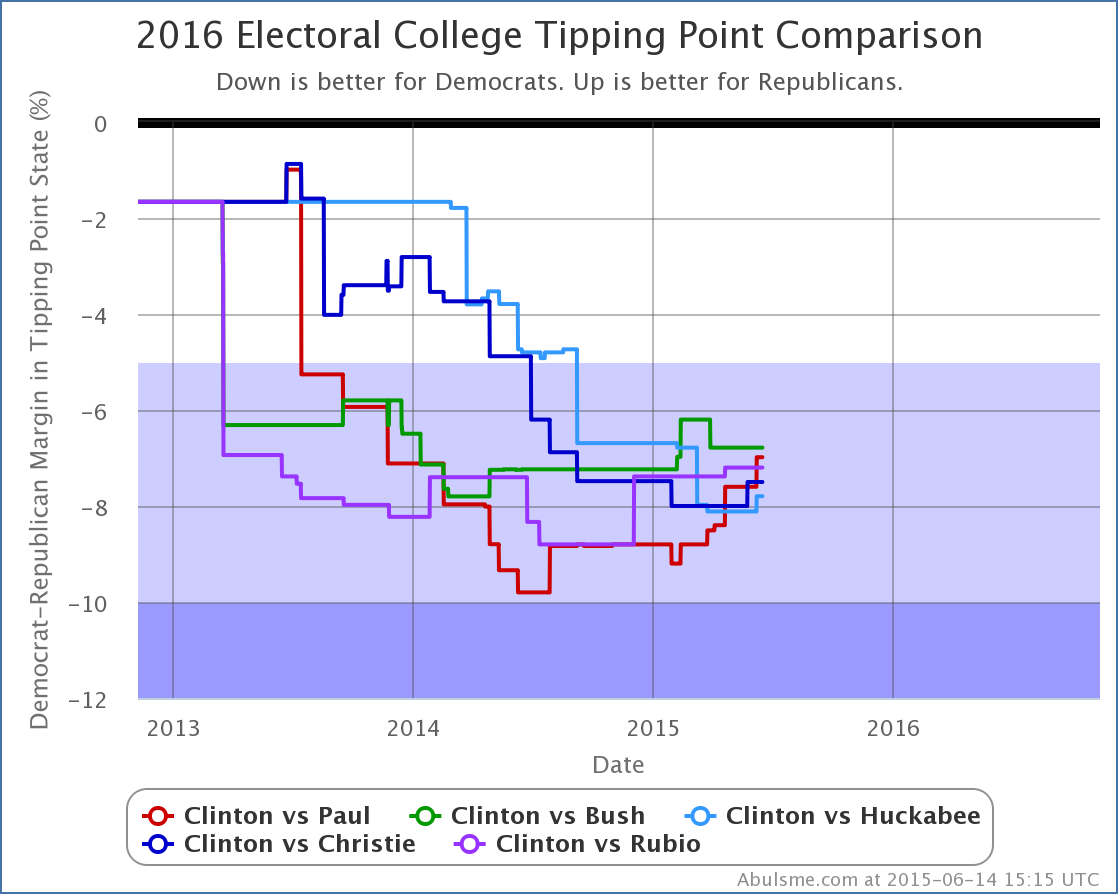
This last week brought a new set of Ohio results from PPP. With this poll Clinton lost significant ground against basically all opponents in the averages. Concentrating as we usually do on the five best polled candidate combinations, this is what we see: All five of these candidates improved against Clinton based on this latest poll. Looking back a little and comparing now with three months ago, we see that Paul, Bush and Christie have improved their positions, while Rubio and Huckabee have fallen further behind. Of these, Paul has moved the most, from down by 9.2% in March, to only down by 5.4% now, a gain of 3.8%. Paul now does the best of these five candidates against Clinton in Ohio. Ohio is not a good place for Clinton to be losing ground. Ohio’s 18 electoral votes can make a huge difference. Many paths for Republican victory require Ohio. And the losses here are quite possibly indicative of similar slippage in other states that haven’t been polled enough lately to see it yet. This is not a happy trend for Team Clinton. Lets switch to looking nationally. Do we see loss of ground there too? These changes in the Ohio average directly change the tipping point for two of the five candidates, Paul and Huckabee. Paul moves from being down by 7.6% with the tipping point in Ohio, to only being down 7.0% in Minnesota. Meanwhile Huckabee moves from being down 8.1% with the tipping point in Ohio, to being down 7.8%, with his tipping point still in Ohio. But lets look again at all five candidates against Clinton over not just this change, but the last few months: Once again lets compare now to three months ago. Remember, the tipping point essentially represents how much national public opinion needs to move to flip the electoral college result. Paul, Huckabee, Christie and Rubio have all improved since March. Only Bush has declined in that timeframe. (Bush is still better than he was six months ago though.) Also once again, Paul has improved the most against Clinton during that the last three months, going from down 8.8%, to only down 7.0%. And yes, yes, all five of these candidates are still way behind. But the overall movement seems to be in the Republican’s favor at the moment. If these trends continue, before too long we may have an actual race on our hands instead of a Clinton blowout! As I noted in the latest Curmudgeon’s Corner podcast, the real media bias is toward having an exciting race, and while I’m not “the media” I am not immune to this bias… a closer race is a more fun race to watch… so I’ll always be rooting for whoever is behind. :-) Seriously though, when I posted my first analysis of the 2016 race on this site in November, I mentioned that we should expect tightening, and that Clinton would most likely never again look as good as she did then. The general public had barely heard of most of the non-Clinton candidates, she had come off her Secretary of State stint with fairly high approval ratings, and the campaign against her had yet to start in earnest… and she had been keeping quiet, so fewer opportunities for her to make mistakes too. As things get in to gear, all of those things change. We’ve just seen the very beginnings of this, and already there is a visible impact in Clinton’s lead. Her lead is still a healthy one, but we’re definitely seeing the signs of the battle starting to be engaged. 513 days to go. Note: This post is an update based on the data on my 2016 Electoral College Analysis Site. All of the charts and graphs seen here are from that site. Graphs, charts and raw data can be found there for the race nationally and in each state for every candidate combination that has been polled at the state level. In addition, comparisons of the best polled candidate combinations both nationally and each in each state are available. All charts above are clickable to go to the current version of the detail page the chart is from, which may contain more up to date information than the snapshots on this page, which were current as of the time of this post.
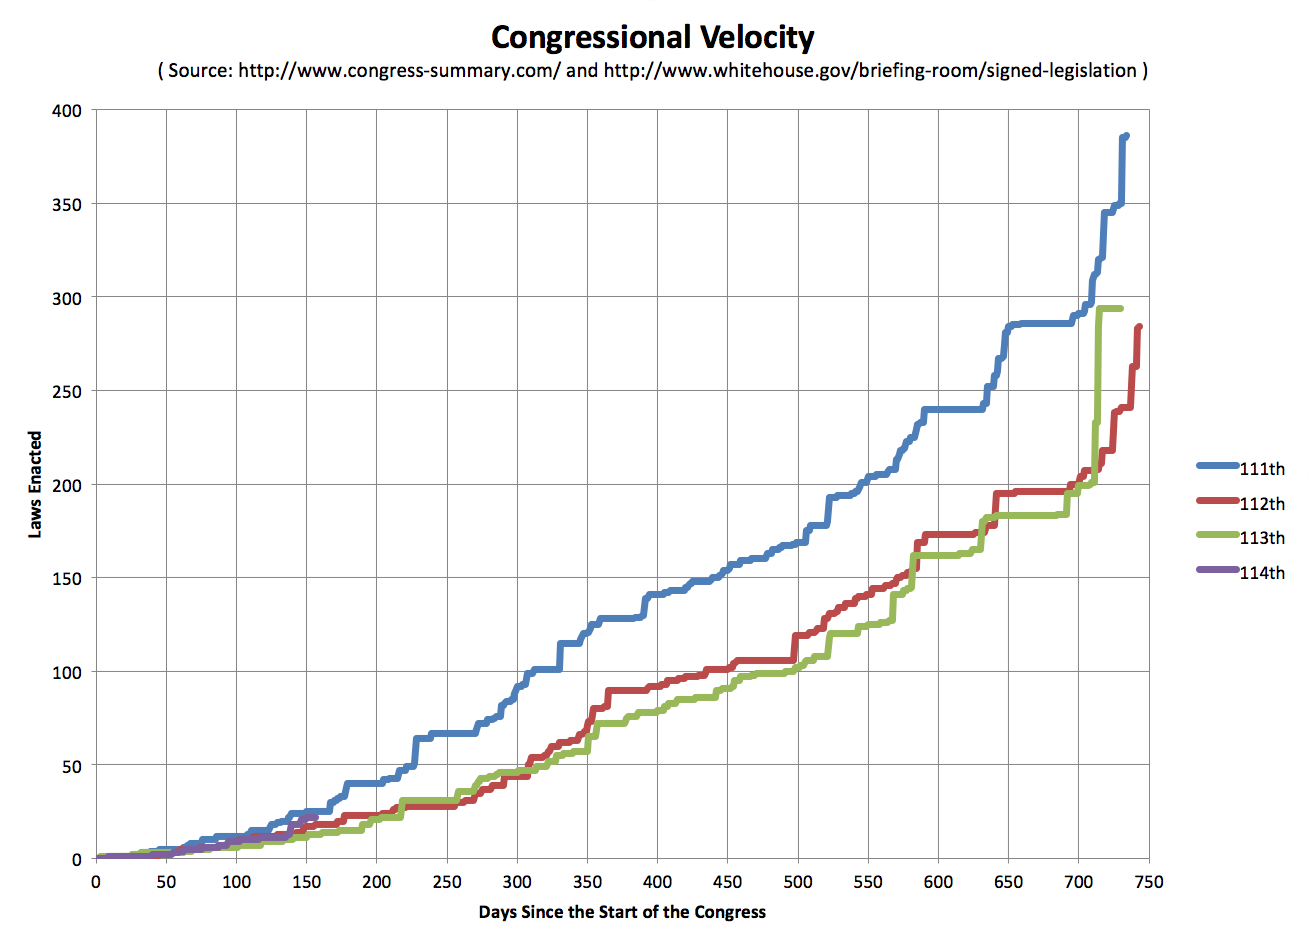
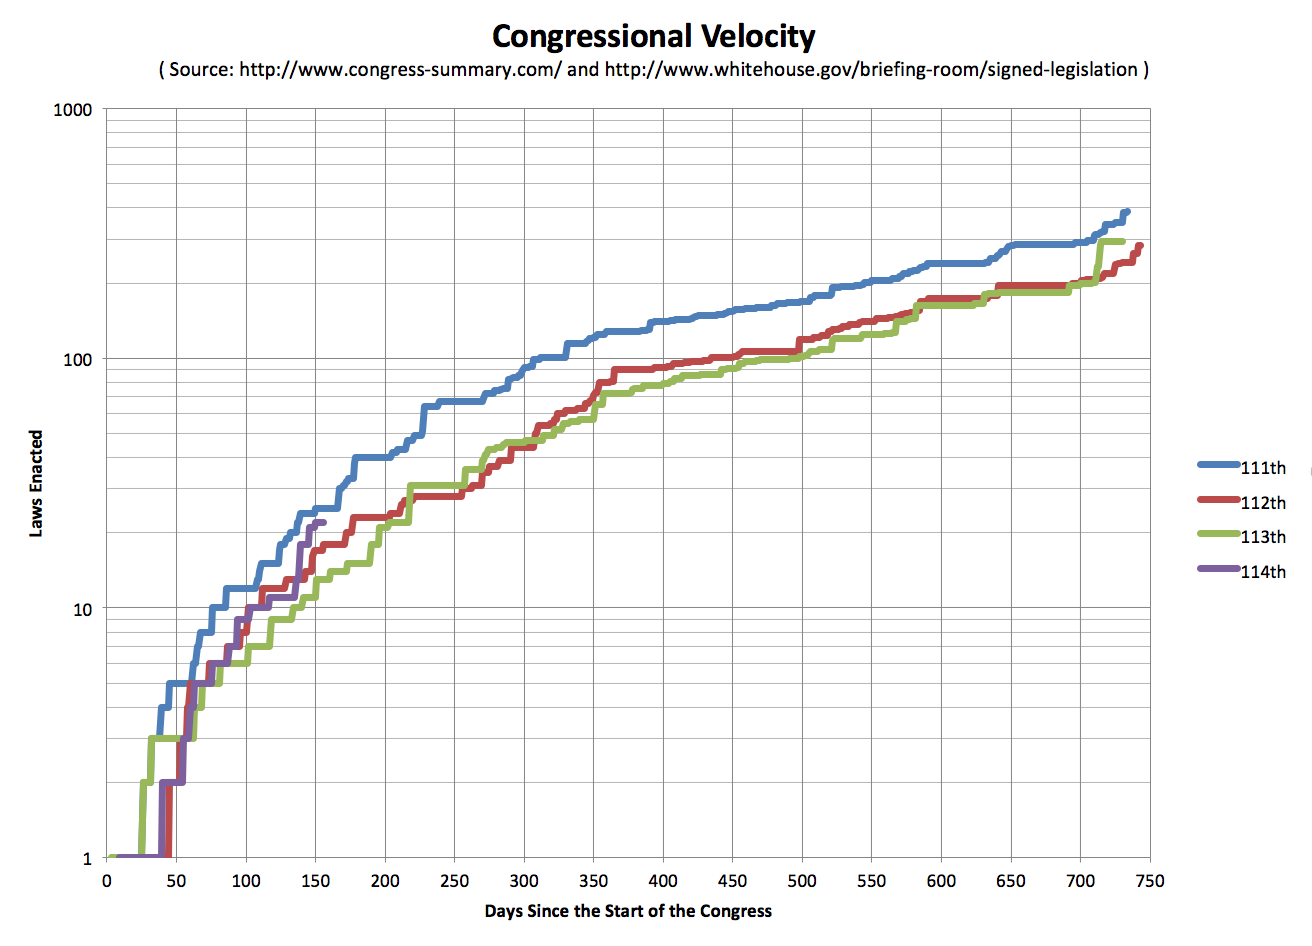
Standard Into: This is the latest in a series of quarterly posts on congressional legislative output. I started these in June 2013 in response to a flurry of commentary about how the 113th congress was lagging behind in output compared to previous congresses. Now, it is fundamentally debatable if passing fewer laws is a good thing, a bad thing, or just a completely meaningless number since of course the impact of laws varies widely. I’m guessing in reality, it is a pretty meaningless number. But I noticed that in many of these debates, there was a lack of rigor in the ways these numbers were used. For instance, it seemed common to compare the current number of laws passed in the 113th, to the TOTAL passed in the 112th or 111th. Or maybe talking about the “pace” at which legislation was being passed as if there was an expectation that this would continue linearly. Never did I hear a comparison that actually looked specifically at where the previous congresses had been at the same point in the cycle. So I made one. Now the new stuff: The 114th congress is now past their first 100 days. Past 150 in fact. So lets check in on how they are doing at the whole making laws thing. Bottom line, they have produced more signed laws than either the 112th or 113th congresses at this point in the cycle, and they are actually not that far behind the 111th. Here are the graphs:
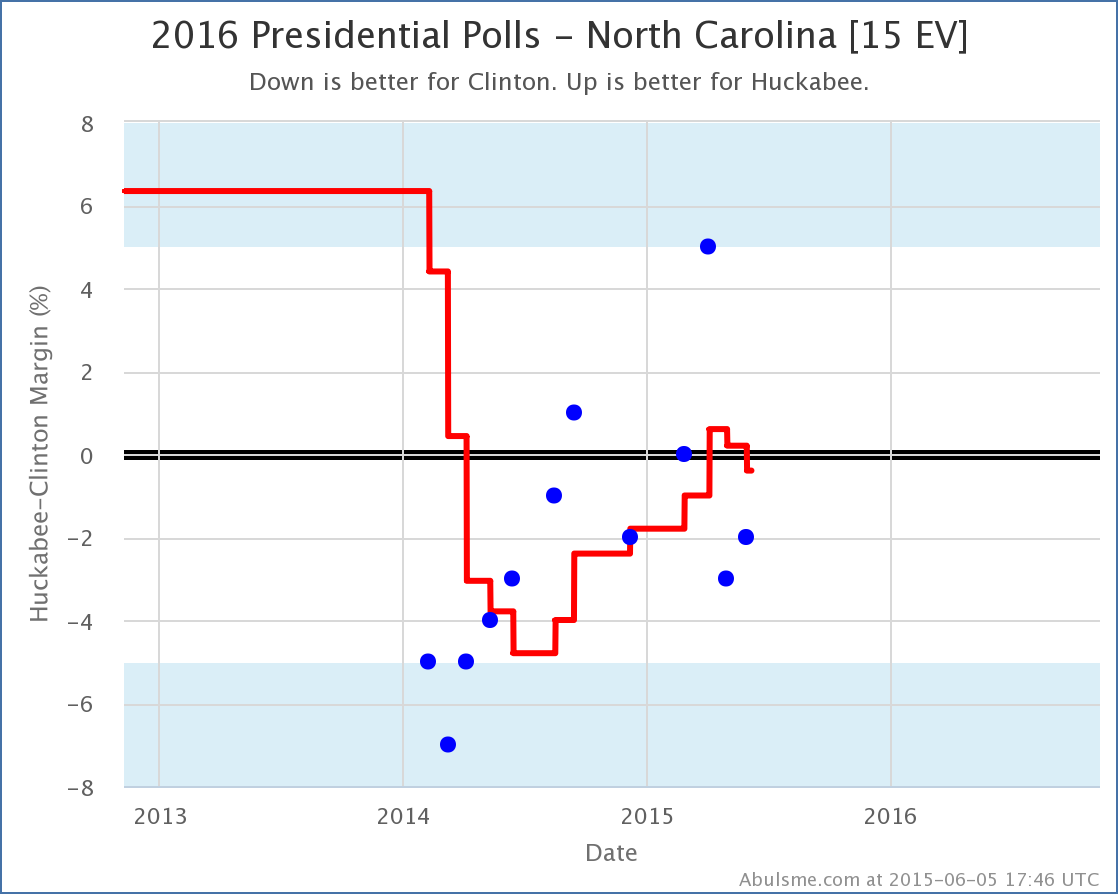
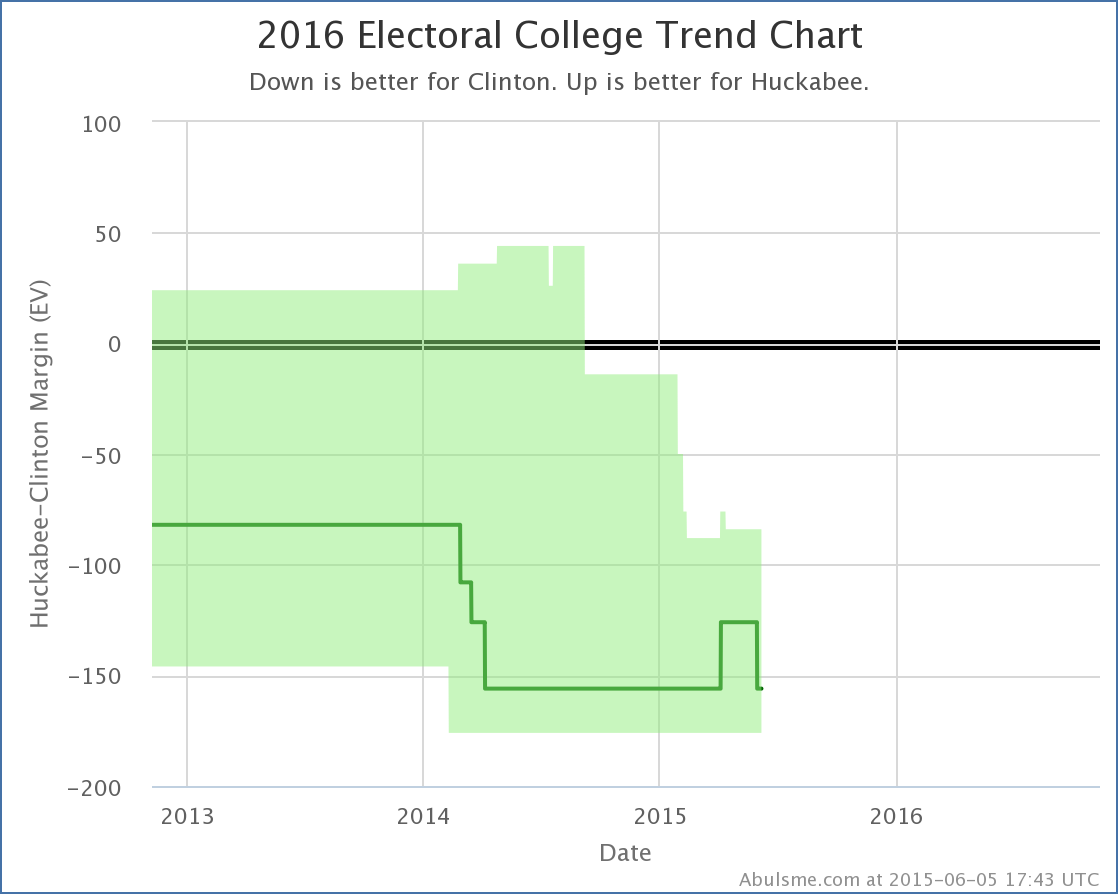
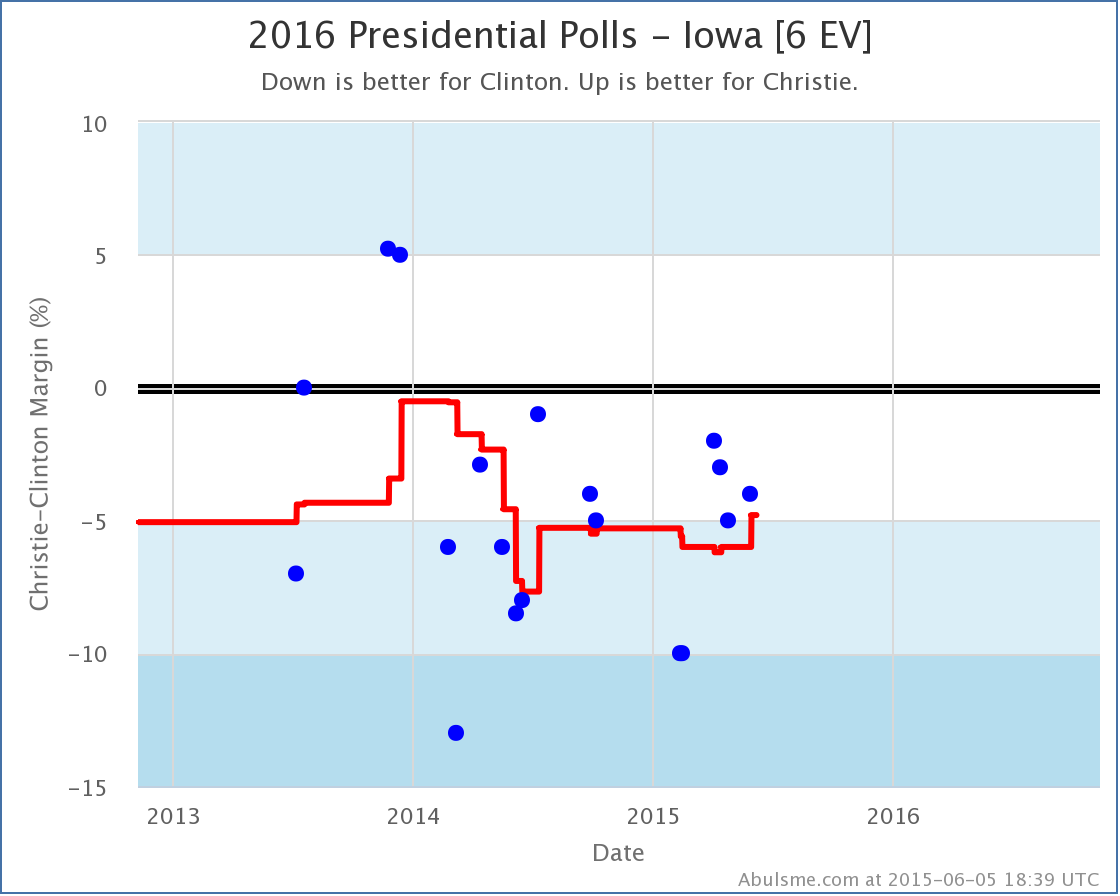
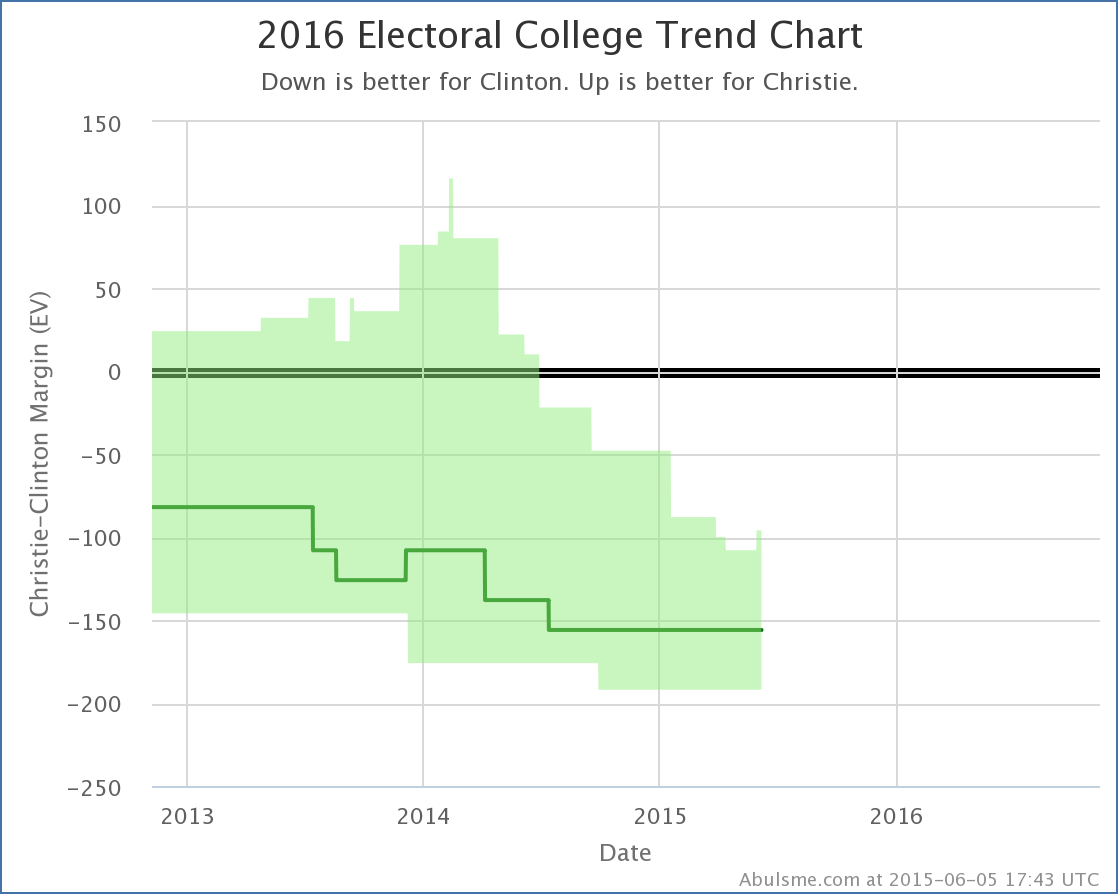
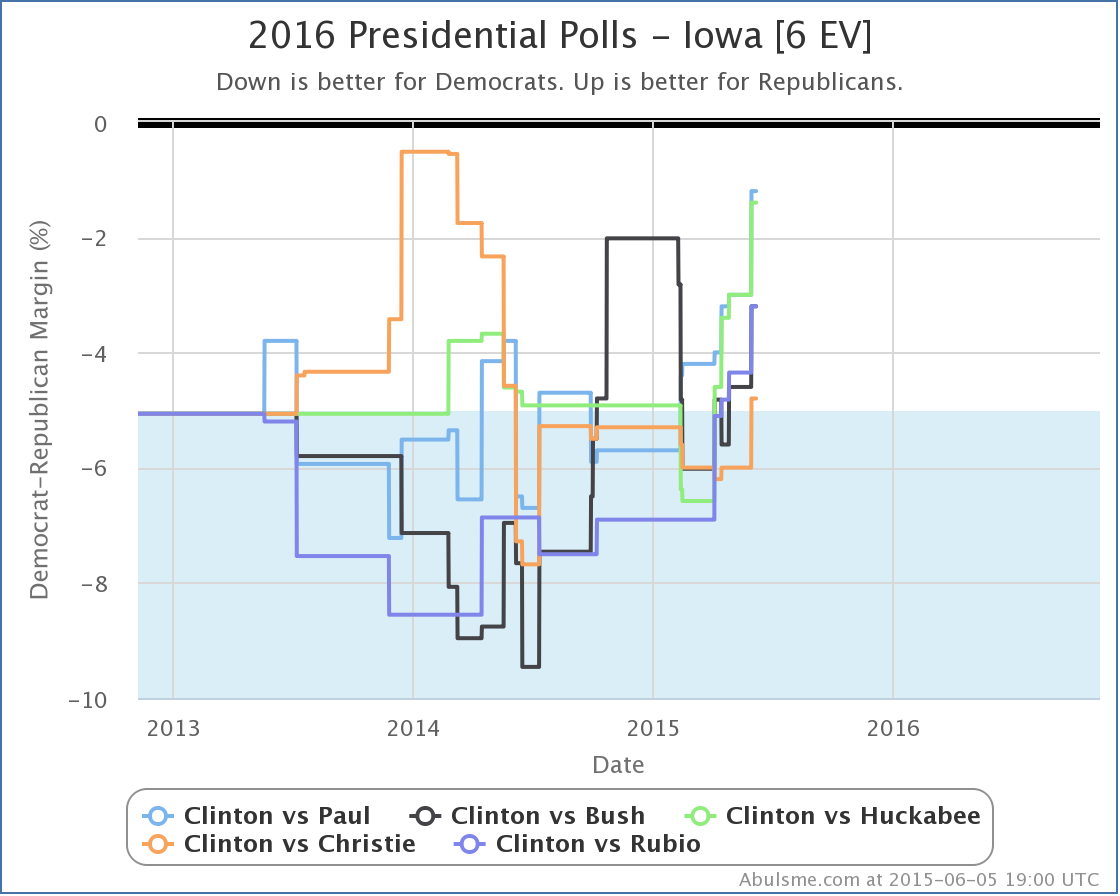
With today’s batch of polls added, Clinton vs Paul goes back to being the “best polled” candidate combination by my metric and thus is again the default view on election2016.abulsme.com. No status changes on Clinton vs Paul though. There were however two other status changes of note that I’ll highlight here. (There were status changes below the five best polled candidate combinations as well, see @ElecCollPolls for those, or for details of the specific polls added today.) Clinton vs Huckabee After a flirtation in April and May with actually leading Clinton in North Carolina, the state moves from just barely Huckabee, to just barely Clinton. Either way, North Carolina looks close in this matchup for the moment. This does however change the “expected” result in this match up in Clinton’s favor: With this, the expected result… where each candidate wins all the states where they are currently ahead… returns to Huckabee losing by 156 electoral votes. (Specifically Clinton 347, Huckabee 191.) This has been the “expected” Clinton vs Huckabee result for most of the last year. Clinton vs Christie With the latest poll, the poll average for Clinton vs Christie in Iowa show’s Clinton’s lead below 5% for the first time since almost exactly a year ago. A 4.8% lead is still nothing to sneeze at, but it is close enough that we now allow for the possibility of Christie winning Iowa in our range of reasonably possible outcomes, so Christie’s “best case” improves: That bump in the top right of the green envelope is the improvement we’re talking about here. Christie’s best case is still a 96 electoral college loss to Clinton. Along with his tipping point improvement that I noted on Saturday though, this makes two moves in Christie’s direction in a week, so maybe there is some new momentum in his direction? Nah, probably not, right? The Others There may or may not be a specific move toward Christie, but lets look at the comparison chart in Iowa for all five of the “best polled” candidate combinations… Hmm, definitely looks like some movement there in the last couple months. Clinton’s lead seems to be evaporating in Iowa vs all five of these Republican challengers. But isn’t she spending all sorts of time in Iowa right now? Of course, Iowa gets attention due to the caucus of course, not an much for the general election, but still. This isn’t a good trend for Clinton. There is no clear move like this on any of my national trend lines yet, but those take some time to move given that you need polling from a lot of states. But Iowa is one of the most polled states, so this could be a warning sign for Clinton’s broader situation. 522 days until the polls start closing. Plenty of time for drama and movement. Stay tuned! Note: This post is an update based on the data on my 2016 Electoral College Analysis Site. All of the charts and graphs seen here are from that site. Graphs, charts and raw data can be found there for the race nationally and in each state for every candidate combination that has been polled at the state level. In addition, comparisons of the best polled candidate combinations both nationally and each in each state are available. All charts above are clickable to go to the current version of the detail page the chart is from, which may contain more up to date information than the snapshots on this page, which were current as of the time of this post.
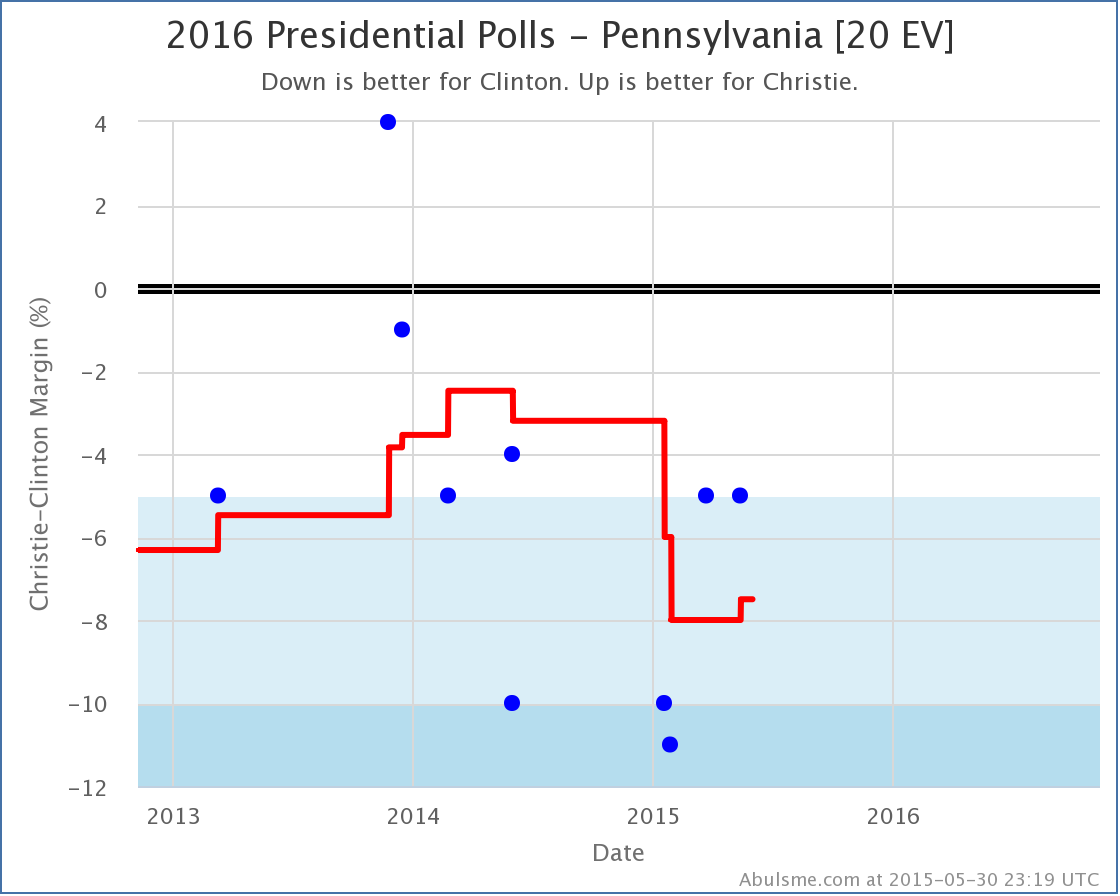
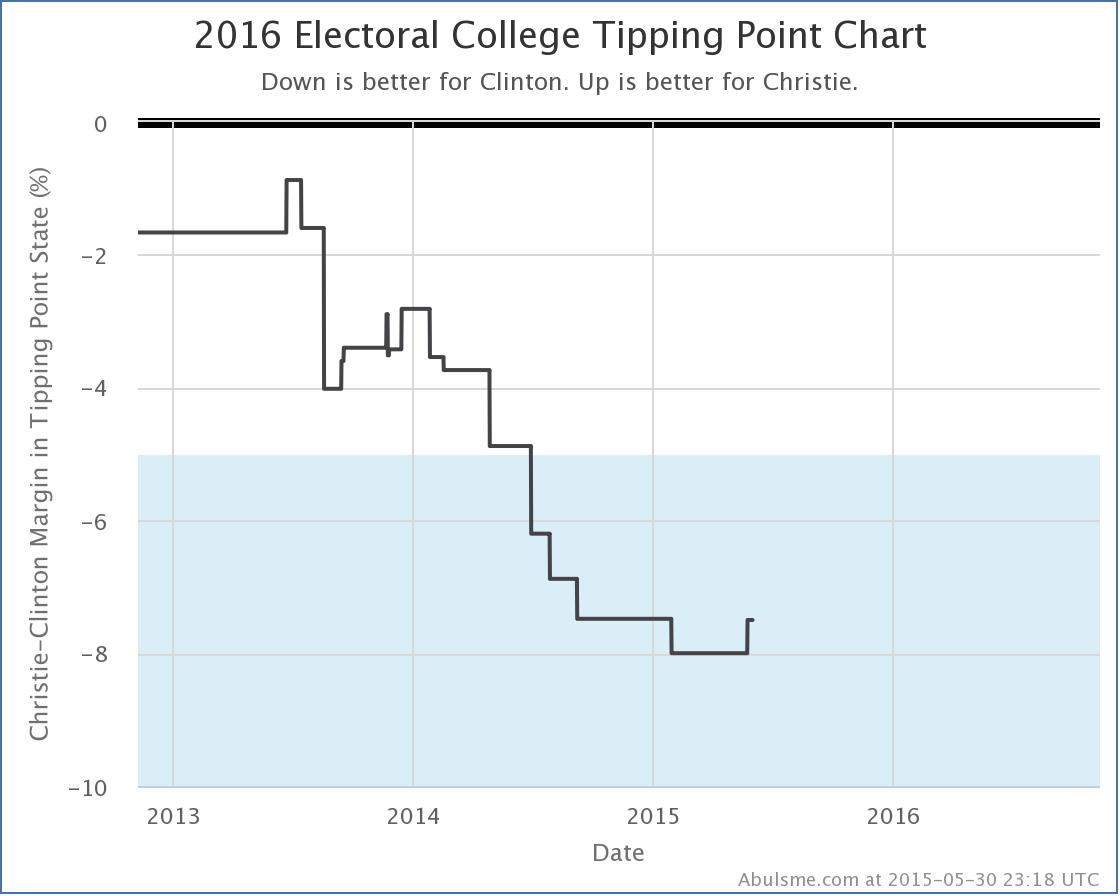
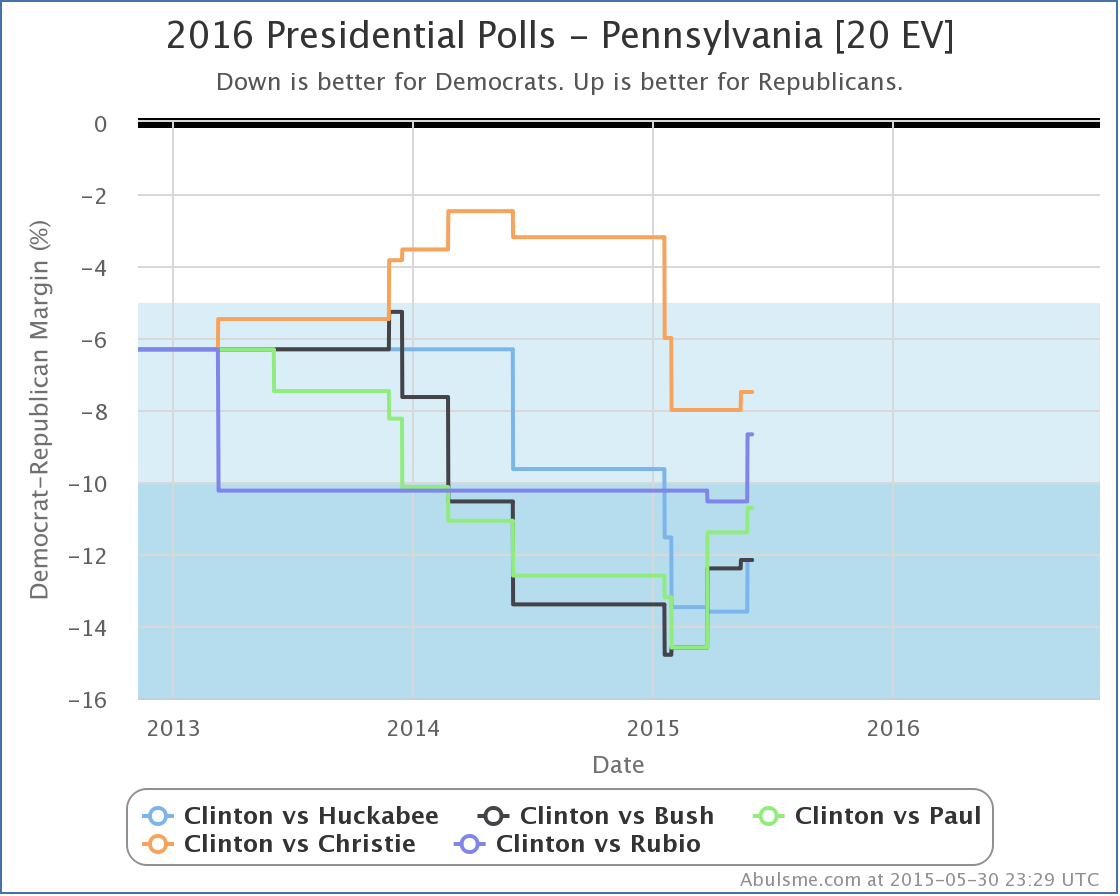
I added some recent results from PPP in Pennsylvania today. PPP polled 13 candidate combinations. Of these only one resulted in a change worth noting in one of our top five best polled candidate combinations. (I consider it a change worth noting if the expected electoral result changes, or the “best case” of one of the two candidates changes, or the tipping point changes.) Clinton vs Christie The polling average (which actually contains 6 polls right now rather than the usual five since there is a tie for fifth oldest poll by middate) still shows Clinton with a “Strong” lead, but slightly less of a lead than before. The state doesn’t change categories though, it isn’t close to a “Weak Clinton” state. But it turns out that in Clinton vs Christie, Pennsylvania was the tipping point state, so the topping point changes. For those who don’t remember, the tipping point is determined by sorting the states by the support level of the candidates, and then seeing which state is the one that would put the winning candidate over the edge. By then looking at the margin in that state, you see how far ahead polls would have to swing on a national basis to change the outcome of the election. In other words, this is a bit like looking at national popular vote numbers, but taking into account the structure of the electoral college. More than most of the other numbers I look at, this represents how far ahead (or behind) a candidate is. In this case, the tipping point was Pennsylvania, where Clinton was ahead by 8.0%. With the new poll added, the tipping point is still Pennsylvania, but Clinton’s lead is down to 7.5%. This is the first improvement for Christie in ANY of the metrics I track for Clinton vs Christie since February of last year. Is this the sign of a resurgence for Christie? I kind of doubt it. That ship may have sailed. But it may represent him getting to the point where he won’t get any lower. The Others It is worth looking at how some of the other candidates are doing in Pennsylvania though. Here are the Pennsylvania trends for the five best polled candidate combinations at the moment: With Christie now enjoying an upward tick of his own, all five Republicans have been improving in Pennsylvania in the last month or so. Bush, Paul and Rubio are all better off than they were at the November elections as well. (Huckabee and Christie are still down from where they were at that point despite the bump in the last month.) Some of the most recent individual polls in Pennsylvania actually have the state close for some of these candidates against Clinton, but the average isn’t there yet. It is showing movement though. So it is certainly possible we will see further polls confirm Pennsylvania getting closer. Pennsylvania is a big state (20 electoral votes). If Pennsylvania is in play, it opens up a lot more possibilities for the Republicans. So keep an eye on the polls here. Note: This post is an update based on the data on my 2016 Electoral College Analysis Site. All of the charts and graphs seen here are from that site. Graphs, charts and raw data can be found there for the race nationally and in each state for every candidate combination that has been polled at the state level. In addition, comparisons of the best polled candidate combinations both nationally and each in each state are available. All charts above are clickable to go to the current version of the detail page the chart is from, which may contain more up to date information than the snapshots on this page, which were current as of the time of this post. |
||
