- 14:24:17 Poll Added: Marist in IA from 2015-08-26 to 2015-09-02 – Clinton 39% to Bush 50% http://t.co/b0d0eNv2ye
- 14:24:24 Clinton vs Bush state category change: IA has moved from Weak Clinton to Weak Bush http://t.co/b0d0eNv2ye
- 17:16:55 Clinton vs Bush expected case changed: Clinton 314 to Bush 224 -> Clinton 308 to Bush 230 http://t.co/zlOn5p1ks0
- 17:29:18 Poll Added: Marist in IA from 2015-08-26 to 2015-09-02 – Clinton 43% to Trump 48% http://t.co/S57RAoU4o5
- 17:36:01 Poll Added: Marist in IA from 2015-08-26 to 2015-09-02 – Biden 44% to Bush 46% http://t.co/I5OOfWMBr8
- 18:01:44 Poll Added: Marist in IA from 2015-08-26 to 2015-09-02 – Biden 49% to Trump 45% http://t.co/t0sJPYaVO9
- 18:01:54 Biden vs Trump state category change: IA has moved from Strong Biden to Weak Biden http://t.co/t0sJPYaVO9
- 18:05:28 Trump best case vs Biden has changed: Biden 257 to Trump 281 -> Biden 251 to Trump 287 http://t.co/ffQ3SzHfoJ
- 18:15:49 Poll Added: Marist in NH from 2015-08-26 to 2015-09-02 – Clinton 43% to Bush 48% http://t.co/1JdPL69yx9
- 18:18:53 Poll Added: Marist in NH from 2015-08-26 to 2015-09-02 – Clinton 46% to Trump 45% http://t.co/Dpke3Nb8D3
- 18:26:48 Poll Added: Marist in NH from 2015-08-26 to 2015-09-02 – Biden 45% to Bush 46% http://t.co/LnOaVYCHfJ
- 18:27:00 Biden vs Bush state category change: NH has moved from Strong Biden to Weak Biden http://t.co/LnOaVYCHfJ
- 18:30:43 Bush best case vs Biden has changed: Biden 231 to Bush 307 -> Biden 227 to Bush 311 http://t.co/nm0y6KxjNr
- 18:34:27 Poll Added: Marist in NH from 2015-08-26 to 2015-09-02 – Biden 50% to Trump 41% http://t.co/V9cNZWu9cr
- 18:34:38 Biden vs Trump state category change: NH has moved from Strong Biden to Weak Biden http://t.co/V9cNZWLKB1
- 18:35:30 Trump best case vs Biden has changed: Biden 251 to Trump 287 -> Biden 247 to Trump 291 http://t.co/vFHQivK9qk
- 19:42:06 That’s all for today. Fixed a couple bugs while I was entering data as well. One change of note, so blog post a bit later.
- 22:04:09 [Blog Post] Electoral College: Iowa average flips to Bush http://t.co/BKke3lZodNa
|
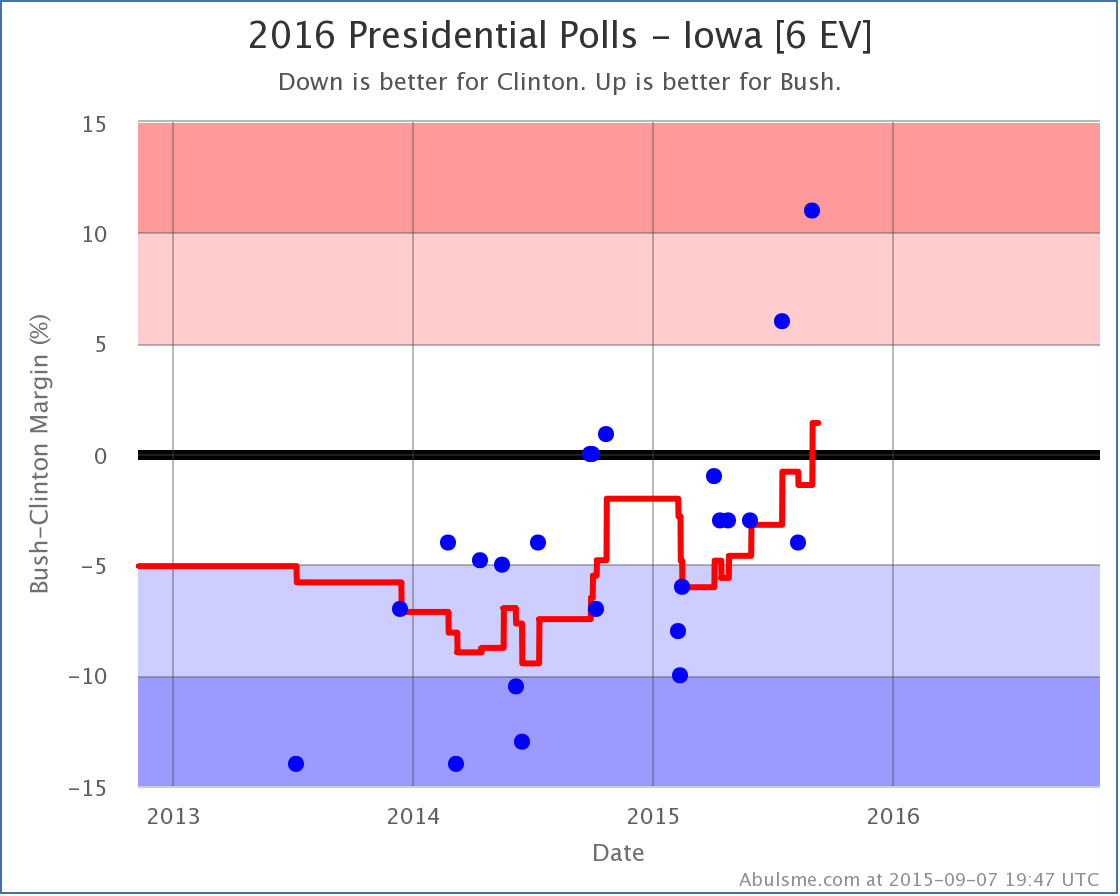
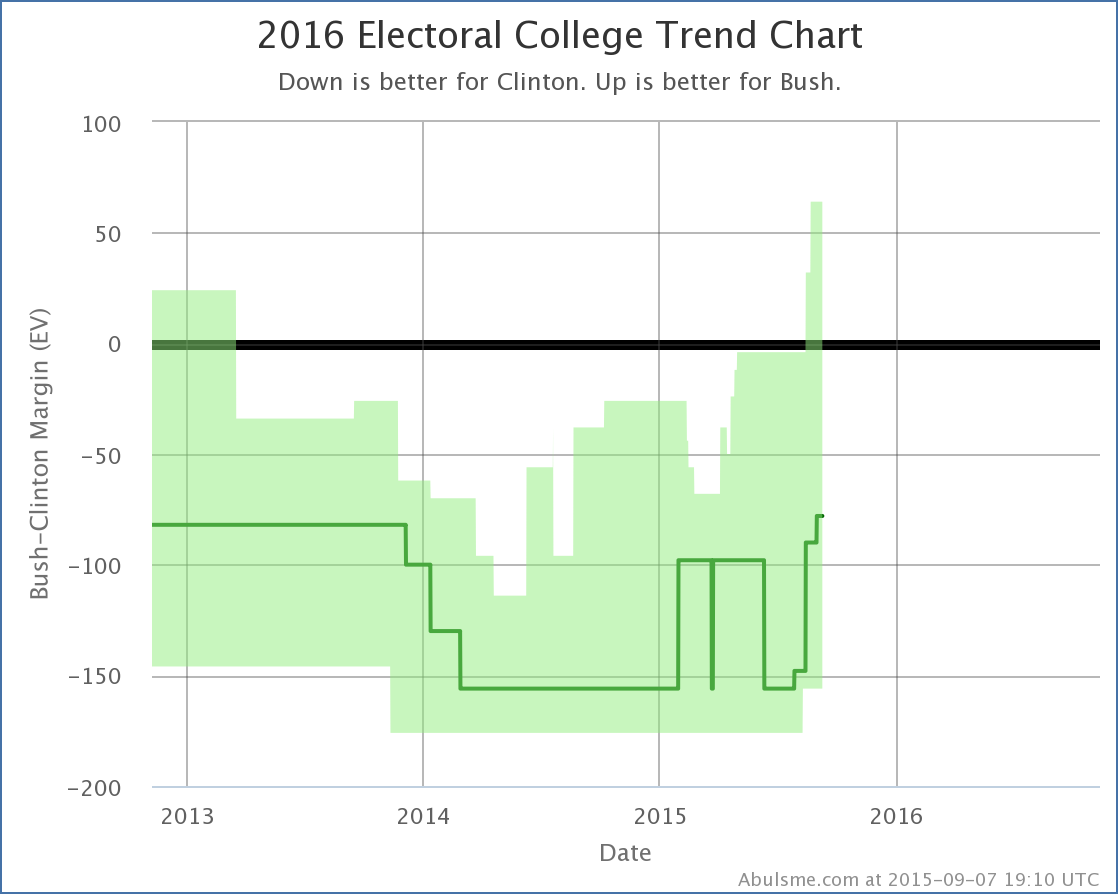
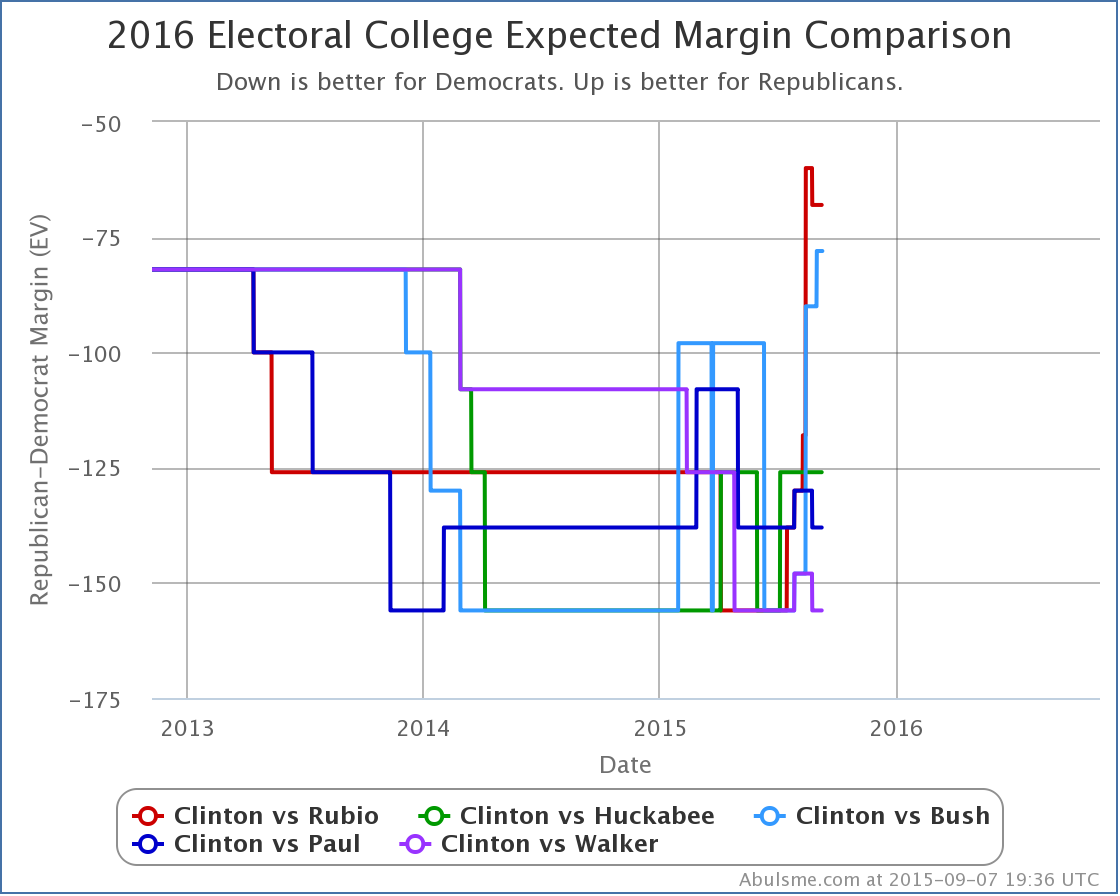
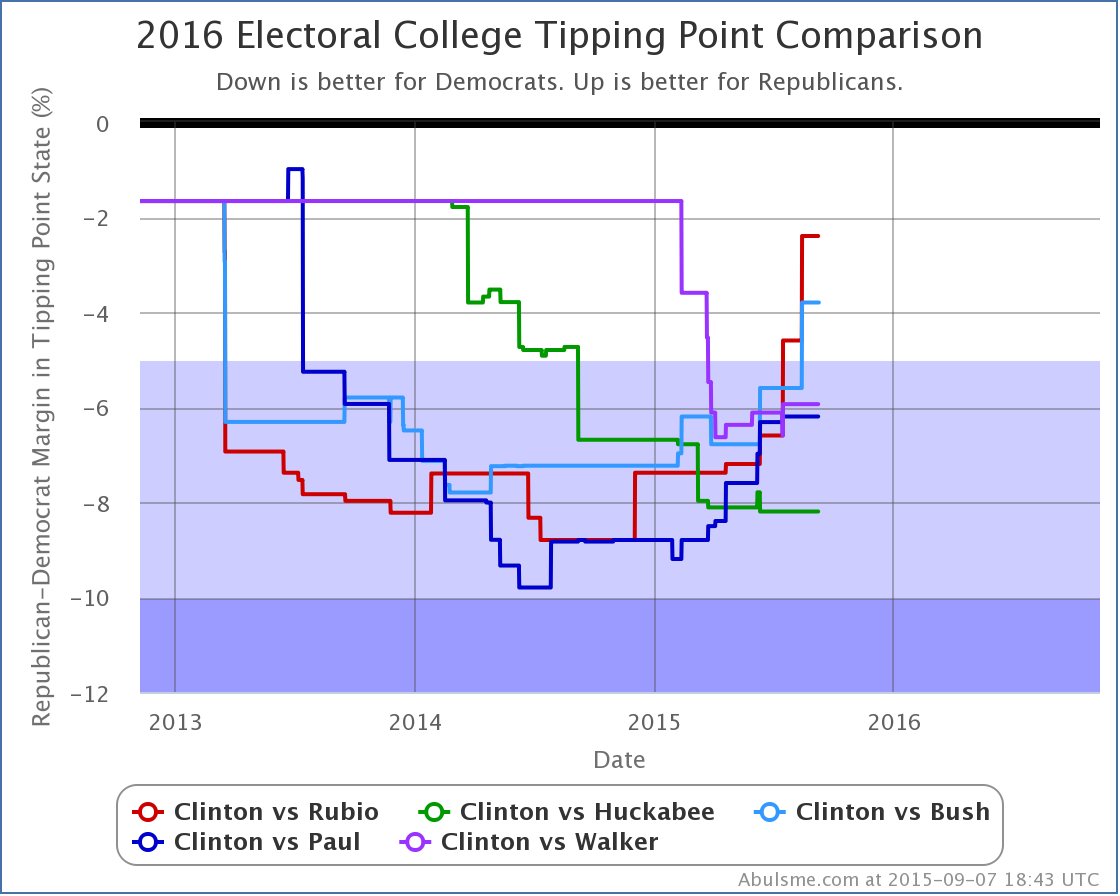
Well, last time I noted the “First good news for Clinton in months!“. I mentioned then that one data point does not make a trend. And today, with the next change worth noting to the five best polled candidate combinations, we indeed don’t get more good news for Clinton. Instead, this time we get Iowa flipping to Bush: Only two of the last five polls in Iowa show a Bush lead, but they both show big leads. When averaged out, you have a 1.4% Bush margin… and a trend which has been moving away from Clinton since February. If the moves toward Hillary in New Hampshire mentioned in that last post were the start of any bottoming out for Clinton, there is no evidence of it here in Iowa. Indeed, if anything, the trend away from Clinton seems to be accelerating. In the national Bush vs Clinton view, Bush is now losing by 78 electoral votes in the “expected” case where each candidate wins every state where they lead the poll averages. Yes, this is still a loss, but it is better than Bush has done in this matchup since the start of polling for 2016. Looking at how Bush is doing compared to the rest of the best polled Republicans, Rubio is still doing better against Clinton, but Bush isn’t far behind. Huckabee, Paul and Walker’s margins against Clinton are significantly worse. In this particular view, they aren’t really gaining on Clinton at all. This doesn’t give the full picture though, as a quick look at the tipping point shows: Bottom line, despite the move in her direction last time, the overall trends continue to be against Clinton. When and if this deterioration stops, and how that affects the primary races, is the big question of the campaign at the moment. 428.1 days until the first general election polls close. Note: This post is an update based on the data on ElectionGraphs.com. All of the charts and graphs seen here are from that site. Graphs, charts and raw data can be found there for the race nationally and in each state for every candidate combination that has been polled at the state level. In addition, comparisons of the best polled candidate combinations both nationally and each in each state are available. All charts above are clickable to go to the current version of the detail page the chart is from, which may contain more up to date information than the snapshots on this page, which were current as of the time of this post. Follow @ElecCollPolls on Twitter for specific poll details as I add them.
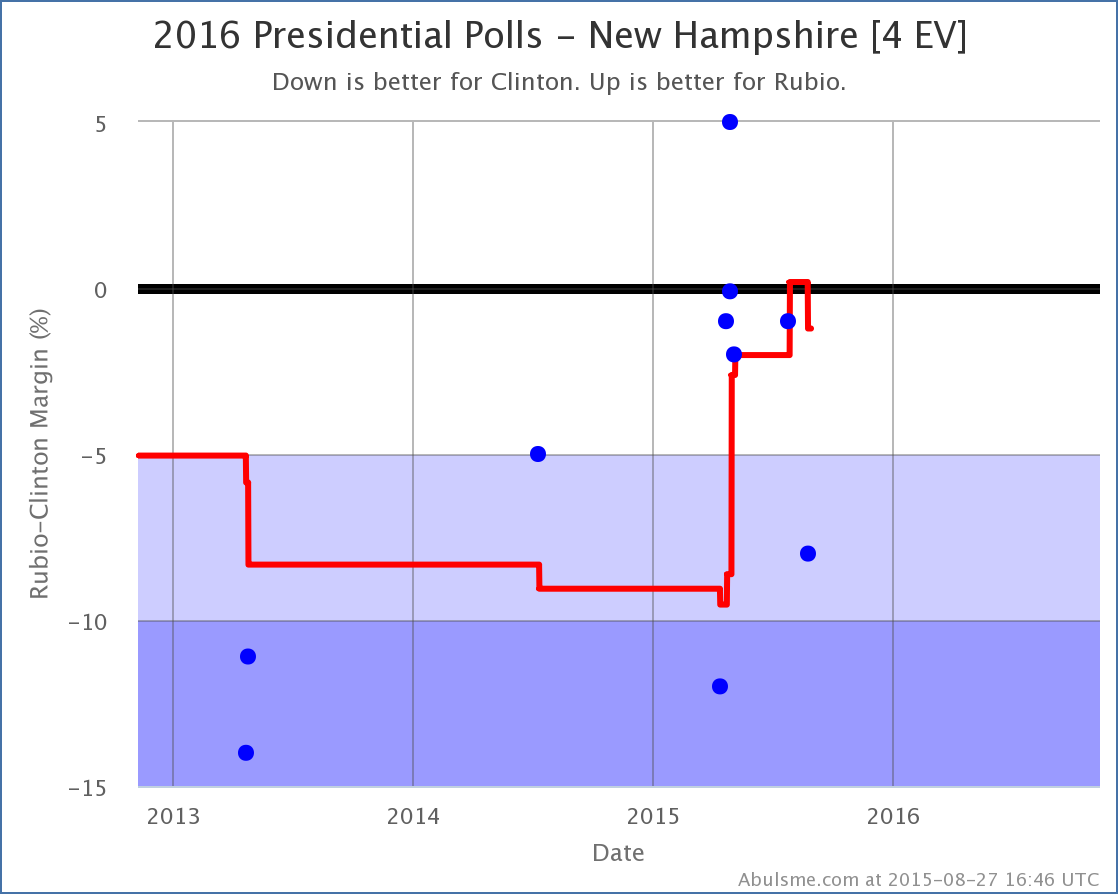
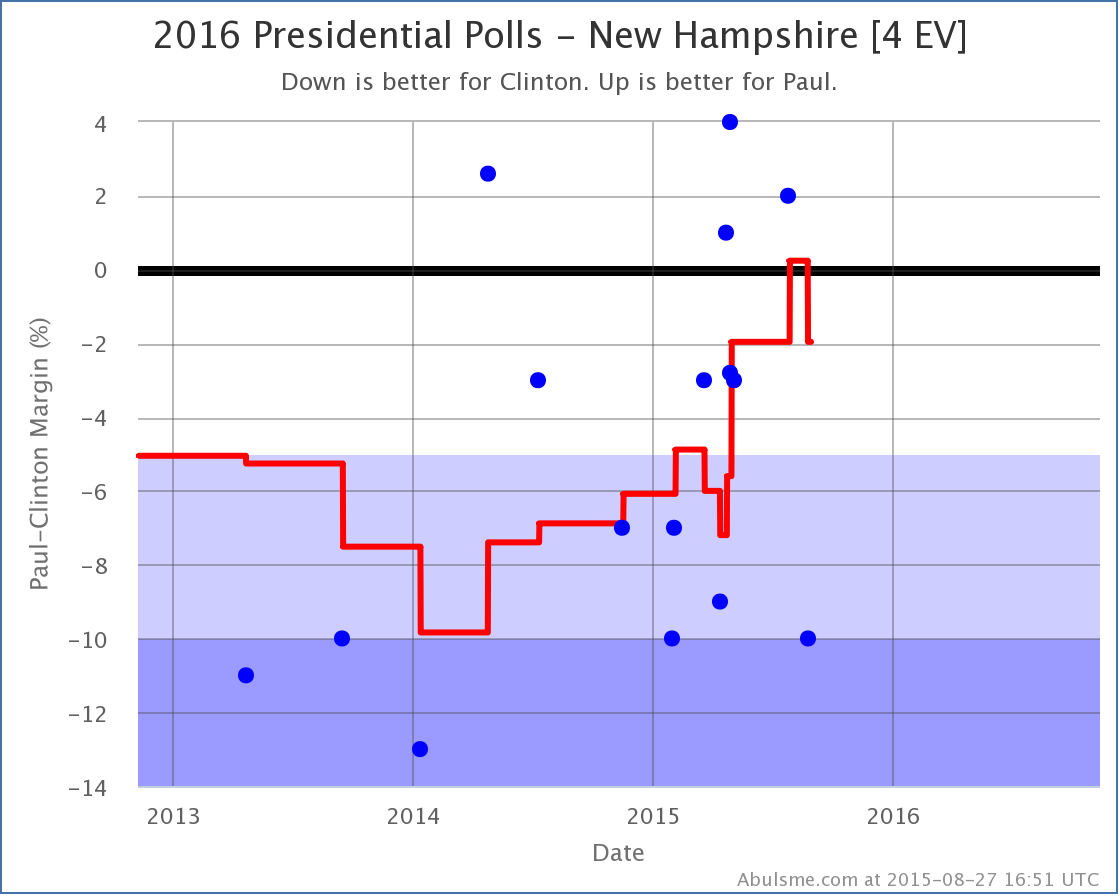
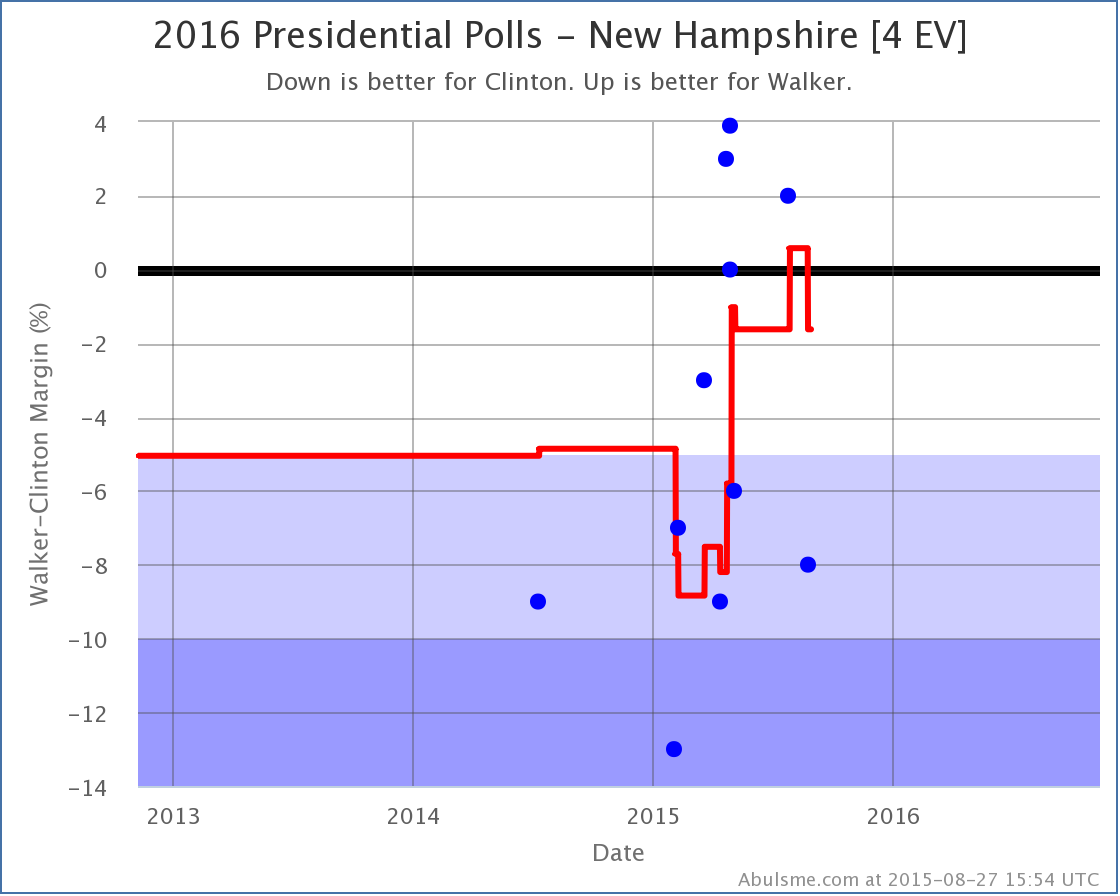
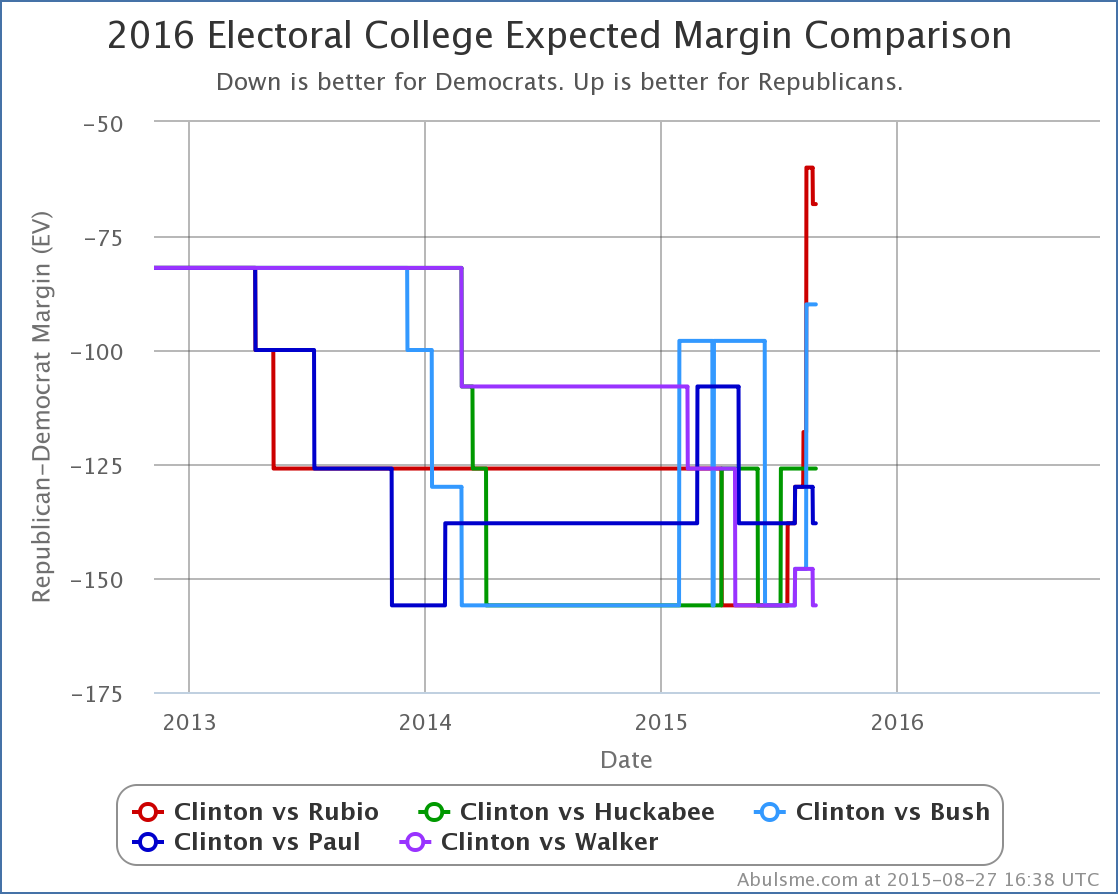
I’ve mentioned a number of times at this point that Clinton has had a long streak of bad news. The last time one of my updates was unambiguously positive for Clinton was back in May! That streak ends today, with movement in New Hampshire prompted by a new PPP poll. Three of the top five best polled candidate combinations flipped from “Weak Republican” to “Weak Clinton” because of this update: So for Rubio, Paul and Walker, New Hampshire flips back to blue (although not by much). Clinton vs Bush just narrowly avoided doing the same thing, as Bush’s margin declined from 1.6% to 0.2%, but didn’t quite pass over the line. New Hampshire is a little state. Only 4 electoral votes. If you look at the “expected cases” this just makes a small move for each of these three candidates: As a move, this isn’t all that much. And Clinton is significantly ahead on this metric against all five Republicans. So New Hampshire’s electoral votes aren’t determining the outcome here. But after three months solid of posts where I’ve been talking about how the Republican position is getting stronger, and Clinton’s position was getting weaker, is there significance to a move, any move, actually going in Clinton’s direction? Well, maybe. But one point does not make a trend. This could be an indicator that Clinton has bottomed for now and we’re not going to see further declines for the time being. Or, just as easily, perhaps these PPP results are a significant outlier, and not representative of an actual change of mood in New Hampshire, in which case the next New Hampshire polls may pull the state back into the red zone. As usual, we will just have to wait and see. In the meantime though, Clinton’s losing streak has been broken. 493.0 days until polls start closing. Note: This post is an update based on the data on ElectionGraphs.com. All of the charts and graphs seen here are from that site. Graphs, charts and raw data can be found there for the race nationally and in each state for every candidate combination that has been polled at the state level. In addition, comparisons of the best polled candidate combinations both nationally and each in each state are available. All charts above are clickable to go to the current version of the detail page the chart is from, which may contain more up to date information than the snapshots on this page, which were current as of the time of this post. Follow @ElecCollPolls on Twitter for specific poll details as I add them.
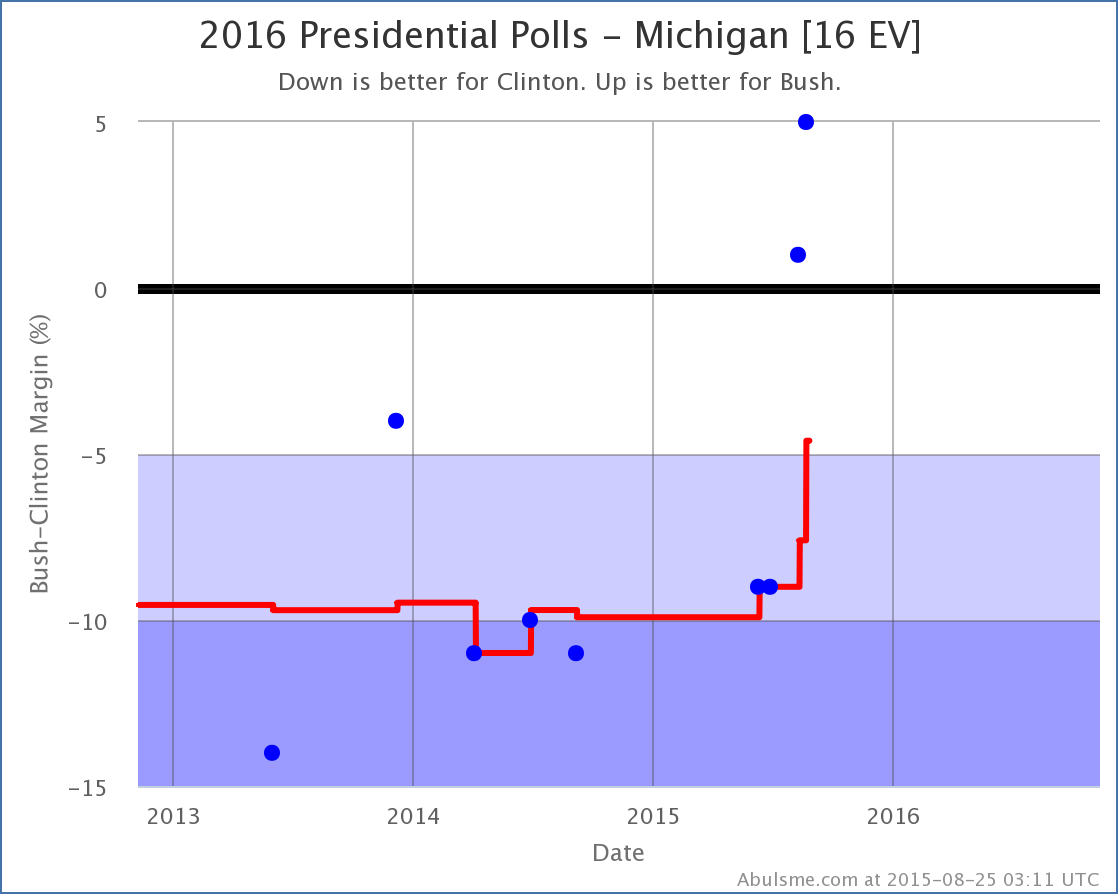
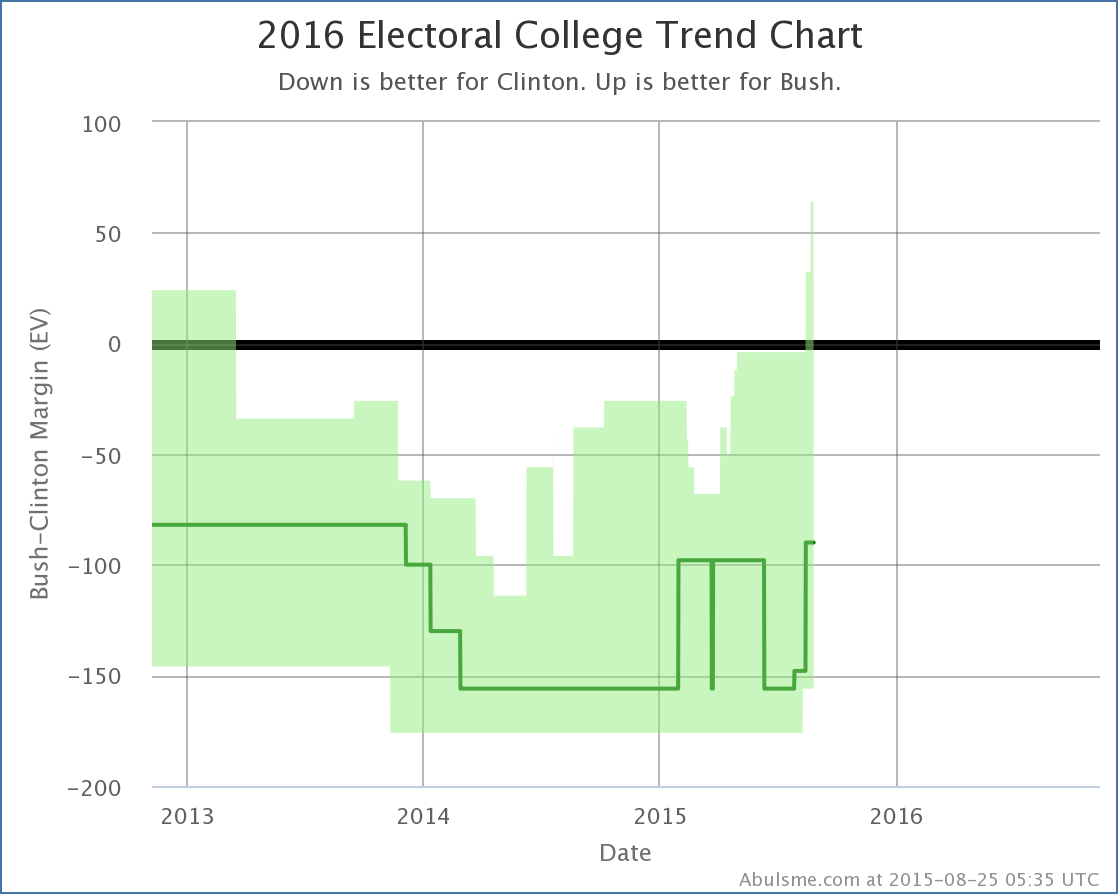
The streak continues. More bad news for Clinton. This time in Michigan. With the addition of Michigan polls from Mitchell and EPIC-MRA, Michigan moves from Strong Clinton to Weak Clinton: This pattern, a hockey stick type movement away from Clinton and toward various Republicans, has now shown up on the charts for quite a few different states, across a wide variety of Republicans. One or two of these in isolation look like outliers, but together they look like a real movement. Over the last few months Clinton has been weakening, and weakening quickly and dramatically. So far, none of the Republicans are leading overall, but the best cases from Rubio and Bush both now include winning, and with Michigan now on the potential list for Bush as well, he improves his best case further: Bush’s best case, where he wins all of the states where he leads, plus all the states where Clinton is ahead by less than 5%, now is Clinton 237, Bush 301, a 64 electoral vote win for Bush. The expected case is still a 90 electoral vote loss for Bush, but he’s only a handful of close states away from a win. If the drumbeat against Clinton continues, do not be surprised if some of those states start to flip. Clinton can’t be happy here. She is now below 50% in the Real Clear Politics national view of the Democratic nomination race, and her position in the general election has been slipping fast against the major Republican contenders. No wonder we’re getting all the Biden buzz, and people keep looking at Sanders. Right now she is showing weakness. The question is if she hits a floor, or keeps falling. And if she does keep falling, who takes advantage of it? 441.7 days until the polls start closing. Note: This post is an update based on the data on ElectionGraphs.com. All of the charts and graphs seen here are from that site. Graphs, charts and raw data can be found there for the race nationally and in each state for every candidate combination that has been polled at the state level. In addition, comparisons of the best polled candidate combinations both nationally and each in each state are available. All charts above are clickable to go to the current version of the detail page the chart is from, which may contain more up to date information than the snapshots on this page, which were current as of the time of this post. Follow @ElecCollPolls on Twitter for specific poll details as I add them. |
||
